Technical Analysis Guides – Part 14: Uptrend & Downtrend – Reading Market Direction With Confidence
Every chart tells a story about crowd behaviour. Sometimes that story is one of steady accumulation and rising prices; at other times it is about distribution, caution and decline. Technical analysts describe these broad movements as uptrends and downtrends.
Learning to recognise these trends does not turn markets into a certainty. It simply helps you answer three crucial questions:
- Is the market generally rewarding buyers or sellers right now?
- Am I trying to move with that flow, or against it?
- How should that affect my position size, expectations and level of patience?
This article is for education only. It is not financial, investment, tax or legal advice, and it does not suggest that you should buy, sell or hold any specific asset.
1. What Is a Trend?
In technical analysis, a trend is the general direction of price over a chosen period. It is not defined by one candle or one day of news, but by a sequence of highs and lows observed over time.
By convention:
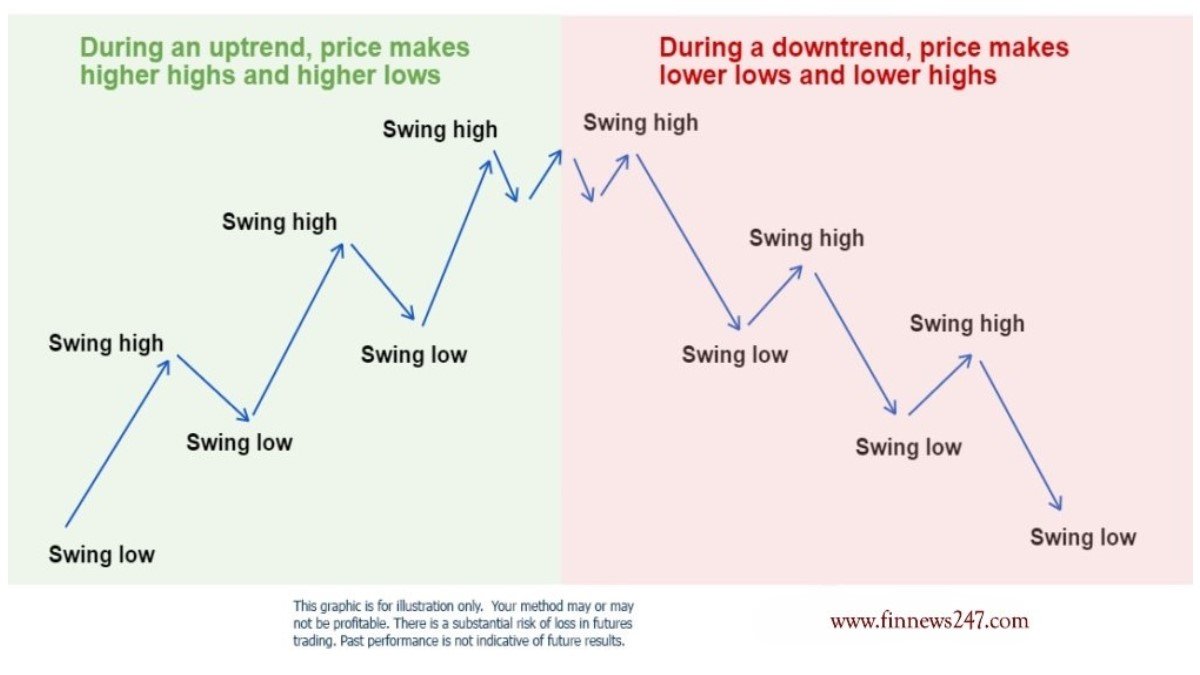
- An uptrend is a pattern of higher highs and higher lows.
- A downtrend is a pattern of lower highs and lower lows.
- When neither side dominates and price moves sideways, the market is said to be in a range or consolidation.
Importantly, trends are timeframe-dependent. An asset can be in an uptrend on the daily chart while still experiencing a short-term pullback on the 15-minute chart. That is why many analysts always start from the higher timeframes and then zoom in.
2. Uptrend – When Buyers Hold the Initiative
2.1 Definition of an Uptrend
An uptrend is a market environment where price tends to make successive highs and lows at increasing levels. In plain language: each meaningful dip stops above the previous dip, and each meaningful rally pushes above the previous high.
On a chart, this looks like a staircase moving from the lower left to the upper right. The path is never perfectly smooth—there are pullbacks and pauses—but the general slope is upwards.
2.2 Visual Clues of an Uptrend
Analysts often look for several elements to confirm an uptrending environment:
- Price structure: clear higher highs and higher lows over a series of swings.
- Trendline support: a diagonal line drawn beneath rising lows that price respects multiple times.
- Moving averages: commonly used averages (for example 20, 50 or 200 periods) are sloping upward, with price trading mostly above them.
- Momentum indicators: tools such as RSI or MACD show positive or improving momentum, often spending more time above their midlines (e.g. RSI above 50).
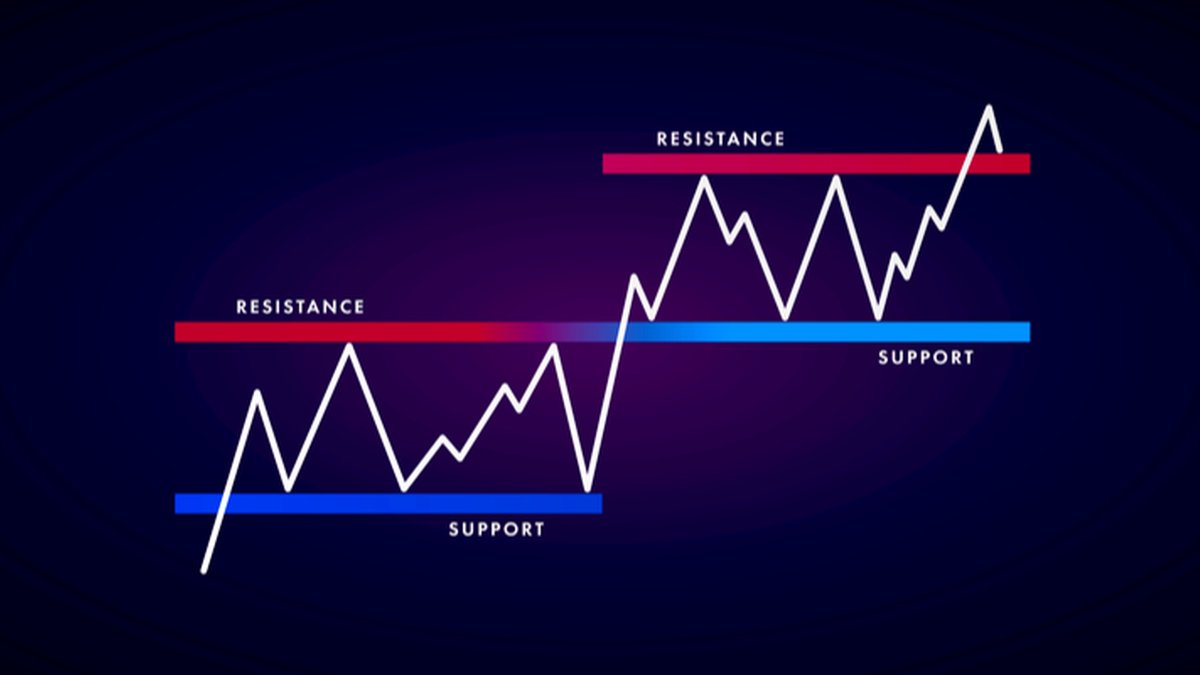
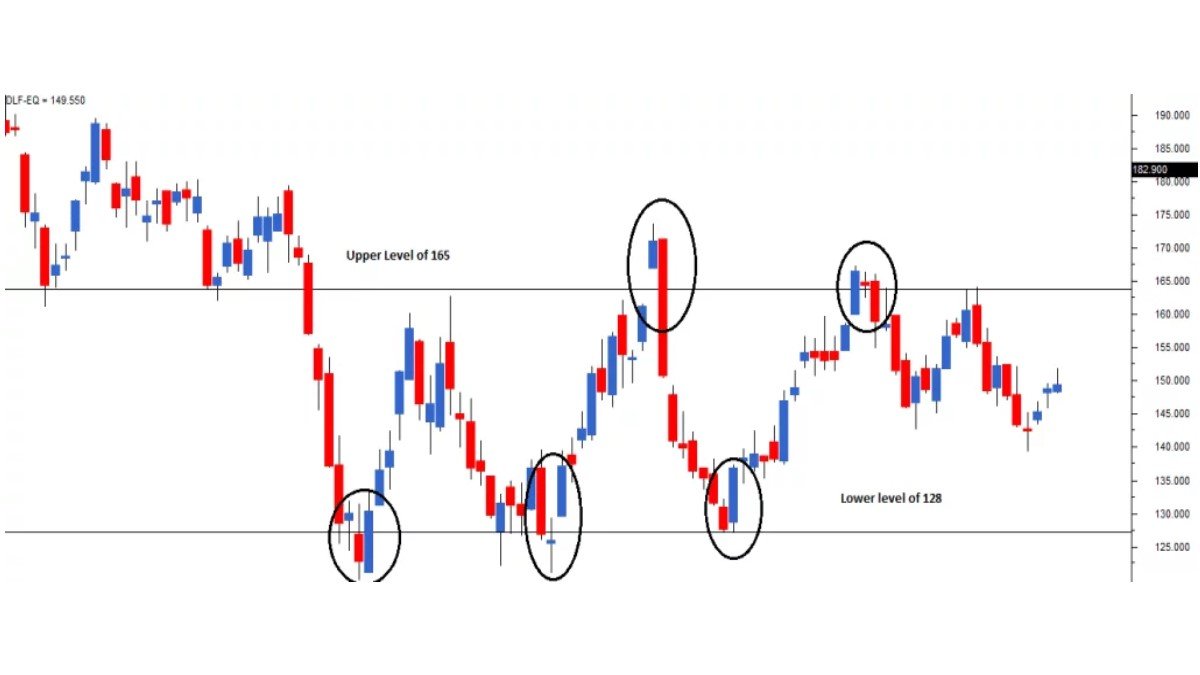
- Breaks of resistance: former ceilings are exceeded and sometimes later act as support on pullbacks.
None of these factors alone “prove” an uptrend, but together they create a coherent picture of demand being willing to pay progressively higher prices.
2.3 Tools Commonly Used to Track Uptrends
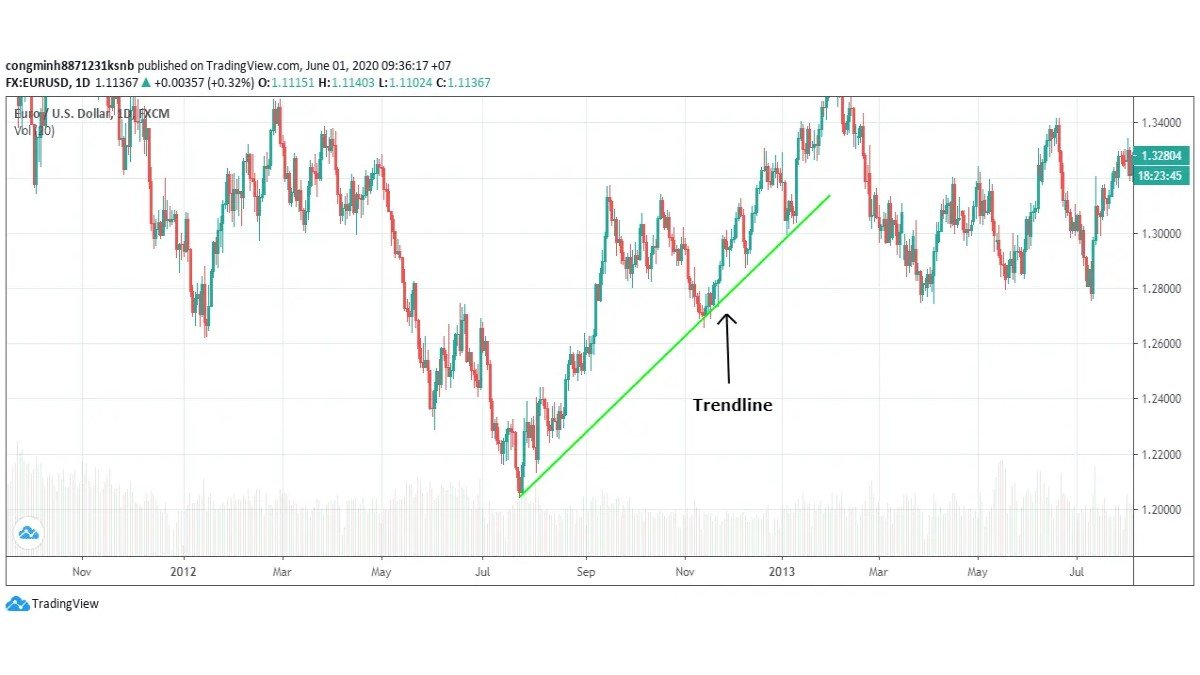
Trendlines
A simple way to visualise an uptrend is to draw a trendline beneath the lows:
- Connect at least two significant swing lows; a third touch often increases confidence.
- The line should broadly reflect the slope of the move without forcing it through random spikes.
This line acts as a guide to the current pace of the trend. If price repeatedly respects it, some participants view it as a reference area for pullbacks. If price starts to close decisively below it, that can be an early warning that the character of the trend is changing.
Moving Averages (MA)
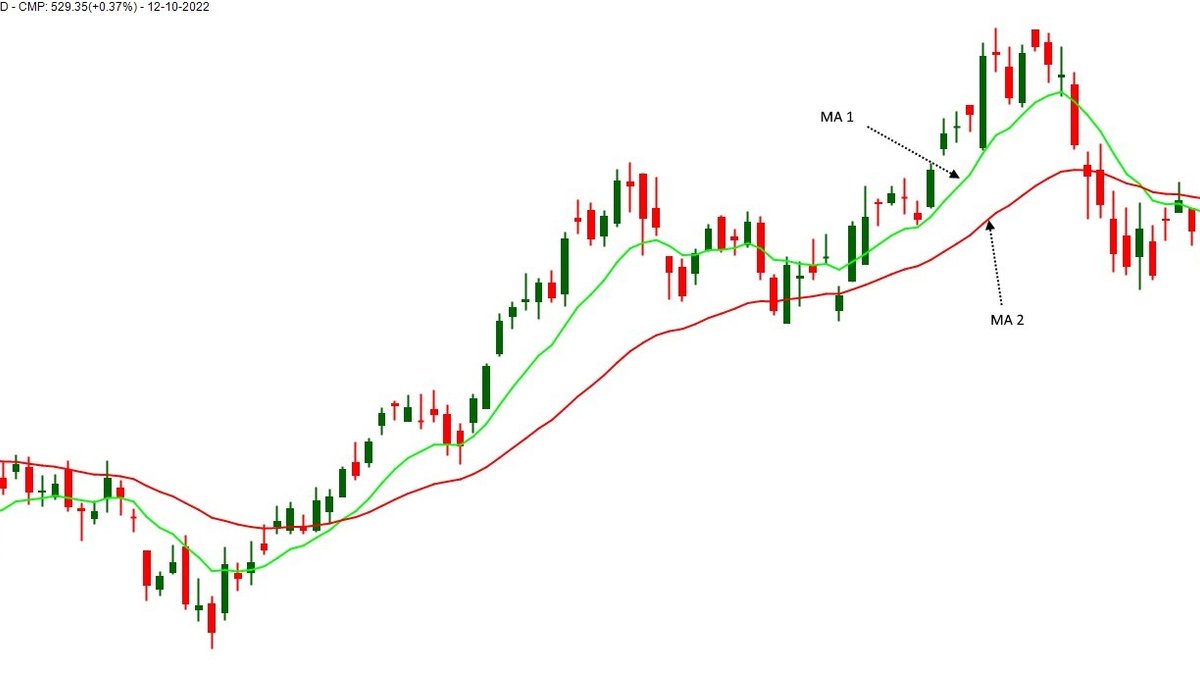
Moving averages smooth out price data and are frequently used to gauge trend direction:
- Shorter-term MAs (e.g. 20-period) highlight more recent behaviour.
- Longer-term MAs (e.g. 50- or 200-period) show broader structural trends.
In many uptrends:
- Price often trades above the chosen MA.
- The MA itself slopes upward.
- Pullbacks into the MA can coincide with areas where demand reappears.
Some traders observe crossovers—for example, when a faster MA moves above a slower one—as an additional confirmation that upward momentum is strengthening, especially on higher timeframes.
MACD and RSI
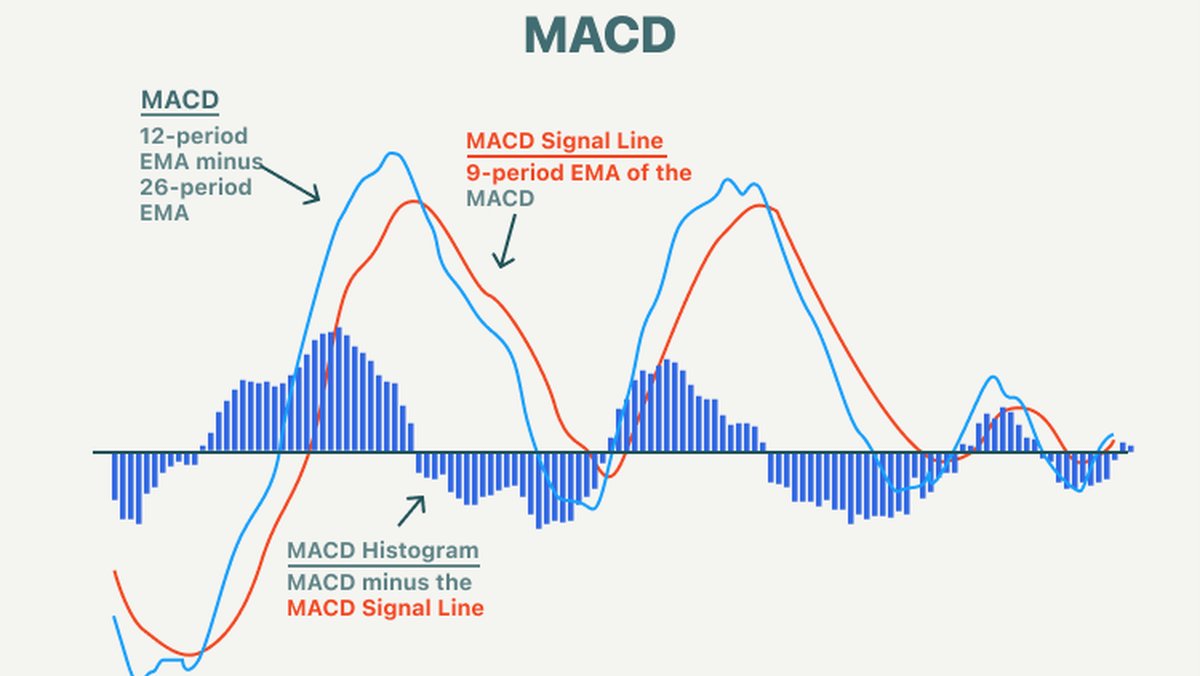
The combination of MACD (Moving Average Convergence Divergence) and RSI (Relative Strength Index) can offer extra context:
- In many healthy uptrends, MACD tends to stay above or near its zero line.
- RSI frequently spends more time above 50, occasionally entering overbought territory for strong moves.
Analysts also pay attention when price makes a new high but momentum tools do not. This bearish divergence can be an early sign that the uptrend is losing strength, although it does not guarantee an immediate reversal.
2.4 Practical Considerations in an Uptrend
In an uptrend, different market participants may:
- Look for opportunities to build or add to positions on pullbacks to support zones.
- Use former resistance levels as potential areas to take partial profits.
- Set risk limits below key higher lows, recognising that a break of those levels may signal a change in structure.
Others may choose not to participate at all if they feel price has moved too far from their estimate of fair value. A trend environment does not oblige anyone to trade; it simply frames the background.
2.5 When Does an Uptrend End?
No uptrend lasts forever. Signs that a mature uptrend may be weakening include:
- Price fails to make a new high after several attempts.
- The latest low undercuts the previous swing low, breaking the pattern of higher lows.
- Moving averages flatten or start to roll over, with price spending more time below them.
- Momentum indicators show persistent loss of strength rather than brief pauses.
Sometimes these changes lead to a sideways range; sometimes they precede a full downtrend. External events—regulatory announcements, macroeconomic shifts, technology incidents or global risk sentiment—can accelerate this transition, but the chart usually leaves structural clues.
3. Downtrend – When Sellers Are in Control
3.1 Definition of a Downtrend
A downtrend is the opposite side of the coin: a sequence of lower highs and lower lows. Each bounce fails to reach the height of the previous one, and each decline extends below the prior low.
On a chart, this looks like a staircase from the upper left to the lower right. As with uptrends, there are counter-moves and periods of calm, but the general direction is downward.
3.2 Visual Clues of a Downtrend
Key elements often seen in downtrends include:
- Price structure: clear lower highs and lower lows over multiple swings.
- Descending trendline: a line drawn across falling highs that price respects repeatedly.
- Moving averages: key MAs slope downward, with price trading mainly below them.
- Momentum: indicators such as RSI spend more time below 50; MACD often sits below its zero line.
- Breaks of support: former floors are broken and sometimes act as ceilings on later rallies.
3.3 Additional Clues Beyond the Chart
Although this guide focuses on charts, some participants also observe:
- Overall market capitalisation: persistent decreases in total value across a sector can highlight risk-off behaviour.
- Flows and participation: reduced activity from new entrants and quieter retail engagement can align with defensive positioning.
- News and macro backdrop: prolonged negative headlines or tightening financial conditions often coincide with broader downtrends.
These contextual clues do not replace chart analysis, but they can help explain why a trend persists for longer than many expect.
3.4 How Participants Navigate Downtrends
Downtrends can feel uncomfortable, especially for newer investors. Some common responses include:
- Capital preservation: focusing on reducing exposure, trimming weaker positions or shifting towards assets with lower volatility.
- Staying on the sidelines: choosing to hold more cash or stable assets rather than trying to time every move.
- Structured accumulation: some long-term investors use gradual, pre-planned buying strategies during extended declines, fully aware of the risks.
- Short-term trading: experienced traders may look for short-lived counter-moves or trend-following opportunities with tight risk limits.
There is no universal “correct” approach. The key is that any action is consistent with one’s time horizon, risk tolerance and understanding of the instruments being used.
3.5 Emotional Dynamics in Downtrends
Downtrends are not just about price; they are also about psychology:
- Optimism from prior uptrends slowly turns into doubt, then frustration.
- Participants may focus more on recouping past losses than on making objective decisions.
- News and commentary often become more pessimistic near major lows.
Recognising these emotional patterns does not make them disappear, but it can help you pause, refer back to a written plan and avoid decisions made purely out of fear or impatience.
4. Comparing Uptrend and Downtrend
Although they move in opposite directions, uptrends and downtrends share several structural features:
- Both are built from a series of swings and reactions, not straight lines.
- Both can be analysed using the same tools: price structure, trendlines, moving averages and momentum indicators.
- Both eventually mature, slow and transition into ranges or into the opposite trend.
The practical differences lie mainly in risk perception and position management:
- In uptrends, many participants think about how to protect gains and avoid chasing too far from their reference levels.
- In downtrends, many focus on capital preservation, emotional discipline and distinguishing between temporary declines and deeper structural changes.
5. Timeframes and Multi-Layered Trends
One of the most important concepts for any technical analyst is that there can be different trends on different timeframes:
- A market may be in a long-term uptrend on the weekly chart.
- Within that, it could be undergoing a medium-term pullback on the daily chart.
- On the intraday chart, there may be alternating micro-trends as traders negotiate the correction.
To avoid confusion, many practitioners:
- Define a primary timeframe that matches their typical holding period.
- Use one higher timeframe to understand the background trend.
- Optionally use one lower timeframe to refine entries and exits.
What matters is consistency. Regularly switching timeframes without a clear plan can make any chart look contradictory.
6. Common Mistakes When Working With Trends
Some issues appear again and again in practice:
- Assuming trends will last forever: extrapolating recent moves indefinitely and ignoring signs of maturity.
- Fighting strong trends too early: repeatedly taking counter-trend positions without any structural evidence of change.
- Ignoring risk limits: focusing on potential gain while neglecting scenario planning for adverse moves.
- Over-relying on one tool: treating a single crossover or pattern as decisive instead of considering broader context.
Many of these mistakes can be mitigated by simple practices: using written checklists, sizing positions modestly relative to total capital, and reviewing trades periodically to learn from outcomes.
7. Building a Simple Trend-Focused Workflow
If you want to integrate trend analysis into your routine in a brand-safe, structured way, you might:
1. Choose your primary timeframe. Decide whether you care most about daily swings, multi-week moves or something else.
2. Assess trend direction. On the higher timeframe, mark highs and lows, add a trendline and a couple of moving averages, and decide whether the environment is broadly up, down or sideways.
3. Identify key zones. Mark major support and resistance areas that could influence behaviour if price reaches them.
4. Write possible scenarios. For example: “If price is in an uptrend and returns to this support zone, I may consider adding exposure, provided overall risk remains within my limits.”
5. Define risk in advance. For any idea, decide where the trend picture would be clearly wrong for your timeframe, and size the position so that a loss at that point is affordable.
Even if you ultimately choose not to act, this workflow can reduce impulsive decisions and make it easier to communicate your thinking, whether to yourself or to others.
8. Key Takeaways
- Uptrends are defined by higher highs and higher lows; downtrends by lower highs and lower lows.
- Trendlines, moving averages, MACD and RSI can help describe trends but should be read together with price structure, not in isolation.
- Trends exist on multiple timeframes; clarifying which one matters to you is essential.
- Transitions between uptrend and downtrend often pass through noisy ranges; patience and risk control are important in these phases.
- Reading trends is not about prediction certainty, but about aligning expectations and risk management with the prevailing environment.
This guide is for informational and educational use only. It does not constitute financial, investment, tax or legal advice and does not recommend any particular asset, strategy or platform. Digital assets and other financial instruments can be volatile and may not be suitable for every reader. Always conduct your own research and consider consulting a qualified professional before making investment decisions.