Technical Analysis Guides – Part 8: Fibonacci Retracement and Extension
The word Fibonacci appears frequently in technical analysis discussions, from traditional markets to digital assets. Behind the name is a simple idea: a numerical sequence and a set of ratios derived from it seem to describe proportions that show up repeatedly in nature, architecture and, some believe, market behaviour.
In charting platforms, Fibonacci tools do not forecast the future in a mechanical way. Instead, they offer reference levels that many market participants watch when analysing trends, pullbacks and potential areas of interest. Used carefully, they can help bring structure to charts and support more disciplined planning.
This guide is for informational and educational purposes only. It does not provide financial, investment, tax or legal advice.
1. The Fibonacci Sequence and the Golden Ratio
The Fibonacci sequence is generated by a simple rule: each number is the sum of the two preceding numbers. One common version begins:
0, 1, 1, 2, 3, 5, 8, 13, 21, 34, 55, 89, 144, …
As the sequence progresses, the ratio between neighbouring numbers converges toward a constant value close to 1.618. This constant is often referred to as the golden ratio and is frequently denoted by the Greek letter φ (phi).
From this sequence and ratio, a family of percentages is derived and used in charting, including approximately:
• 23.6%
• 38.2%
• 50% (not a true Fibonacci ratio, but widely used as a halfway marker)
• 61.8%
• 78.6% (derived from the square root of 61.8%)
• 100%, 127.2%, 161.8% and beyond for extension work
When you see horizontal Fibonacci lines on a chart, these are usually the percentages being plotted between two reference points.
2. What Is Fibonacci Retracement?
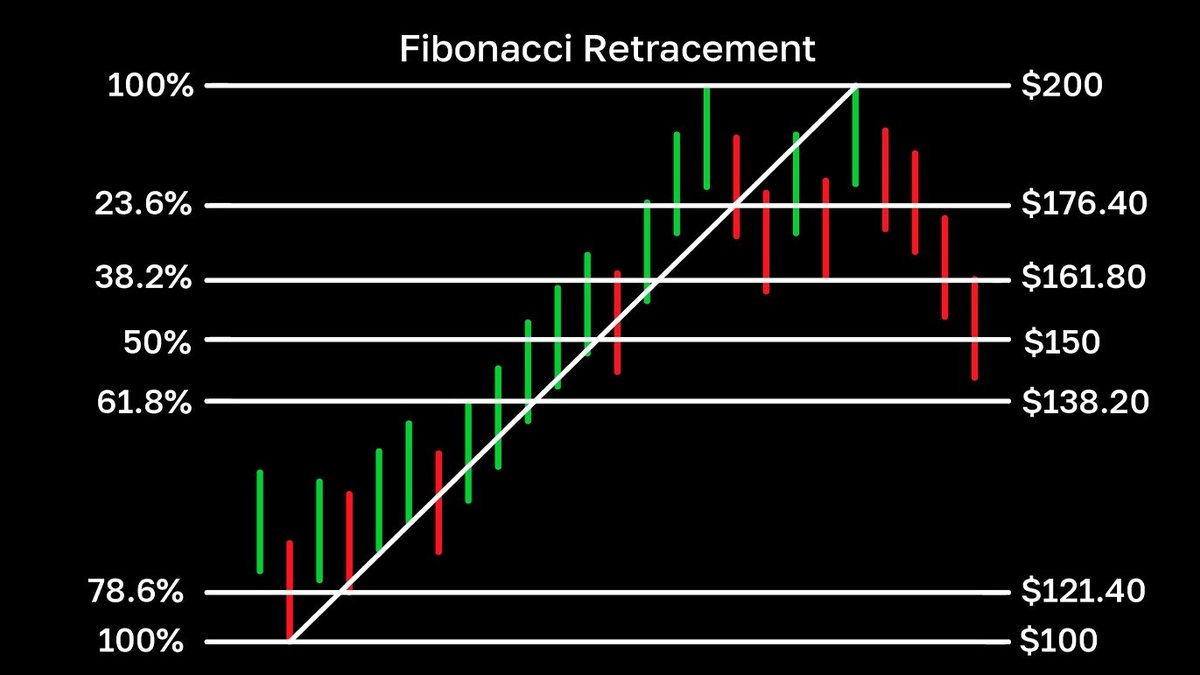
Fibonacci retracement is the most commonly used Fibonacci tool. It is designed to analyse pullbacks inside a move that has already taken place. The idea is that after price travels from point A to point B, it often does not reverse randomly; instead, it tends to give back a portion of that move before either continuing in the original direction or forming a larger reversal.
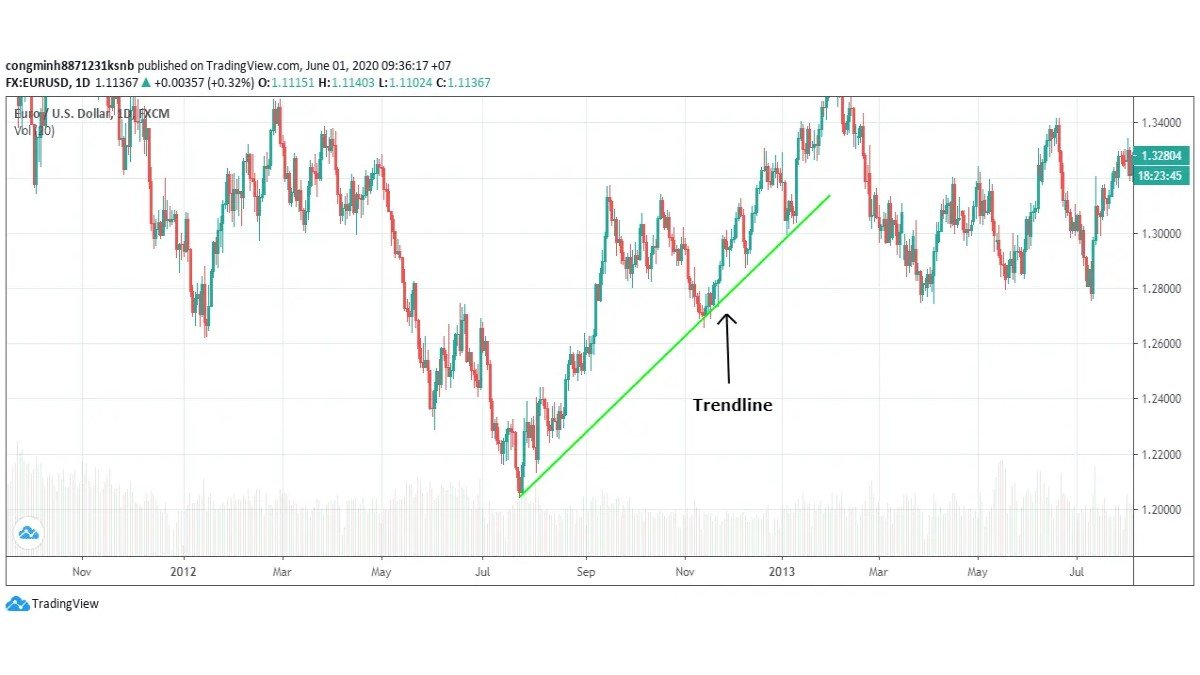
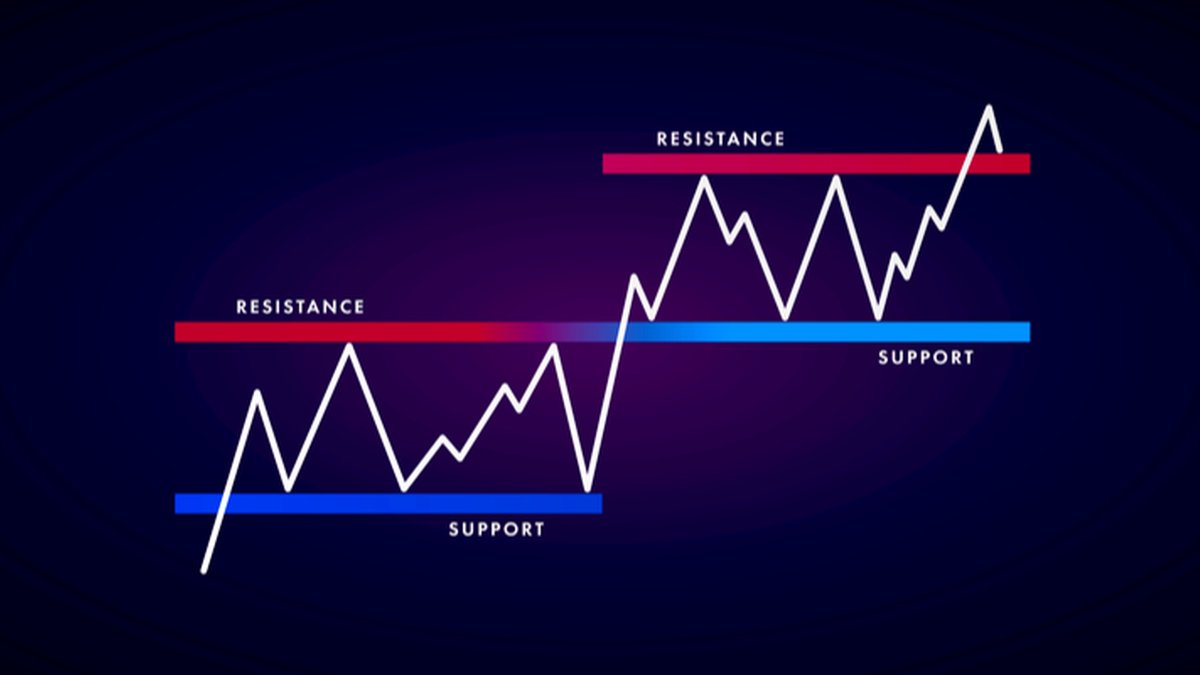
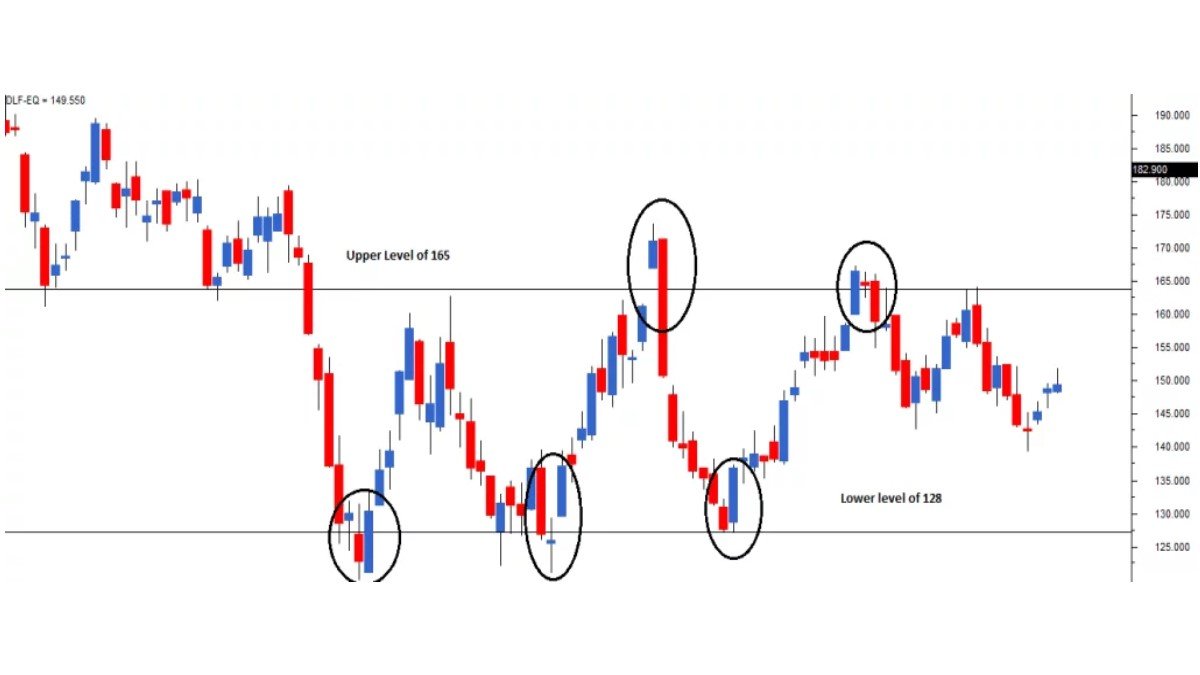
Retracement levels are horizontal lines drawn between a significant low and high (or high and low), marking percentages of that distance—such as 38.2%, 50% and 61.8%. Many chart users monitor these areas as potential support in an uptrend or resistance in a downtrend.
3. Drawing Fibonacci Retracement in an Uptrend
Consider an asset that has moved strongly upward from a clear swing low to a clear swing high.
- Identify the swing low.
This is the point where the upward move visibly began on your chosen timeframe. - Identify the swing high.
This is the subsequent point where the advance paused or reversed. - Apply the Fibonacci retracement tool.
On most platforms, you click at the low and drag to the high. The software then draws horizontal lines at key percentages such as 23.6%, 38.2%, 50%, 61.8% and 78.6% of that height.
As price pulls back from the high, some analysts watch how it behaves near those levels. For example:
- A shallow pullback might stabilise near the 23.6% or 38.2% lines.
- A deeper retracement might test the 50% or 61.8% region.
These observations do not provide certainty, but they can help frame scenarios such as, “If the uptrend is still healthy, it might find interest somewhere within this cluster of levels.”
4. Drawing Fibonacci Retracement in a Downtrend
In a downward phase, the process is the mirror image:
- Identify the swing high where the decline began.
- Identify the swing low where the first leg of the decline paused.
- Apply the retracement tool by dragging from high to low.
The resulting horizontal lines mark potential areas where a rebound might encounter overhead resistance. Again, these are reference zones rather than promises; they become more meaningful when they coincide with other elements such as former support, round numbers or moving averages.
5. Interpreting Retracement Levels: Strengths and Limits
Fibonacci retracement levels are helpful as visual anchors. They encourage analysts to think in terms of structured pullbacks instead of reacting to every tick. However, several important limitations should be kept in mind:
- No level is guaranteed to hold. Price can pause at a retracement level or pass straight through it. The lines mark areas of interest, not walls.
- Swing points are subjective. Different people may choose slightly different highs and lows, resulting in different levels. Experience and consistency in defining swings are important.
- Market context matters. In strong trends, pullbacks may be shallow. In choppy conditions, price may travel through many levels without clear reaction.
Because of this, Fibonacci retracement is often combined with other tools—such as price structure, volume, momentum indicators or basic support/resistance analysis—to build a more complete picture.
6. What Is Fibonacci Extension?
While retracements focus on what happens inside an existing move, Fibonacci extension tools are used to map beyond a recent high or low. They are applied when analysts want to estimate where a continuing move might encounter the next potential area of interest.
Extensions are typically drawn using three points:
- Point 1 – the start of a move
- Point 2 – the end of that move
- Point 3 – the end of the subsequent retracement
From this base, the tool projects levels such as 100%, 127.2%, 161.8%, 200% or 261.8% of the initial move, measured from the retracement point. These percentages represent how far the new leg would travel compared with the original swing.
6.1 Example in an uptrend
Imagine price rises from A to B, then retraces to C. A Fibonacci extension drawn using A–B–C will project horizontal lines above B. These lines represent hypothetical zones where the next upward leg might slow or consolidate.
- The 100% extension implies a move from C equal in size to A–B.
- The 161.8% extension marks a more ambitious projection, corresponding to a continuation 1.618 times the length of A–B.
In practice, some traders watch these extension zones as potential profit-taking areas or structural checkpoints, especially when they overlap with prior highs, psychological round numbers or other forms of resistance.
6.2 Example in a downtrend
In a downward structure, the same logic applies in the opposite direction: the tool projects potential continuation levels below the prior low, helping analysts think about where a decline might begin to slow or where the next area of support could form.
7. Combining Fibonacci With Other Technical Tools
Fibonacci tools tend to work best when they are part of a broader analytical framework rather than the sole input. Some common combinations include:
• Support and resistance zones: Retracement or extension levels that align with previous swing highs, lows or consolidation areas may attract more attention than isolated levels.
• Trendlines and channels: When a Fibonacci level coincides with a trendline or channel boundary, the confluence can sharpen the area of focus.
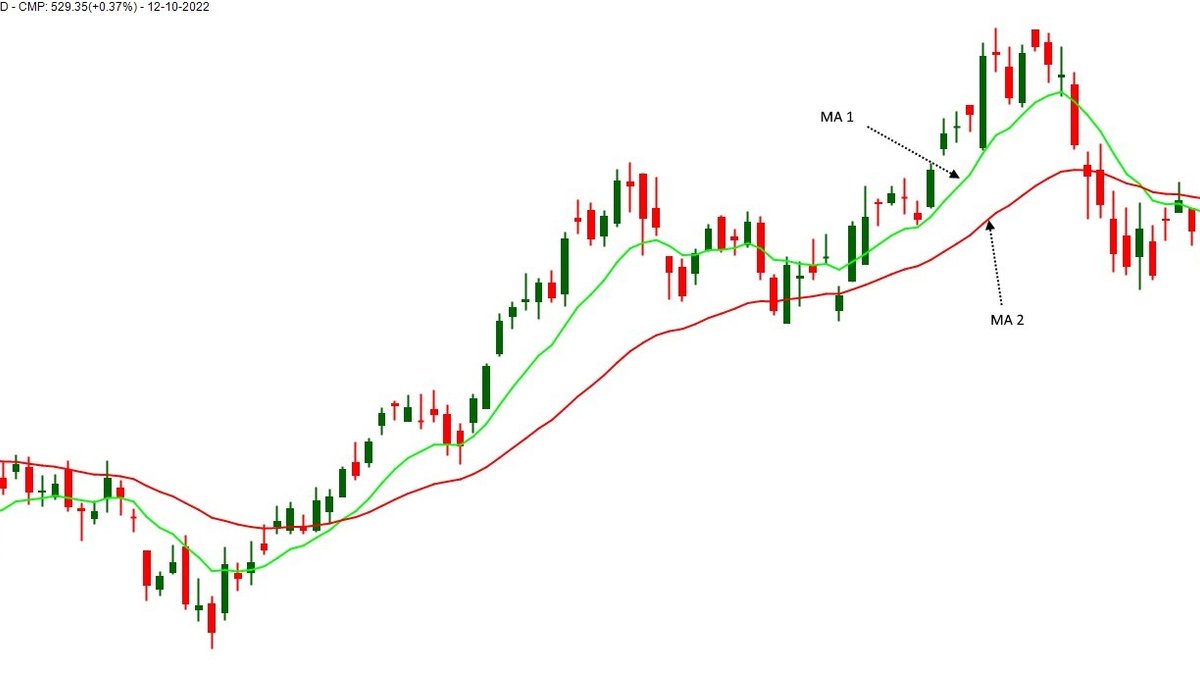
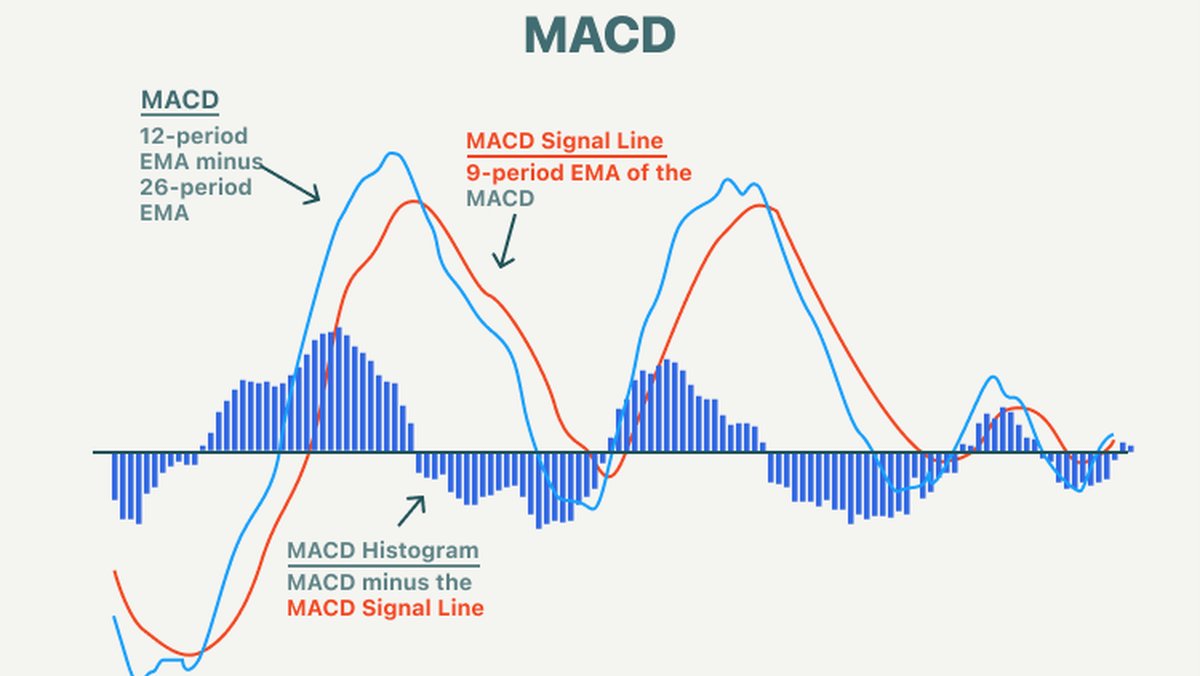
• Momentum indicators: Tools such as RSI, MACD or the Stochastic Oscillator can provide additional context about whether a move into a Fibonacci area is still strong or appears to be losing energy.
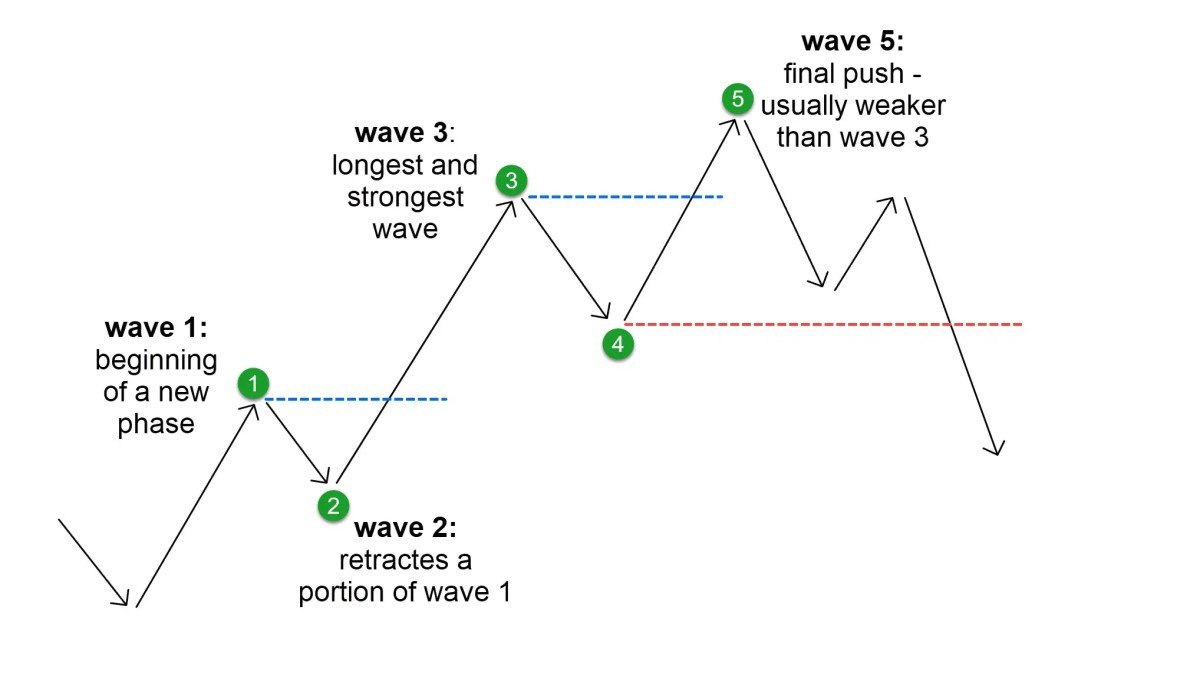
• Elliott Wave frameworks: Some analysts use Fibonacci ratios to estimate the length of waves within Elliott structures, such as the depth of wave 2 retracements or the possible extent of wave 3 or wave C moves.
In all these cases, Fibonacci levels act as reference points that can be weighed alongside multiple lines of evidence instead of being used in isolation.
8. Common Pitfalls When Using Fibonacci Tools
Because Fibonacci levels appear clean and precise on a chart, it is easy to assign more certainty to them than they deserve. A few recurring pitfalls are worth noting:
• Seeing patterns everywhere: With many possible ratios and timeframes, it is always possible to find a level that appears to “fit” a move after the fact. Staying honest about which levels were identified in advance and which are retrospective is important.
• Overloading charts: Stacking too many Fibonacci sets—on multiple swings and timeframes—can quickly clutter a chart, making it hard to see what really matters.
• Ignoring risk management: Fibonacci tools do not replace the need for position sizing, diversification and clear exit plans aligned with personal circumstances.
• Forgetting market context: In highly trending or news-driven environments, price may move through levels that would normally attract interest, simply because larger forces are at work.
9. A Simple Learning Plan for Fibonacci in Practice
For readers who want to build practical familiarity with Fibonacci tools, the following exercise can be helpful:
1. Select a liquid market and open a daily chart spanning at least one year.
2. Identify a clear upward or downward swing and draw Fibonacci retracement levels between its low and high (or high and low). Note how price behaved during subsequent pullbacks.
3. Repeat the process on a different swing and on another timeframe, such as the 4-hour chart, to see how behaviour changes.
4. Add Fibonacci extensions after a simple three-leg move (swing, retracement, continuation) and observe how price responded near projected zones.
5. Record your observations in a journal—where levels appeared helpful, where they did not and which combinations with other tools gave the clearest context.
Over time, this kind of review helps turn Fibonacci concepts from abstract ratios into practical reference points.
10. Key Takeaways
• The Fibonacci sequence and the associated golden ratio give rise to percentage levels that many chart users monitor when analysing trends and corrections.
• Fibonacci retracement focuses on pullbacks within an existing move, highlighting potential support or resistance zones at levels such as 38.2%, 50% and 61.8%.
• Fibonacci extension projects possible continuation areas beyond recent highs or lows, using ratios like 100%, 127.2% and 161.8% of a prior swing.
• These tools provide areas of interest, not guarantees. Swing selection, market context and confluence with other factors all influence how useful a given level may be.
• Fibonacci analysis is most effective when integrated into a broader, risk-aware framework that includes market structure, momentum, volume and attention to personal objectives.
This article is intended solely for informational and educational purposes. It does not constitute financial, investment, tax or legal advice and should not be treated as a recommendation to buy, sell or hold any asset or to use any specific method. Markets involve risk, including the possibility of loss. Always consider your own circumstances and, where appropriate, consult qualified professionals before making financial decisions.