Technical Analysis Guides – Part 13: Support and Resistance – Reading the Market’s Key Decision Zones
Open any chart and you will see areas where price hesitated, reversed or moved sideways before choosing a direction. These zones are what technicians call support and resistance. They are not secret formulas; they are simply the places where buyers and sellers previously disagreed most strongly about value.
Understanding these levels can help you frame better questions: Where did demand step in last time? Where did supply become dominant? How far am I from a zone where behaviour might change again?
This article is for educational purposes only. It does not provide financial, investment, tax or legal advice, and it does not recommend buying or selling any specific asset.
1. What Are Support and Resistance?
1.1 Support – Where Demand Has Stepped In Before
Support is a price area below the current market where buying interest has been strong enough, in the past, to stop further declines and push price higher again.
- On a chart, support often appears as a zone where multiple declines have stalled or reversed.
- It reflects the idea that at certain levels, participants view the asset as relatively attractive and are more willing to accumulate.
Support does not mean price must bounce. It simply marks an area where demand was significant before and might become important again.
1.2 Resistance – Where Supply Has Overpowered Demand
Resistance is a price area above the current market where selling interest has previously outweighed buying interest, stopping further advances and leading to pullbacks.
- On a chart, resistance often shows up where rallies repeatedly stall or consolidate.
- It reflects zones where participants become more cautious about paying higher prices or choose to reduce exposure.
Just like support, resistance is not an unbreakable ceiling. When demand becomes strong enough, these zones can eventually be exceeded.
1.3 Think in Zones, Not Exact Numbers
One of the biggest shifts for newcomers is realising that support and resistance are areas, not single exact prices. Markets are messy:
- Price can push slightly beyond a level, trigger orders and then reverse.
- Different exchanges or brokers may show slightly different highs and lows.
- Larger participants often transact across a range, not at a single tick.
In practice, most analysts draw bands or zones rather than razor-thin lines. This mindset reduces frustration and helps avoid overreacting to small intraday moves.
2. Main Types of Support and Resistance
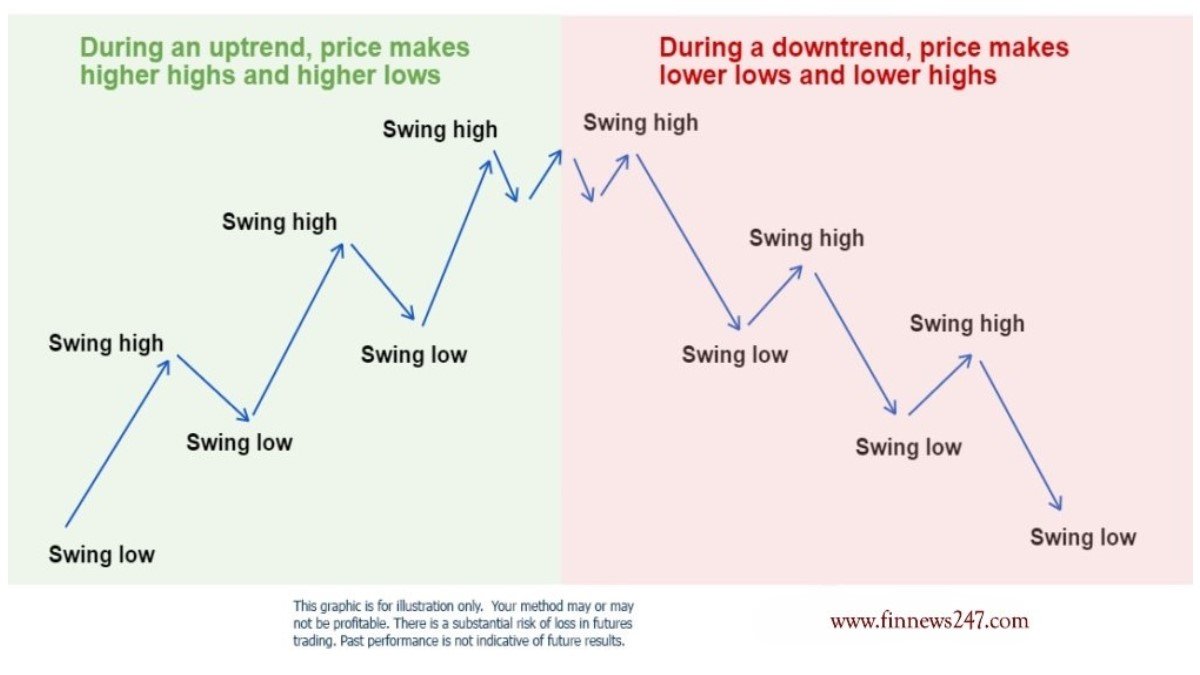
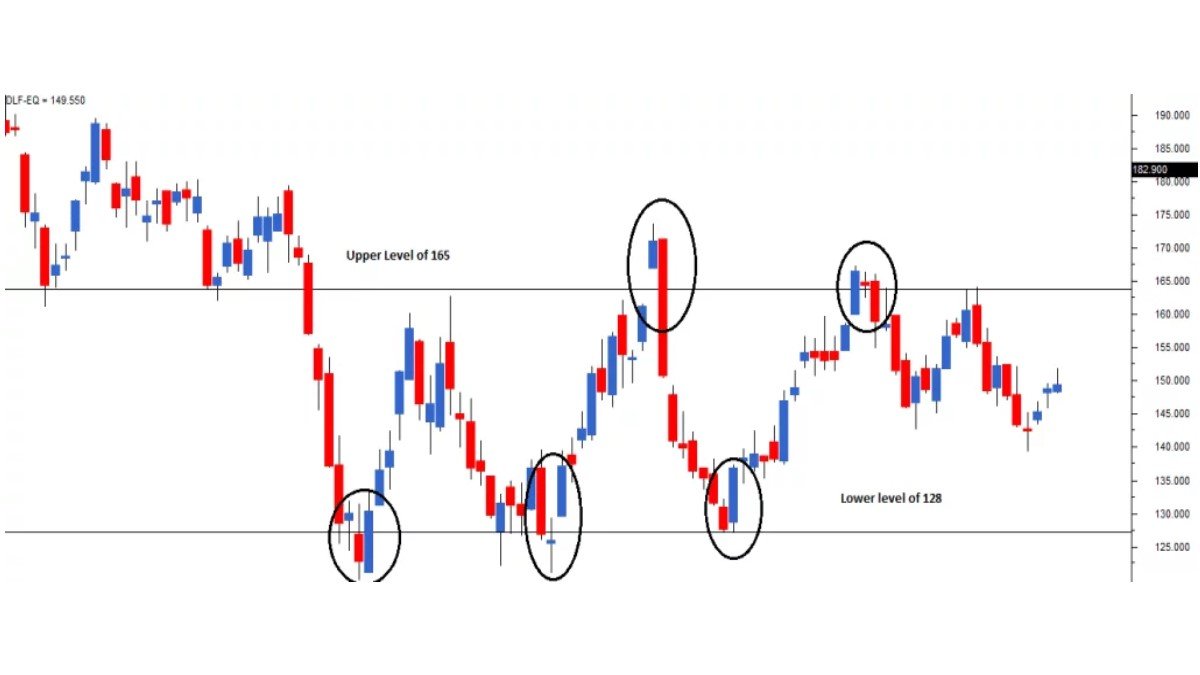
2.1 Horizontal Levels from Swing Highs and Lows
The most common way to identify support and resistance is to look for repeated turning points at similar prices:
- A horizontal resistance zone forms where several highs cluster in a similar region.
- A horizontal support zone forms where several lows cluster or where a strong reaction started.
These levels are easy to see and widely followed, which can itself reinforce their relevance, as many participants watch the same zones.
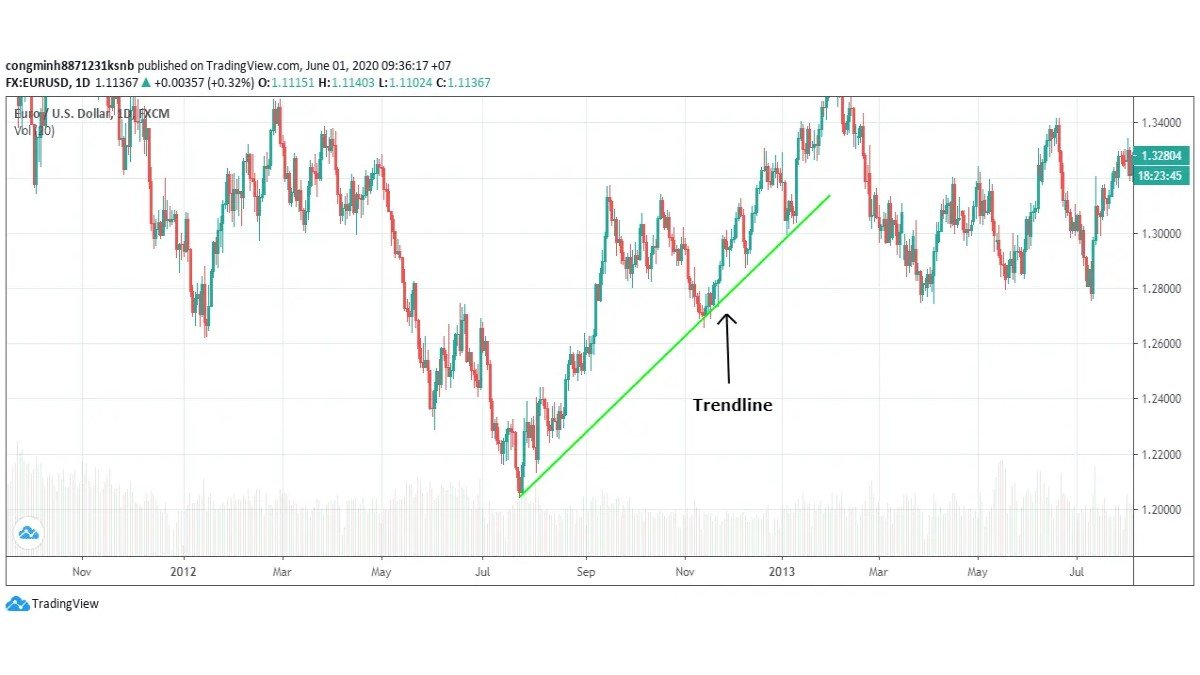
2.2 Trendline-Based Support and Resistance
When price is making a sequence of higher lows or lower highs, diagonal support and resistance lines—trendlines—become important:
- In an uptrend, a trendline drawn beneath rising lows can act as dynamic support.
- In a downtrend, a trendline drawn above falling highs can act as dynamic resistance.
These lines help visualise the direction and slope of a move. They are still approximations: the goal is to capture the overall path of price, not to intersect every extreme perfectly.
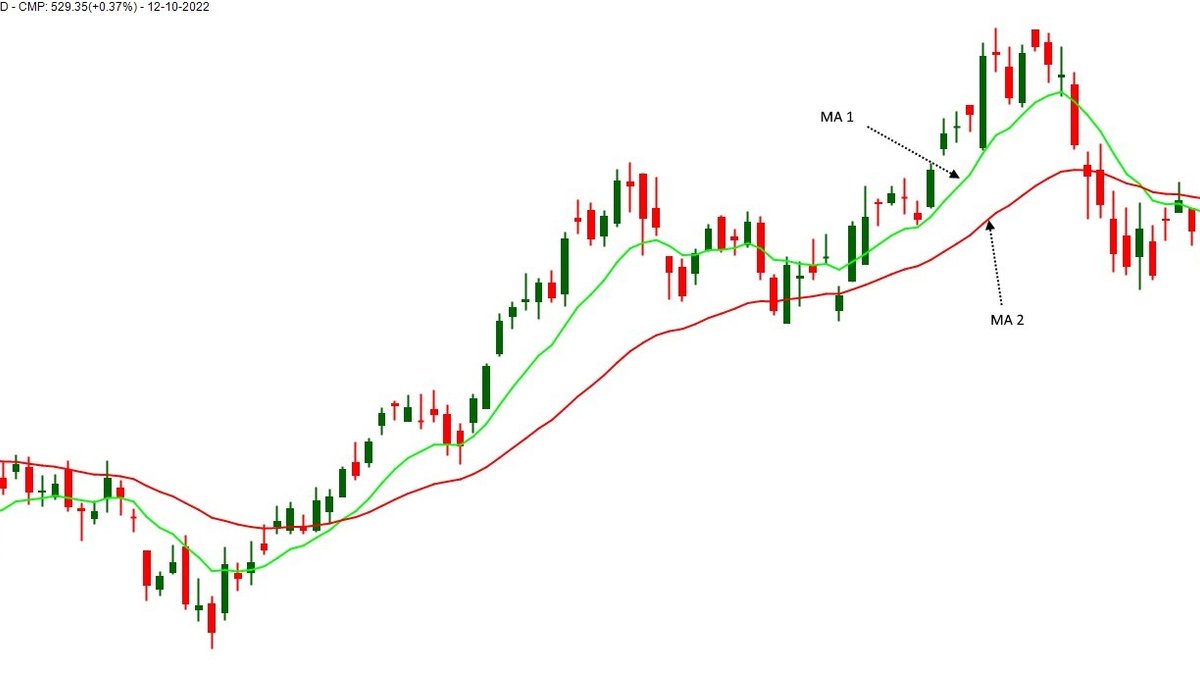
2.3 Moving Averages as Dynamic Zones
Many traders treat widely watched moving averages—for example, the 50-day or 200-day moving average—as dynamic support or resistance:
- In a strong uptrend, pullbacks often pause near a rising moving average.
- In a downtrend, rallies can struggle near a falling moving average.
These levels work not because of a hidden formula, but because a large number of market users observe them and may adjust activity when price interacts with them.
2.4 Psychological Levels and Round Numbers
Round numbers—like 1.0000 on a currency pair or 50,000 on a crypto asset—often behave as approximate support or resistance. Many participants naturally set orders near these values because they are easy to remember and discuss.
As a result, order flow can cluster in these regions, creating visible reactions on the chart. This effect is particularly strong on highly watched assets and timeframes.
3. How to Draw Support and Resistance Step-by-Step
3.1 Start from Higher Timeframes
A practical workflow is:
- Begin with the weekly or daily chart to mark major zones.
- Then drop to lower timeframes (4-hour, 1-hour) to refine and add secondary levels if needed.
Higher timeframe levels usually carry more weight because they summarise more data and more decisions over time.
3.2 Mark Obvious Swing Points
On the higher timeframe chart, look for:
- Major highs where price turned down sharply.
- Major lows where price turned up decisively.
- Zones where price consolidated before breaking out strongly.
Rather than chasing every minor wiggle, focus on the levels that clearly stand out when you zoom out. If you need to zoom in very far to justify a level, it may not be essential at this stage.
3.3 Use Rectangles, Not Just Lines
Once you have identified potential zones, draw rectangles that cover the main cluster of highs or lows instead of a single horizontal ray. This visually reinforces that you are dealing with an area:
- The top of the rectangle can mark where reactions tended to peak.
- The bottom marks where reactions tended to start.
Within that band, short-term overshoots and intraday spikes are expected rather than surprising.
3.4 Count Touches and Reactions
Not all levels are equal. To judge their relative importance, consider:
- Number of tests: The more times price has reacted to an area, the more participants are likely to monitor it.
- Quality of reaction: Strong, decisive moves away from a level suggest more committed order flow than weak, choppy bounces.
- Time in market: Levels that have existed for months or years often carry more weight than very recent ones.
These observations are not guarantees, but they help you prioritise which levels matter most for your analysis.
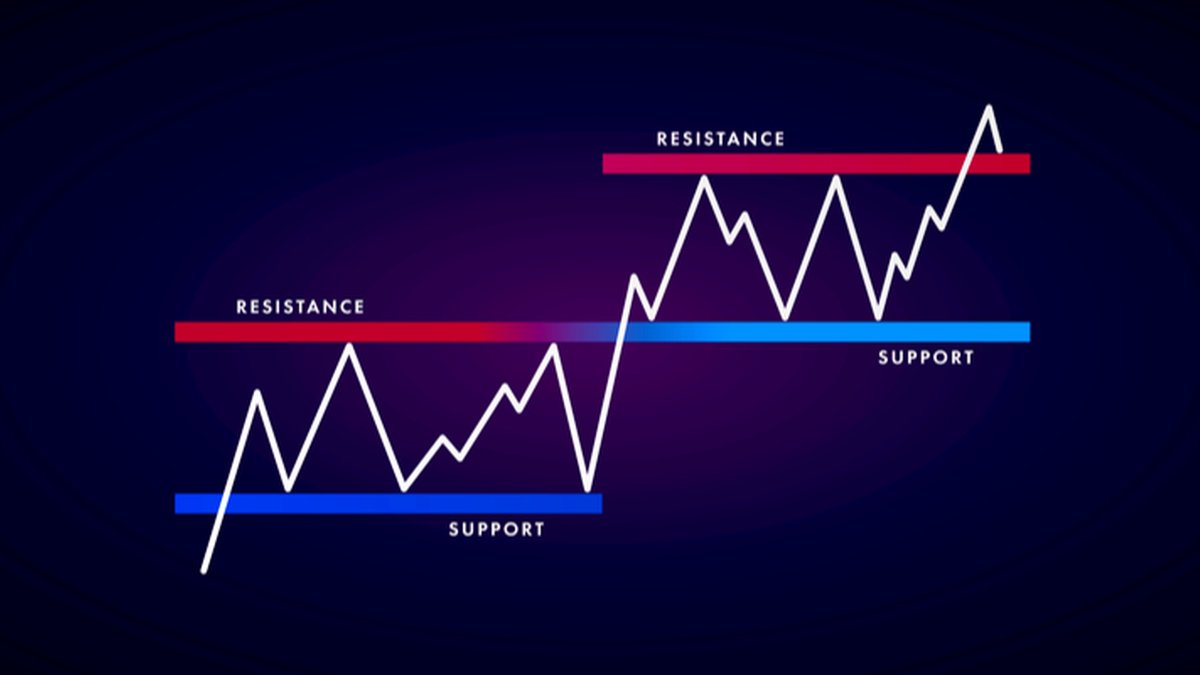
4. Role Reversal: When Support Becomes Resistance (and Vice Versa)
A classic concept in technical analysis is role reversal:
- When a support zone is broken convincingly, it can later act as resistance if price rallies back into it.
- When a resistance zone is surpassed and price holds above it, that area can later act as support on pullbacks.
This behaviour reflects how past decisions influence future ones. Participants who entered near a level and saw price move against them may use a return to that region to reduce exposure, reinforcing its importance.
5. Using Support and Resistance in Practice
Support and resistance are reference points, not automatic instructions. Below are three common ways that traders incorporate them into structured approaches.
5.1 Trading Within Ranges
When price is moving sideways between a clear support zone and a clear resistance zone, some traders treat the structure as a range:
- They monitor support for potential long setups if broader conditions align.
- They monitor resistance for potential profit-taking or short setups, depending on their style and risk tolerance.
Because ranges can break at any time, risk controls—such as defining invalidation levels and keeping positions modest—are essential. For many people, standing aside when conditions are unclear is also a valid choice.
5.2 Trading with the Trend: Pullbacks to Support or Resistance
In a trending market, some traders prefer to act in the direction of the primary move:
- In an uptrend, they watch for price to pull back into a support zone (horizontal level, trendline or moving average area) and then look for signs that demand is returning.
- In a downtrend, they monitor rallies into resistance zones for signs that supply is reasserting itself.
In both cases, levels help define where the idea becomes invalid—for example, if price moves decisively beyond the zone and holds there.
5.3 Breakouts and Retests
Breakouts occur when price moves out of a well-defined range or through a widely watched level:
- Some traders act on the initial move if it is supported by strong volume and broader context.
- Others wait for a retest, where price returns to the broken level from the other side and shows whether it now acts as support or resistance.
Breakouts can fail, leading to quick reversals. Because of this, many practitioners combine breakout ideas with additional filters such as higher timeframe direction and basic risk limits.
6. Volume, Time and Other Factors That Strengthen a Level
Several additional factors can add weight to support and resistance zones:
- Volume: Reactions at levels with unusually high trading activity can indicate that large numbers of participants care about that area.
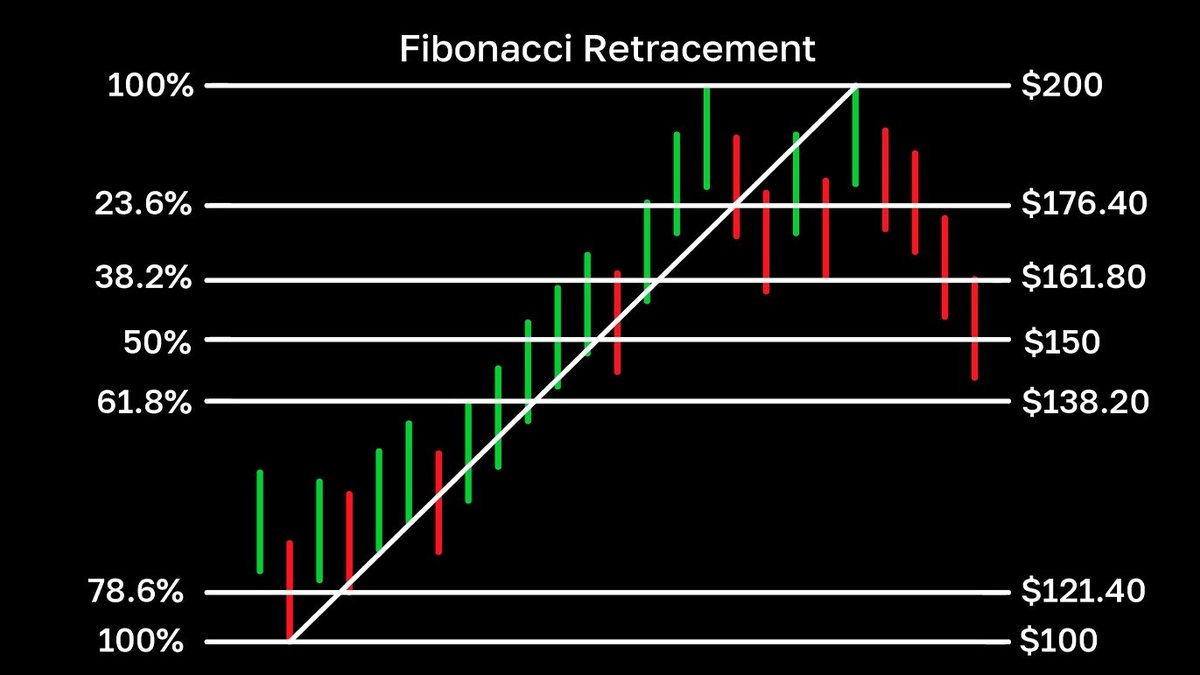
- Confluence: When multiple tools highlight the same zone—for example, a prior swing high, a major moving average and a Fibonacci retracement—analysts pay extra attention.
- Time: The longer a level has been relevant, and the more market cycles it has survived, the more deeply it is embedded in participants’ memory.
Even when all these conditions line up, outcomes are still uncertain. The value lies in having a framework for planning scenarios, not in expecting perfect predictions.
7. Common Mistakes When Working with Support and Resistance
Some recurring difficulties include:
- Treating levels as exact prices: reacting to every small tick beyond a level instead of thinking in zones.
- Ignoring the wider trend: focusing on counter-trend levels without considering the strength or maturity of the primary move.
- Overloading charts: drawing so many lines that the key levels are no longer clear.
- Underestimating false breaks: assuming that every move beyond a level will sustain without considering liquidity, volatility and context.
Most of these issues improve with deliberate practice: reviewing old charts, noting how levels behaved and reflecting on how you would have reacted under your rules.
8. Building a Simple, Brand-Safe Workflow
If you want to incorporate support and resistance into a structured process, you might:
1. Define your timeframe: Decide whether you are mainly interested in daily, 4-hour or another horizon.
2. Mark major zones: On the higher timeframe, highlight the most obvious supports and resistances.
3. Add context: Check the broader trend, volume behaviour and any key events that could affect volatility.
4. Plan scenarios: Consider what you would do if price moves into each zone—whether you would reduce risk, take profits or simply observe.
5. Set boundaries: For any idea that involves taking risk, define in advance where the idea is invalid and how much of your overall capital you are comfortable exposing.
This approach treats support and resistance as decision aids, not as guarantees. The goal is to make actions more deliberate and less emotional, especially in fast-moving markets.
9. Key Takeaways
- Support and resistance are areas where price has previously hesitated or reversed, often due to concentrated buying or selling interest.
- They can be horizontal zones, trendlines, moving-average areas or psychological round numbers.
- Levels work best when viewed in context: alongside trend, volume, timeframe and broader market conditions.
- Trading around these areas involves uncertainty; risk management and position sizing matter as much as the level itself.
- For learners, the most valuable practice is to mark levels consistently, review how price behaved around them and refine rules over time.
This guide is intended solely for information and education. It does not constitute financial, investment, tax or legal advice, nor does it recommend any particular asset, platform or strategy. All markets involve risk, including the possibility of losing some or all of the capital used. Always conduct your own research and consider consulting a qualified professional before making financial decisions.