Technical Analysis Guides – Part 11: Moving Averages Explained
Open almost any price chart and you will see one or more lines gliding across the candles. In many cases, those lines are moving averages—one of the most common tools in technical analysis, used by everyone from long-term investors to short-term traders.
Moving averages do not try to predict the future by themselves. Instead, they summarise what price has already done over a chosen period, smoothing out noise so you can more easily see the underlying direction of the market.
Nothing in this article is financial, investment, tax or legal advice. It is for educational purposes only.
1. What Is a Moving Average?
A moving average (MA) is a line on a chart that shows the average price of an asset over a specific number of periods. As new data comes in, the average 'moves' forward—hence the name.
For example:
- A 10-day moving average on a daily chart shows the average closing price of the last 10 days, updated each new day.
- A 50-period moving average on a 1-hour chart shows the average of the last 50 hours of trading.
The main goals of using MAs are to:
- Highlight the direction of the current trend.
- Smooth out random price spikes and drops.
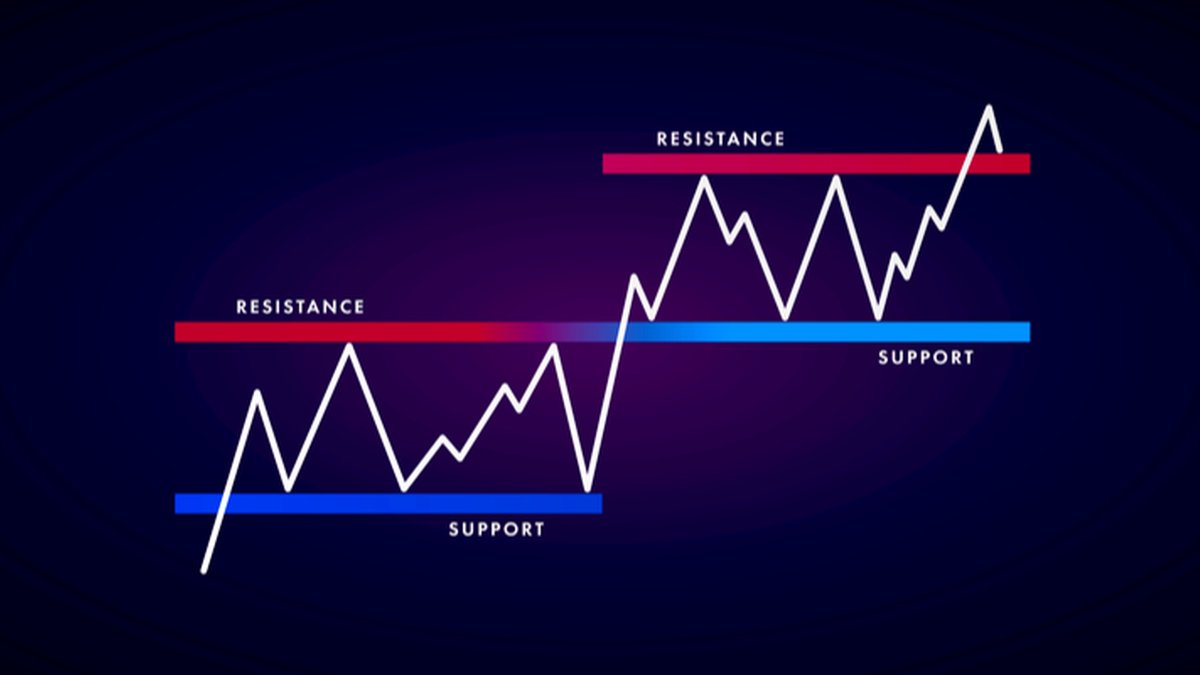
- Create a framework for thinking about potential support and resistance zones.
Most modern charting platforms calculate and plot moving averages automatically, so you do not need to compute them by hand. What matters is understanding what each line represents and how to interpret it in context.
2. Two Core Types: SMA and EMA
While there are several variations of moving averages, two forms are especially common:
- Simple Moving Average (SMA)
- Exponential Moving Average (EMA)
2.1 Simple Moving Average (SMA)
The SMA is conceptually the simplest. It is just the arithmetic mean of closing prices over a chosen period.
For an N-period SMA:
SMA = (Sum of closing prices over N periods) / N
Each new period, the oldest data point drops out of the calculation and the latest one is added.
Characteristics of SMA:
- Smoother, because every observation in the window has equal weight.
- Responds more slowly to sudden price changes.
- Often preferred for higher timeframes (daily, weekly) and for those who want a more stable view of trend.
2.2 Exponential Moving Average (EMA)
The EMA also averages past prices, but it assigns more weight to recent data and less weight to older prices. This is done through a multiplier that gradually decays over time.
You do not need to memorise the formula to use EMAs effectively. The important point is their behaviour:
- They react faster to recent price movements than SMAs.
- They can highlight short-term shifts more quickly, which some active traders prefer.
- They may also pick up more noise, particularly on lower timeframes or in choppy markets.
2.3 SMA vs EMA: Strengths and Trade-Offs
Both SMA and EMA are useful. The choice between them depends on your objectives and timeframe:
- SMA – smoother, slower, more conservative
Good for reducing short-term noise and focusing on broader swings. The downside is that it may react later around turning points. - EMA – faster, more responsive, more sensitive
Helpful for those who want to see changes quickly, particularly intraday. The trade-off is that more rapid changes can mean more false starts in volatile conditions.
There is no universally 'better' choice. It is common for analysts to experiment with both and settle on the one that aligns with their style.
3. Choosing Timeframes: Short, Medium and Long
A moving average is defined not just by type (SMA or EMA) but also by the number of periods included in the calculation. Different lengths highlight different aspects of price behaviour.
A simple way to think about it:
- Short-term MAs: roughly 5–25 periods
- Medium-term MAs: roughly 26–100 periods
- Long-term MAs: roughly 100–200 periods (or more)
Shorter MAs stick closely to price and are more sensitive. Longer MAs lag more but can summarise the bigger picture more clearly.
Common examples on daily charts include:
- 10- or 20-day MA: short-term behaviour.
- 50-day MA: medium-term trend reference.
- 100- or 200-day MA: long-term trend backdrop watched by many participants.
On intraday charts (for example, 15-minute or 1-hour), similar logic applies: a 20-period MA may highlight recent swings, while a 100-period MA can show a broader intraday trend.
4. Using Moving Averages to Read Trend
The most common use of moving averages is simply to understand whether the market has been trending up, trending down or drifting sideways.
- When price spends most of its time above a rising MA, it usually reflects an upward bias.
- When price stays below a falling MA, it usually reflects a downward bias.
- When price frequently crosses back and forth through a relatively flat MA, conditions are more range-bound.
A basic framework might be:
- Use a longer-term MA (for example, 100 or 200 periods) to define the overall backdrop.
- Use a shorter-term MA (for example, 20 or 50 periods) to observe shorter swings within that backdrop.
Moving averages do not remove uncertainty, but they can help you avoid fighting obvious trends by constantly trading in the opposite direction.
5. Moving Averages as Dynamic Support and Resistance
Another popular concept is treating certain moving averages as dynamic support or resistance zones:
- In an uptrend, some participants watch how price reacts when it pulls back to a widely followed MA (such as the 50-day or 200-day). If price frequently stabilises near that line, the area can be considered a support region.
- In a downtrend, the same logic applies in reverse: rallies that stall near a declining MA may be seen as encountering resistance.
It is important to treat these as zones, not exact levels. Price can overshoot temporarily before returning, or it can move further without reacting. Combining MA observations with price structure, volume and other tools usually gives a more balanced view.
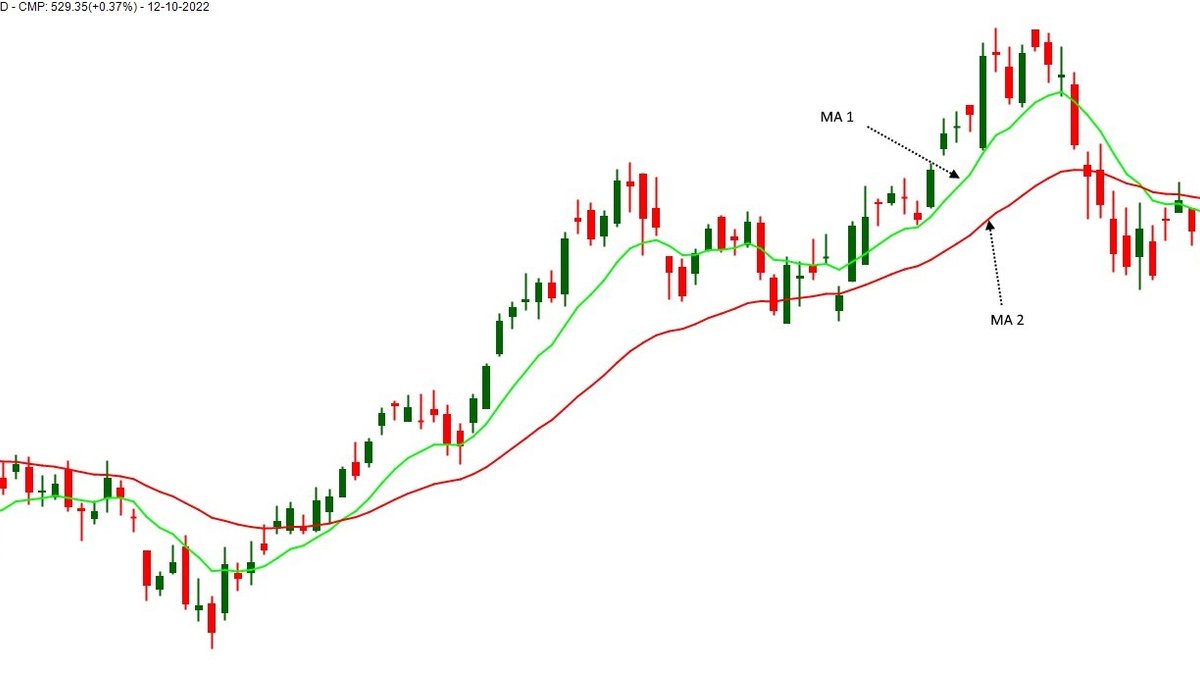
6. Multiple MAs and Crossovers
Many chart users plot two or more moving averages at the same time to see how they interact.
A typical example on a daily chart:
- A faster MA (for example, 20-day EMA)
- A slower MA (for example, 50-day or 100-day SMA)
From there, they look at relationships such as:
- Relative position: If the fast MA is above the slow MA and both are rising, momentum has recently favoured the upside. If the fast MA is below the slow MA and both are falling, the opposite is true.
- Crossovers: When a fast MA moves from below to above a slow MA, it suggests that recent prices have strengthened relative to the longer-term average. The opposite crossover suggests momentum has softened.
Crossovers can be interesting but are not guarantees. In choppy markets, they can occur frequently without leading to sustained moves. That is why many practitioners use them as part of a checklist rather than as a primary decision trigger.
7. Combining Moving Averages With Other Tools
Moving averages are often one layer in a broader toolkit, not the whole framework. Common combinations include:
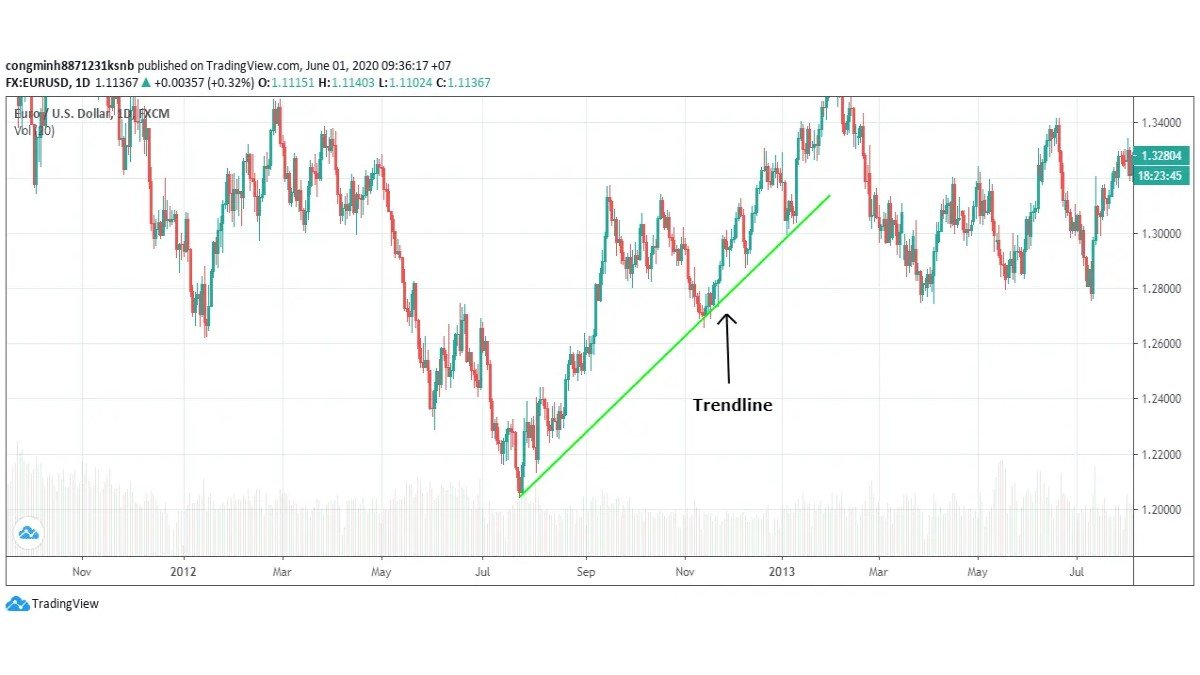
- Price structure: Using MAs together with swing highs and lows to identify where the trend is clearly intact versus where it may be weakening.
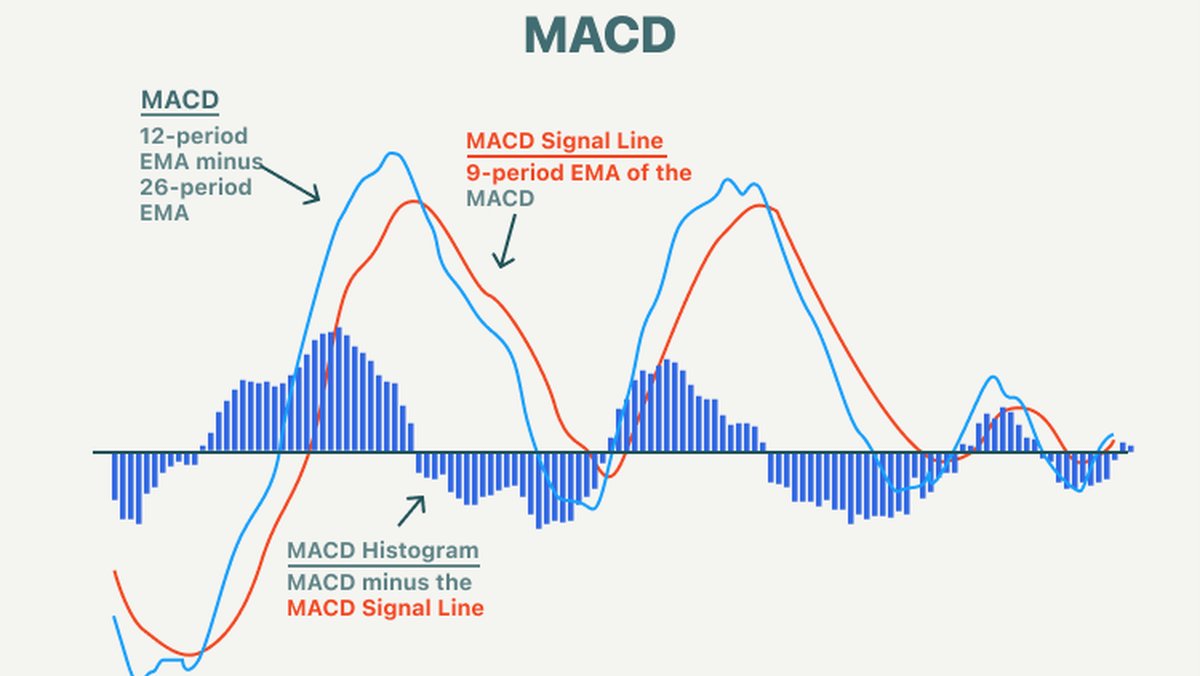
- Momentum indicators: Tools such as RSI, MACD or Stochastic Oscillator can complement MAs by describing the strength of recent moves.
- Volatility bands: Envelopes like Bollinger Bands apply volatility concepts around a moving average, highlighting when price has stretched unusually far from its recent mean.
- Volume: Observing whether volume expands when price interacts with key MAs can offer additional context.
The key idea is confluence: when several independent tools suggest similar conclusions, the analysis may be more robust than when you rely on a single indicator.
8. Common Pitfalls and Limitations
Because moving averages look clean on a chart, it is easy to overestimate what they can do. Some limitations to keep in mind:
• They are inherently lagging. MAs summarise past prices. They will always react after a move has begun, not before.
• Whipsaws in ranging markets. When price moves sideways, it may cross repeatedly above and below moving averages, creating many changes with limited informational value.
• Over-optimisation. It is tempting to test dozens of MA settings until you find ones that would have worked best historically. That does not guarantee similar behaviour in the future and can create unrealistic expectations.
• False sense of precision. A moving average is a statistical approximation, not a precise boundary. Treating it as a hard line that must always hold can be misleading.
Recognising these limits is part of using the tool responsibly. MAs can support a structured approach, but they should not replace risk management or broader research.
9. A Simple Practice Plan With Moving Averages
For readers who want to build practical confidence with moving averages, the following exercise can be helpful:
- Pick a liquid asset and a timeframe.
For example, a major cryptocurrency or index on the daily chart. - Plot one longer-term MA and one shorter-term MA.
For instance, a 20-period EMA and a 100-period SMA. - Scroll back in time and observe.
Note how price behaved relative to these lines during clear trends, pullbacks and ranges. - Mark significant reactions.
Highlight where price approached the MAs and either continued, paused or reversed. - Record observations.
Use a simple journal to document which types of interactions seemed most meaningful and where the MAs were less helpful.
Repeating this process on different assets and timeframes can deepen your sense of how moving averages behave in real conditions rather than in idealised examples.
10. Key Takeaways
• A moving average smooths past price data over a chosen period to highlight trend direction and reduce noise.
• SMA gives equal weight to each data point in its window, while EMA weights recent prices more heavily.
• Short-, medium- and long-term MAs each reveal different aspects of market behaviour; no single setting is optimal in all environments.
• MAs can act as dynamic reference zones for trend and for potential support or resistance, especially when many market participants watch the same levels.
• Because moving averages lag and can whipsaw in ranging markets, they are best used alongside other tools and within a careful risk-management framework.
This guide is intended solely for informational and educational purposes. It does not constitute financial, investment, tax or legal advice and should not be treated as a recommendation to buy, sell or hold any asset or to follow any specific approach. Digital assets and other financial instruments involve risk, including the possibility of loss. Always consider your own circumstances and, where appropriate, consult qualified professionals before making financial decisions.