Technical Analysis Guides – Part 12: Dow Theory – The Classic Foundation of Trend Analysis
Before charting platforms offered dozens of indicators with a single click, analysts were already trying to answer the same basic questions we ask today: Is this market trending? Where are we in the cycle? Are recent moves part of the main direction, or just a temporary reaction?
Dow Theory is one of the earliest attempts to build a structured answer. Although it was developed more than a century ago for stock indices, many of its ideas still shape modern technical analysis in equities, forex and digital assets.
This article is for educational purposes only. It does not provide financial, investment, tax or legal advice, and it does not recommend any specific asset or trading style.
1. What Is Dow Theory?
Dow Theory is a framework for interpreting market trends and phases based on the work of Charles Dow and later commentators such as William Hamilton and Robert Rhea. It was originally applied to stock indices, but the underlying logic focuses on price, volume and crowd behaviour, which makes it adaptable to many liquid markets today.
The theory does not promise exact tops or bottoms. Instead, it offers a way to think about:
- How major trends form and evolve.
- How shorter-term moves fit into a bigger picture.
- How volume and index confirmation can support or question a trend.
Many modern concepts such as trendlines, support and resistance, and even some pattern ideas are easier to understand if you start from Dow Theory.
2. Core Principles of Dow Theory
Different authors summarise Dow Theory in slightly different lists, but the core ideas are consistent. Below is a modernised version of six key principles that are helpful for technical analysts.
2.1 Price Discounts Available Information
Dow Theory assumes that the market quickly reflects the collective view of all known information and expectations. Economic data, earnings, regulatory developments, sentiment and many other factors are expressed through price.
For technicians, this means that carefully studying price behaviour can be a valid way to understand the balance between buyers and sellers without trying to analyse every individual news item.
2.2 Markets Move in Trends
Dow suggested that prices do not move randomly but tend to travel in trends until a meaningful shift in underlying conditions occurs. He described three degrees of trend:
- Primary (major) trend: the main direction, usually lasting many months or years.
- Secondary (intermediate) trend: counter-moves or corrections that run against the primary trend for weeks or months.
- Minor (short-term) trend: smaller fluctuations lasting days to a few weeks, often heavily influenced by short-term noise.
This hierarchy helps analysts avoid overreacting to every minor move. A sharp daily pullback might be alarming on a small chart, but within the context of a multi-month uptrend, it can be a normal secondary reaction.
2.3 Primary Trends Have Recognisable Phases
Within major bull and bear markets, Dow observed recurring psychological phases.
- Bull markets typically move through:
- Accumulation: informed participants gradually buy while the wider public is still pessimistic.
- Public participation: improving data and sentiment attract a broader group of investors, and price advances become more obvious.
- Distribution: optimism is widespread, valuations are rich and more experienced holders quietly reduce exposure to less experienced buyers.
- Bear markets often show:
- Initial distribution: early sellers reduce risk while news still looks acceptable to many observers.
- Public participation on the downside: weaker results and negative headlines spread, and selling pressure broadens.
- Capitulation or despair: confidence is low, forced selling may appear and prices often overshoot to the downside.
These phases reflect human behaviour more than mathematics. They remind us that markets are influenced by emotion, expectations and narrative, not just numbers on a screen.
2.4 Averages Should Confirm One Another
In Dow’s time, analysts compared an industrial index with a transportation index. The idea was that a healthy expansion should show up in both production-focused companies and those moving goods around.
The modern takeaway is broader: a strong trend is more convincing when multiple related instruments or sectors move in the same general direction. For example:
- A crypto market uptrend may be more robust if major coins, key infrastructure tokens and related indices all show aligned strength.
- In equities, a rally limited to a very narrow group of stocks while most sectors lag can be treated with more caution.
2.5 Volume Should Support the Trend
Dow Theory treats volume as a supporting indicator. A primary trend is considered healthier when volume tends to expand in the direction of that trend and to contract during counter-moves.
- In an uptrend, higher volume on rising days and more subdued activity on pullbacks often indicates strong underlying demand.
- In a downtrend, heavier volume on declines than on bounces can confirm that selling pressure is dominant.
Volume does not have to confirm every single day, but over time, it should broadly agree with the direction suggested by price.
2.6 Trends Persist Until Clear Evidence Suggests Otherwise
Another Dow-inspired principle is that a trend remains in force until there is a clear signal that it has reversed. This does not mean trends last forever; it simply discourages constant anticipation of a turning point based on small fluctuations.
In practical terms, analysts look for structural changes such as:
- Breaks of key support or resistance levels that defined the trend.
- Significant shifts in how highs and lows form, for example from higher highs to lower highs.
- Persistent failure of price to make progress in the trend direction despite favourable conditions.
3. The Three Degrees of Trend in More Detail
3.1 Primary (Major) Trend
The primary trend is the overarching direction that dominates the market for months or years. It is the backdrop against which all shorter-term moves take place.
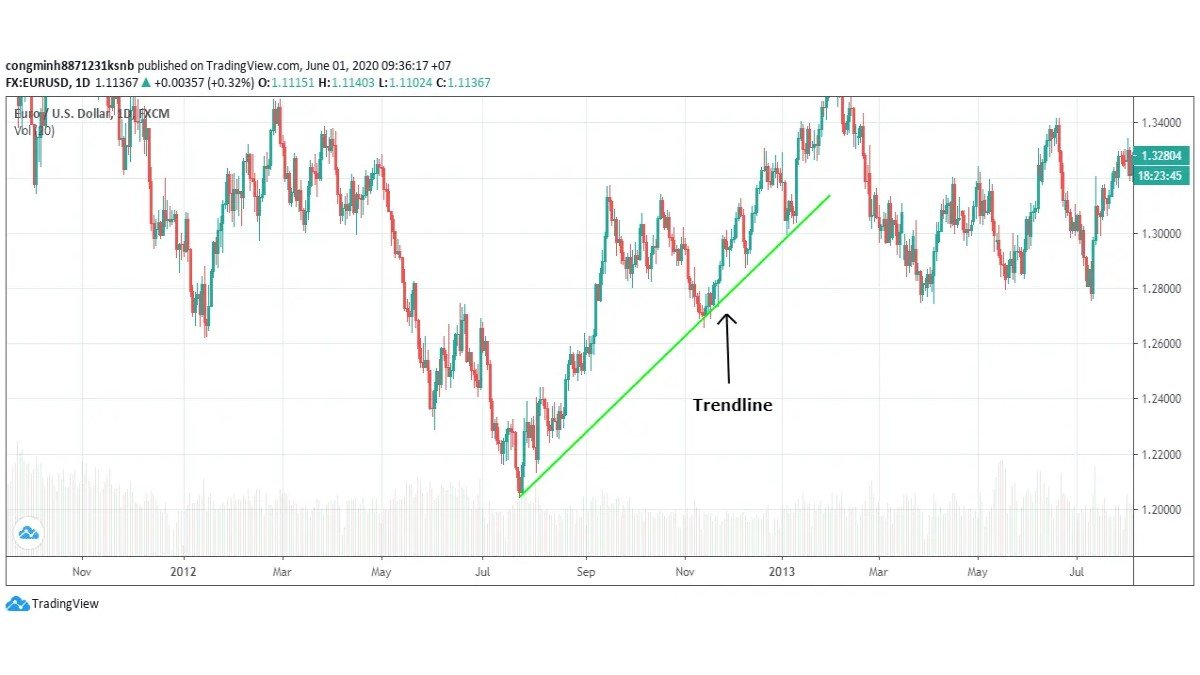
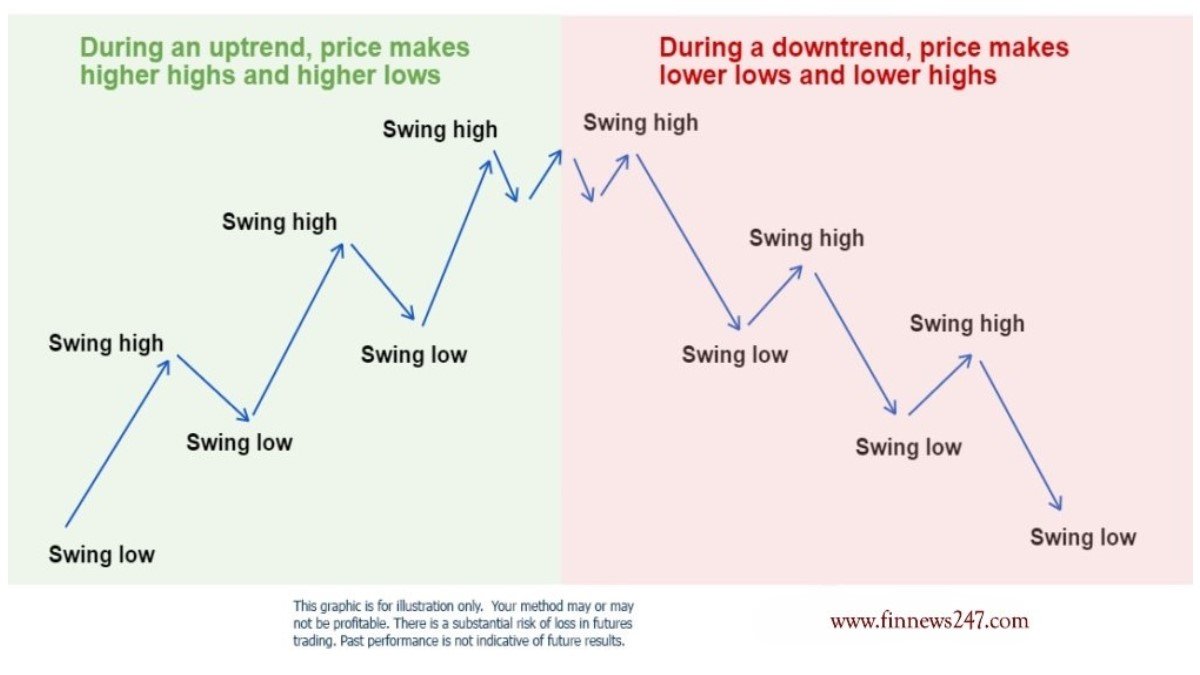
On a chart, a primary uptrend can be seen as a series of major swings that generally produce higher highs and higher lows. A primary downtrend shows the opposite: lower highs and lower lows over an extended period.
For many investors, correctly identifying the primary trend and aligning major decisions with it is more important than capturing every small fluctuation.
3.2 Secondary (Intermediate) Trend
Secondary trends are counter-moves that interrupt the primary trend. They often retrace a portion of the previous major swing and can last from several weeks to a few months.
- In a primary uptrend, a secondary trend may appear as a multi-week correction or consolidation that gives back part of the prior advance.
- In a primary downtrend, a secondary trend may appear as a prolonged relief rally.
These intermediate moves often test the conviction of participants. Distinguishing between a healthy correction within a trend and the early stages of a genuine reversal is one of the ongoing challenges in technical analysis.
3.3 Minor (Short-Term) Trend
Minor trends are short-lived moves that last from a few days to a few weeks. They are heavily influenced by short-term news, intraday flows and local sentiment shifts.
Dow Theory treats these moves as important for short-term traders but less critical for judging the health of the primary trend. For many analysts, minor swings are noise unless they begin to form a consistent pattern that affects the intermediate or major structure.
4. Bull and Bear Market Phases
Dow Theory’s description of bull and bear phases remains relevant because it is rooted in behaviour rather than in a specific asset class.
4.1 Phases of a Bull Market
- Accumulation: After a prolonged decline or sideways period, valuation and sentiment can be low. A relatively small group of patient investors begins slowly building positions while negative headlines still dominate.
- Broader participation: Data and news gradually improve. More investors notice the positive change, and advances become more obvious on the chart. Volume often increases as interest widens.
- Late-stage enthusiasm: Confidence is high and conversations about further upside become common. Price can advance rapidly, but risk often builds beneath the surface as expectations stretch.
4.2 Phases of a Bear Market
- Initial distribution: After an extended advance, some investors begin to lock in gains as warning signs appear. Price may still be near the highs, but underlying breadth or volume can start to weaken.
- Public participation on the downside: Negative news accumulates and more participants decide to reduce exposure. Downward moves can become broader and more sustained.
- Capitulation: Confidence erodes and many market users focus primarily on risk reduction. Selling can become intense, and prices sometimes overshoot fair value to the downside before stabilising.
These descriptions are not precise market-timing tools. Instead, they help frame where the market might be in a cycle and why sentiment looks the way it does at different stages.
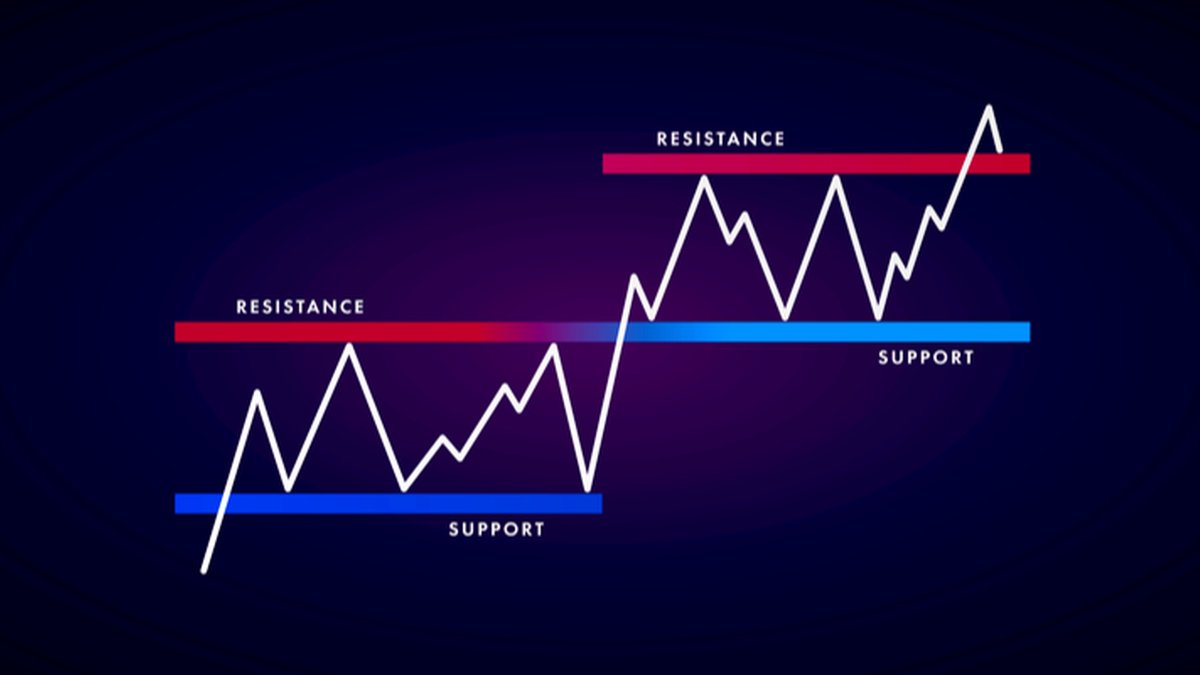
5. Sideways Markets and Trading Ranges
Not all conditions are strongly trending. Dow Theory also recognises periods where price moves mostly sideways within a defined range.
In such phases:
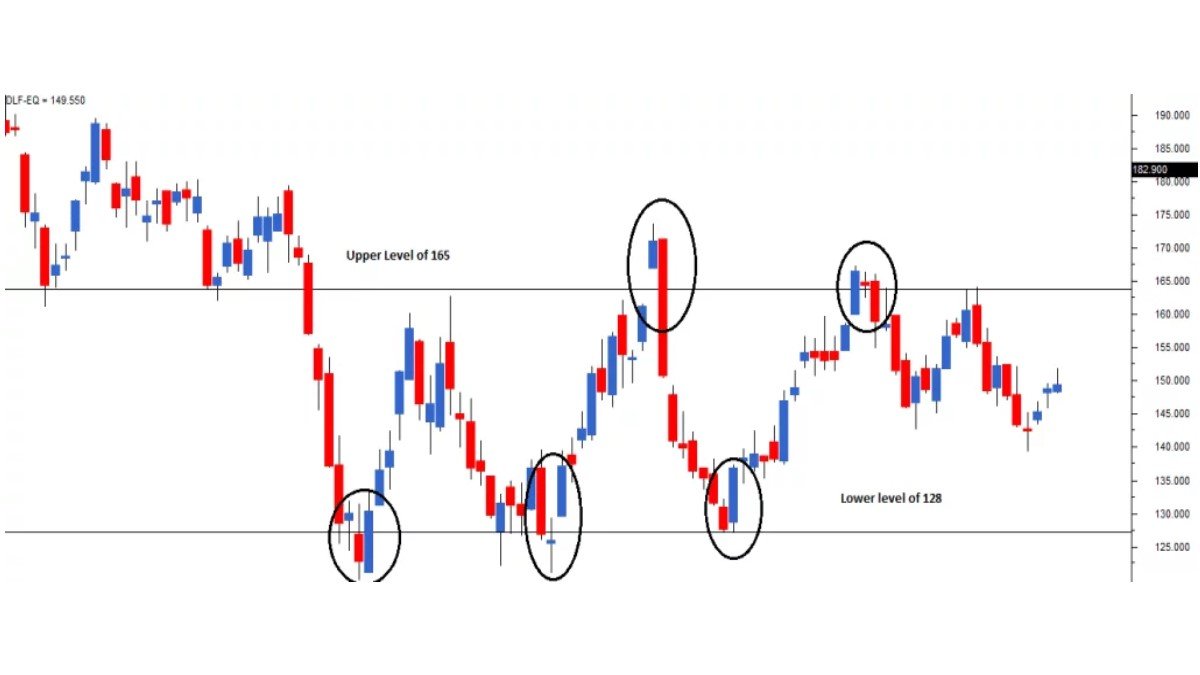
- Support and resistance levels become especially important.
- Volume and volatility can contract as participants wait for clearer direction.
- Breakouts from these ranges, when confirmed, may mark the transition into a new primary or secondary trend.
For many market users, preserving capital and waiting for higher conviction conditions during extended sideways periods can be more productive than constant activity.
6. Dow Theory and Common Chart Structures
A number of familiar patterns and concepts connect naturally to Dow Theory’s focus on trends and phases. For example:
• Double tops and double bottoms: price tests a key level twice and fails to move beyond it, suggesting a possible shift in the balance between demand and supply.
• Triple tops and triple bottoms: extended versions of the above, showing more attempts to break a level before a potential change in direction.
• Trading ranges: prolonged sideways zones where support and resistance contain price, often acting as consolidation within a primary trend or as the structure of an entire secondary phase.
• Flags and similar continuation patterns: shorter-term pauses that occur after strong moves within a primary trend, often leaning in the opposite direction to the main move.
In all of these, the core questions are Dow-like: Is this move aligned with the major trend, or pushing against it? Is this a pause, a distribution, or an accumulation? How does volume behave around key levels?
7. How Modern Analysts Use Dow Theory
Few practitioners today apply Dow Theory exactly as it was written in the early twentieth century. Instead, they integrate its principles into a broader toolkit that might also include:
- Trendlines and channels to visualise swings.
- Momentum indicators such as RSI or MACD.
- Volatility tools like Bollinger Bands.
- On-chain or fundamental data for digital assets, or economic data for traditional markets.
In this context, Dow Theory acts less as a rigid rulebook and more as a philosophy of trend analysis: respect the primary direction, recognise that markets move in phases, and look for confirmation rather than isolated signals.
8. Limitations and Cautions
Despite its historical importance, Dow Theory has several limitations that are important to acknowledge:
- No precise timing: The framework is designed for reading broad trends and phases, not for pinpointing exact entries or exits.
- Subjectivity: Identifying where one phase ends and another begins, or deciding which move qualifies as a primary versus secondary trend, involves judgment.
- Changing market structure: Modern markets include electronic trading, derivatives and many new instruments. While the core behaviour patterns remain relevant, details of implementation may differ from the original context.
Because of these limitations, Dow Theory is best treated as a high-level map. It can guide expectations and help organise information, but it should be accompanied by risk management, scenario planning and independent research.
9. Key Takeaways
• Dow Theory is a foundational framework for thinking about trends, phases and market psychology.
• It emphasises that price reflects a wide set of information, that markets move in trends of different degrees, and that volume and related averages can confirm or question those trends.
• Its descriptions of bull and bear market phases remain helpful for understanding why sentiment feels different at various points in a cycle.
• Many familiar concepts in technical analysis, such as support, resistance and common reversal patterns, can be viewed as practical expressions of Dow-style thinking.
• Dow Theory is not a stand-alone trading system; it is a big-picture lens that works best alongside other tools and careful risk control.
This article is intended solely for informational and educational purposes. It does not constitute financial, investment, tax or legal advice and should not be treated as a recommendation to buy, sell or hold any asset, or to follow any specific strategy. All markets carry risk, including the possibility of loss. Always consider your own circumstances and, where appropriate, consult qualified professionals before making financial decisions.