Technical Analysis Guides – Part 7: Elliott Wave Theory and Market Cycles
Among the many frameworks used in technical analysis, Elliott Wave Theory is one of the most ambitious. Instead of focusing on a single indicator or pattern, it attempts to describe how entire cycles of market behaviour unfold over time. To many analysts, it is less a tool and more a language for talking about crowd psychology as it appears on charts.
In this guide, we will explore what Elliott waves are, how the classic 5–3 structure works, why the theory is described as fractal, and how some market participants apply these concepts alongside other techniques. The focus is educational and brand-safe: we are interested in understanding the framework, not in promising specific outcomes.
Nothing in this article is financial, investment, tax or legal advice. It is for informational and educational purposes only.
1. What Is Elliott Wave Theory?
Elliott Wave Theory starts from a simple observation: markets often advance and decline in recognisable patterns rather than in a completely random fashion. These patterns appear at multiple timeframes—from intraday charts to multi-year cycles—and seem to reflect shifts in collective optimism and pessimism.
At the heart of the theory is a basic cycle consisting of:
- A 5-wave move in the direction of the prevailing trend (called an impulse), followed by
- A 3-wave move against that trend (called a correction).
Together, these eight waves form a complete Elliott cycle. In an uptrend, the 5-wave impulse points upward and the 3-wave correction moves downward; in a downtrend, the roles are reversed.
2. Historical Background and Psychological Foundation
The theory is named after Ralph Nelson Elliott, who studied decades of stock market data in the 1930s. He concluded that price movements often followed repeating wave-like structures, which he linked to human psychology: enthusiasm and fear tend to build and release in cycles.
Later, authors such as Robert Prechter popularised Elliott's work and applied it to a wider range of markets. While not everyone agrees on the predictive power of the theory, many find it useful as a framework for structuring price action into understandable segments.
3. The Basic 5–3 Elliott Wave Structure
The classic Elliott cycle in a rising market can be sketched as follows:
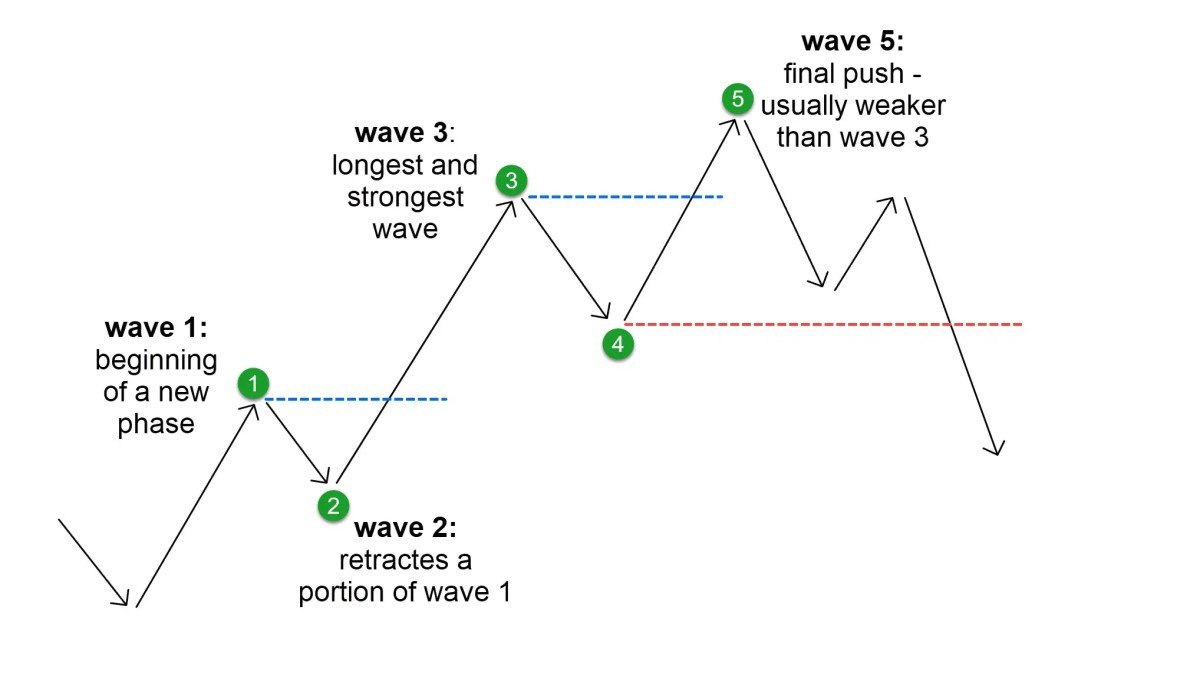
- Impulse waves (1, 2, 3, 4, 5) – Five waves that move in the direction of the main trend.
- Corrective waves (A, B, C) – Three waves that move against the main trend, forming a counter-move.
In an upward cycle:
- Waves 1, 3 and 5 travel upward (with the trend).
- Waves 2 and 4 are pullbacks within that upward phase.
- Waves A and C move downward as part of the correction, while B is a counter-move within the corrective structure.
By the end of the 5–3 sequence, price in this example typically stands higher than where it began, even after the correction. In a downward primary trend, the entire pattern is inverted: the 5-wave impulse moves down, and the 3-wave correction moves up.
4. The Fractal Nature of Elliott Waves
One of the most distinctive claims of Elliott Wave Theory is that waves are fractal. In a mathematical sense, a fractal is a structure that looks similar at different scales. Applied to markets, this means:
- Each impulse wave (for example, wave 1 of a larger pattern) can itself be seen as a smaller 5-wave sequence on a lower timeframe.
- Each corrective wave (for example, wave A of a larger correction) can often be subdivided into smaller waves of its own.
As a result, analysts talk about different wave degrees: from large 'grand cycles' that span many years down to small intraday swings. A wave that looks simple on a weekly chart may reveal a complex internal structure when viewed on an hourly chart.
This fractal property is part of what makes Elliott analysis rich—but it also introduces subjectivity. Two analysts may label the same chart differently, especially in complex corrective phases.
5. Impulse Waves: Rules and Guidelines
An impulse wave is the 5-wave structure that moves in the direction of the larger trend. Elliott proposed several rules that such a wave must follow. If these rules are violated, the pattern is classified as something else (for example, a diagonal or a corrective structure).
The three core rules for a standard impulse are:
- Rule 1 – Wave 2 never retraces 100% of wave 1.
Wave 2 can be deep or shallow, but it should not move beyond the starting point of wave 1. - Rule 2 – Wave 4 never overlaps the price territory of wave 1.
In a typical impulse, the low of wave 4 in an uptrend should remain above the high of wave 1, and vice versa in a downtrend (with some exceptions in special patterns). - Rule 3 – Wave 3 is never the shortest of waves 1, 3 and 5.
In practice, wave 3 is often the longest and most dynamic portion of the impulse, reflecting strong participation in the direction of the main trend.
These rules help analysts decide whether a move can reasonably be labelled as an Elliott impulse or whether a different structure is more appropriate.
6. Corrective Waves: A, B, C and Beyond
After a 5-wave impulse, the market often enters a corrective phase. At the simplest level, this is described as a 3-wave structure labelled A, B and C. However, corrections can take many forms, and they are often more difficult to classify than impulses.
Common corrective templates include:
- Zigzag (5–3–5): a sharp, directional correction where wave A and C are typically impulses and wave B is corrective.
- Flat (3–3–5): a sideways correction in which waves A and B are often similar in length, with wave C extending beyond them.
- Triangle (3–3–3–3–3): a converging pattern of overlapping swings, usually appearing in later stages of a move, such as a wave 4 or wave B.
- Complex corrections: combinations of the above patterns linked together, which can be challenging to label in real time.
Corrections tend to express hesitation, consolidation or rebalancing of sentiment after a strong move. Because their shapes vary widely, many practitioners focus less on naming every variant and more on recognising when the market is in a broadly corrective, overlapping phase versus a clear impulsive phase.
7. A Practical, Educational Workflow for Elliott Analysis
For learners interested in exploring Elliott concepts, a structured, step-by-step workflow can be helpful:
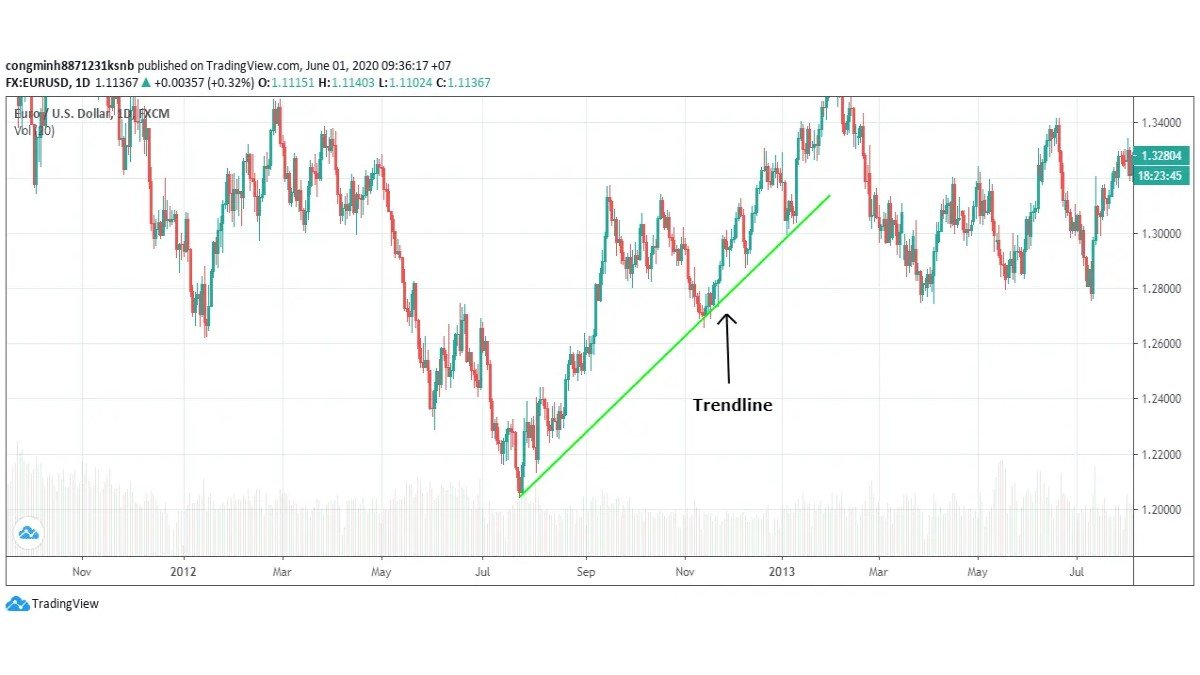
1. Start with a higher timeframe.
Begin on weekly or daily charts to identify the major direction of price over recent months or years. Ask whether the current environment looks impulsive (strong, directional) or corrective (choppy, overlapping).
2. Mark potential 5-wave and 3-wave structures.
Look for sequences that could reasonably be labelled 1–2–3–4–5 followed by A–B–C, keeping the core impulse rules in mind.
3. Drop down one timeframe.
On a lower timeframe (for example, 4-hour or 1-hour), inspect how those waves subdivide. Do large impulse waves break down into smaller 5-wave patterns? Do corrections show overlapping action?
4. Note alternation and proportion.
Elliott suggested that waves of the same degree often show a sense of alternation (for example, a deep wave 2 followed by a shallow wave 4) and rough proportionality. Perfect symmetry is not required, but extreme irregularities may suggest a mislabel.
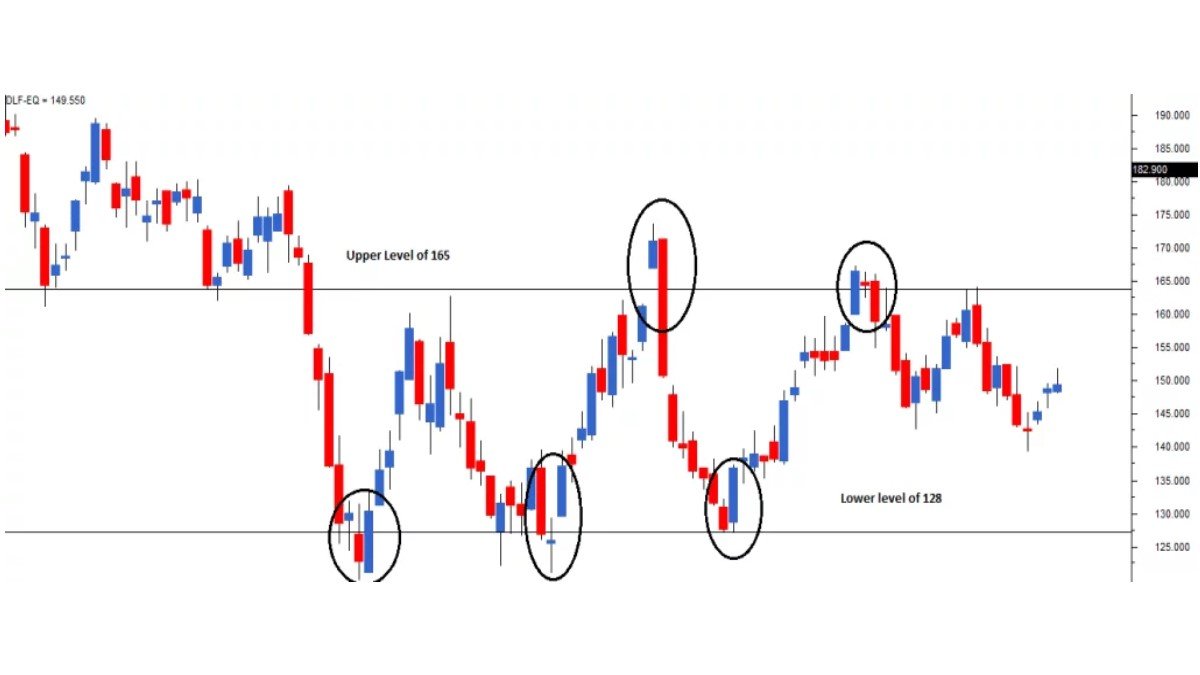
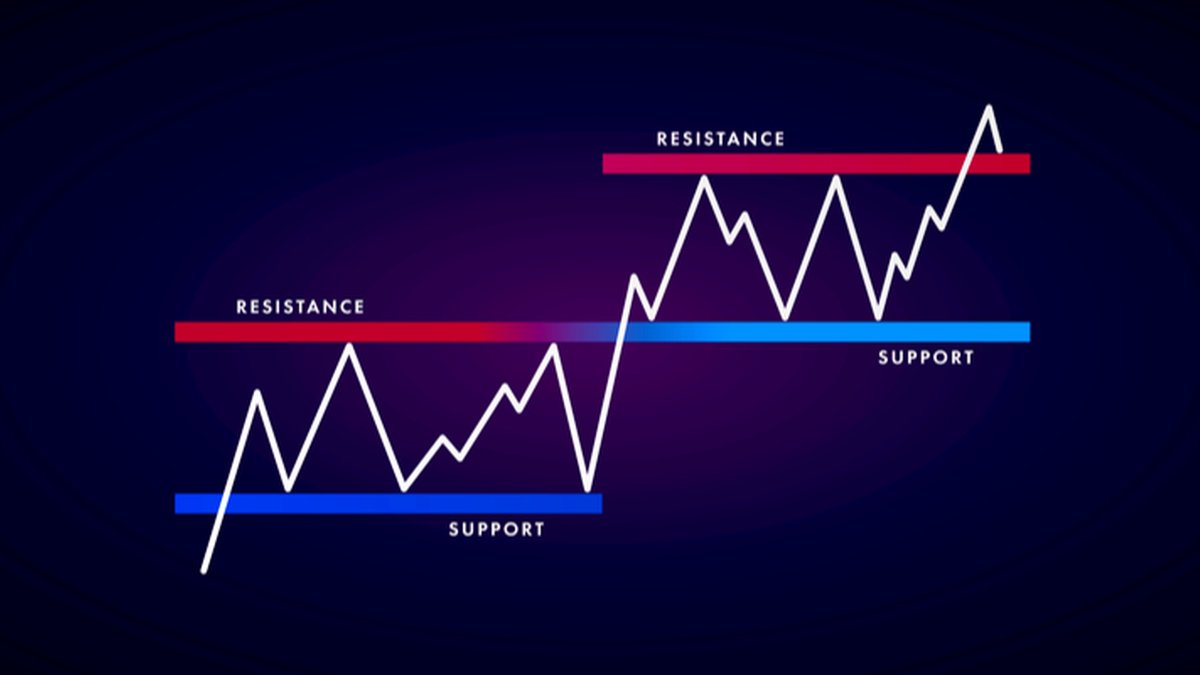
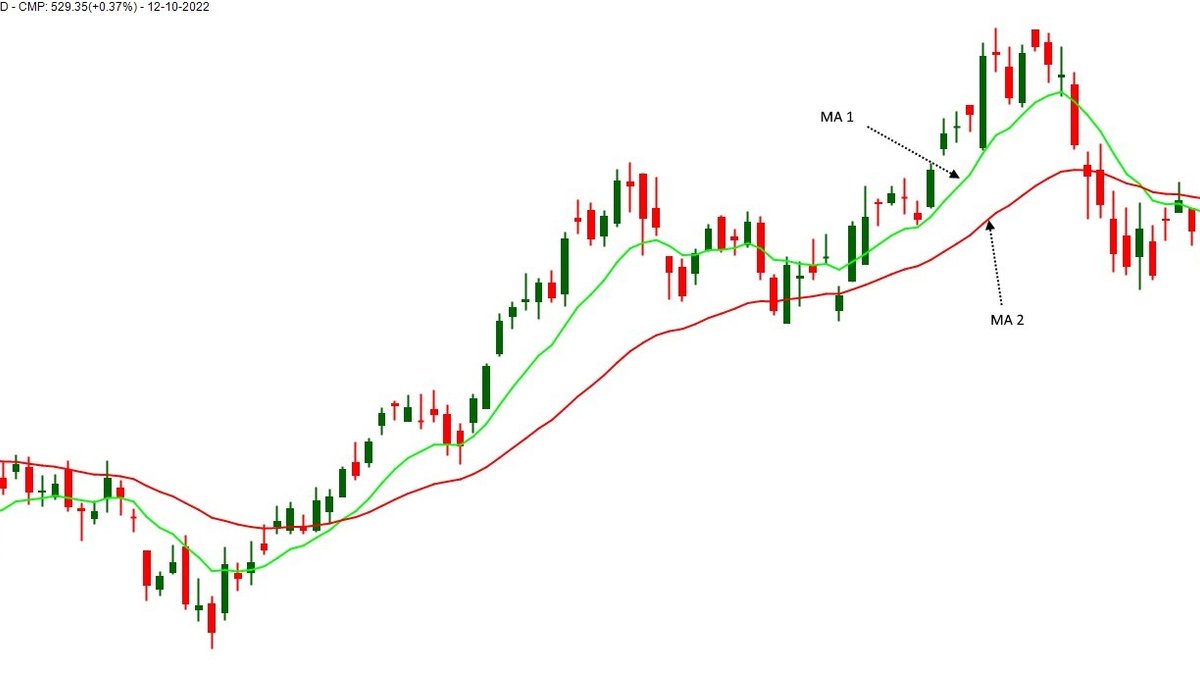
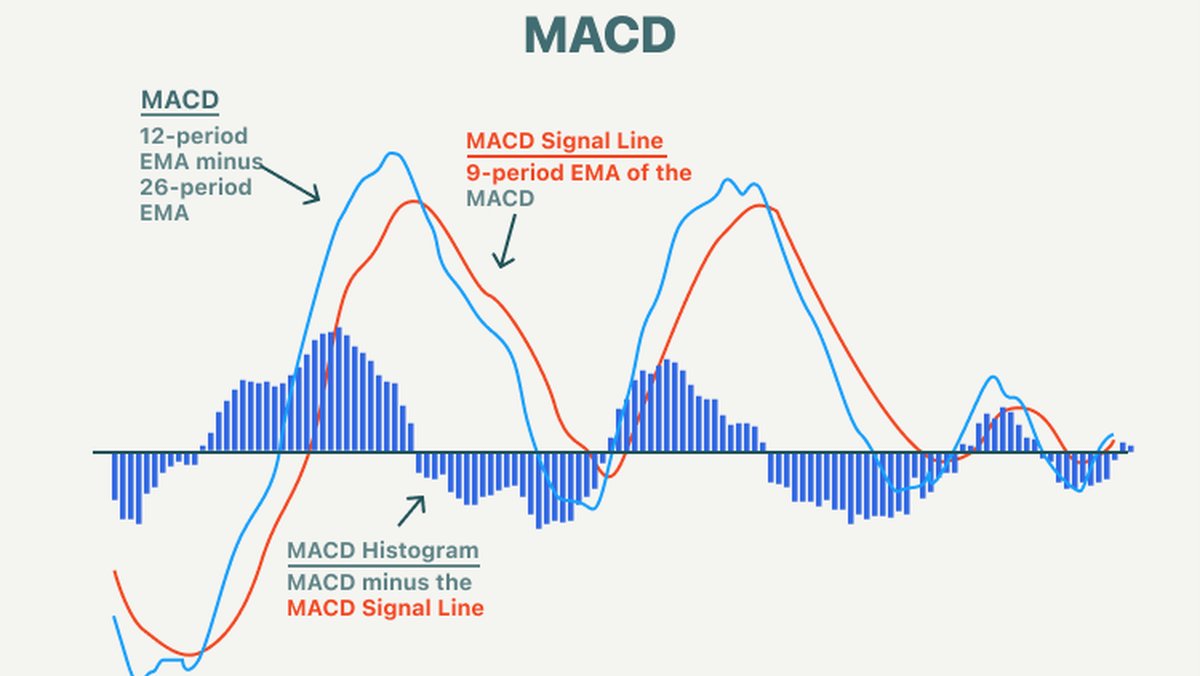
5. Combine with objective tools.
Use support and resistance levels, volume, moving averages or momentum indicators to cross-check your wave counts. If multiple perspectives tell a similar story, the interpretation may be more robust.
This process is not about finding the 'one true' count but about building a structured, testable narrative for what the market has been doing.
8. Elliott Waves and Fibonacci Relationships
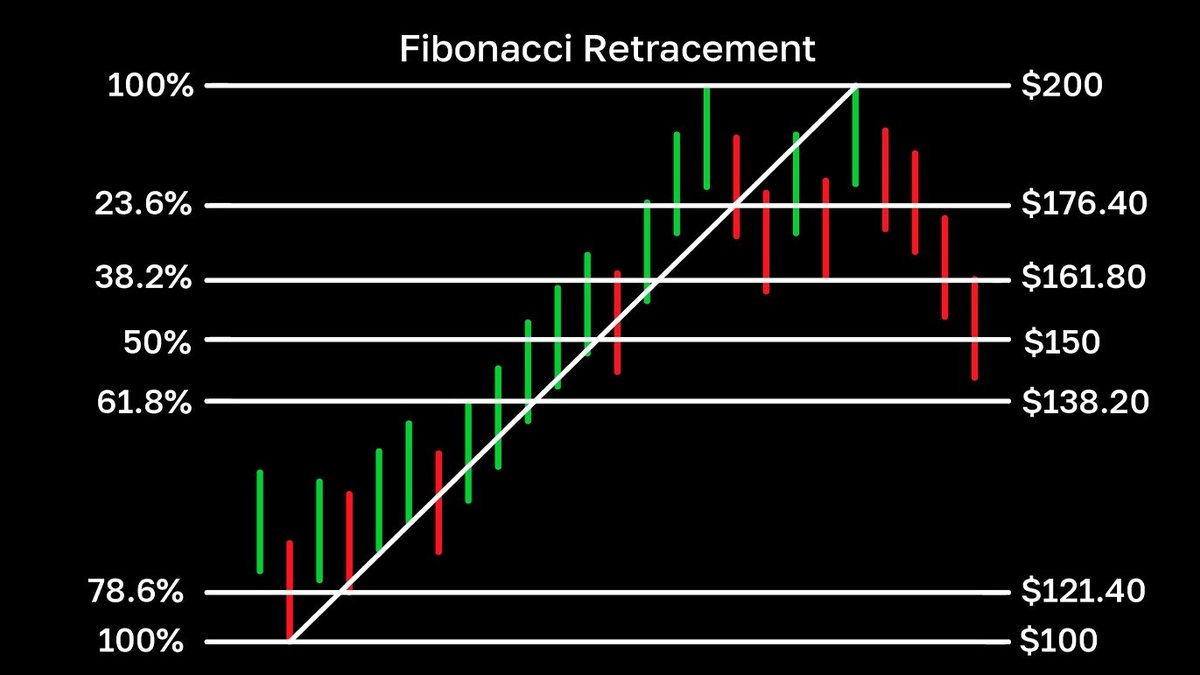
Many analysts combine Elliott Wave concepts with Fibonacci ratios. Fibonacci retracements and extensions are often used to estimate where a wave might reasonably pause or exhaust, based on common proportional relationships observed historically.
Examples include:
- Wave 2 retracing a portion of wave 1, sometimes near Fibonacci levels such as 38.2%, 50% or 61.8% of the prior move.
- Wave 3 extending beyond wave 1 by a Fibonacci multiple, such as 161.8% of the length of wave 1.
- Wave C in a correction reaching a level proportional to wave A.
These relationships are not strict rules and do not guarantee particular outcomes. Instead, they provide reference zones where analysts pay closer attention to price behaviour, especially if other factors (such as volume or prior support/resistance) align.
9. Critiques, Limitations and Common Pitfalls
Elliott Wave Theory is both influential and controversial. Understanding its limitations is essential for anyone exploring it.
• Subjectivity in wave counting: Because waves are identified retrospectively based on shape and proportion, different analysts can produce different counts on the same chart. This subjectivity means the framework is best treated as a guide, not as a mechanical rule set.
• Complexity in real time: While textbook diagrams look clear, live markets are noisy. Corrections in particular can combine multiple patterns, making it hard to know which scenario is unfolding until after the fact.
• Risk of overfitting: With enough creativity, it is possible to fit some kind of wave count to almost any history. This can create a false sense of certainty if not balanced with other evidence.
• Need for risk management: Like any analytical approach, Elliott Wave concepts do not remove the need for position sizing, diversification and clear exit criteria aligned with personal circumstances.
Because of these factors, some practitioners use Elliott ideas primarily to describe scenarios and probabilities instead of treating them as firm predictions.
10. Key Takeaways
• Elliott Wave Theory proposes that market prices often follow repeating wave-like patterns, reflecting cycles in crowd psychology.
• A classic Elliott cycle consists of a 5-wave impulse in the direction of the main trend and a 3-wave correction against it, forming an 8-wave structure.
• Waves are considered fractal, meaning that similar patterns appear at multiple timeframes and wave degrees.
• Clear rules define standard impulse waves, while corrective waves come in many forms—zigzags, flats, triangles and combinations—making them harder to classify.
• Elliott analysis is inherently interpretive and is most effective when combined with other tools such as support/resistance, momentum indicators, volume and prudent risk management.
This guide is provided for informational and educational purposes only. It does not constitute financial, investment, tax or legal advice and should not be treated as a recommendation to buy, sell or hold any asset or to adopt any particular strategy. Markets involve risk, including the possibility of loss. Always consider your own circumstances and, where appropriate, consult qualified professionals before making financial decisions.