Technical Analysis Guides – Part 4: How to Read the Stochastic Oscillator
The Stochastic Oscillator is one of the best-known momentum tools in technical analysis. Instead of asking, “How high is the price?”, it asks, “Where did the latest closing price occur inside the recent trading range?” This shift in perspective can reveal when a move is pressing toward the top or bottom of that range, even if the absolute price level is not unusual by itself.
Developed by George C. Lane, the Stochastic Oscillator has been used for decades across equities, foreign exchange and, more recently, digital assets. Lane focused especially on how divergences between the oscillator and price could highlight potential shifts in momentum before they were obvious on the chart.
This article is written for educational purposes only. It does not provide financial, investment, tax or legal advice.
1. What the Stochastic Oscillator Measures
The core idea behind the Stochastic Oscillator is simple:
- In strong upward phases, price tends to close near the top of its recent range.
- In strong downward phases, price tends to close near the bottom of that range.
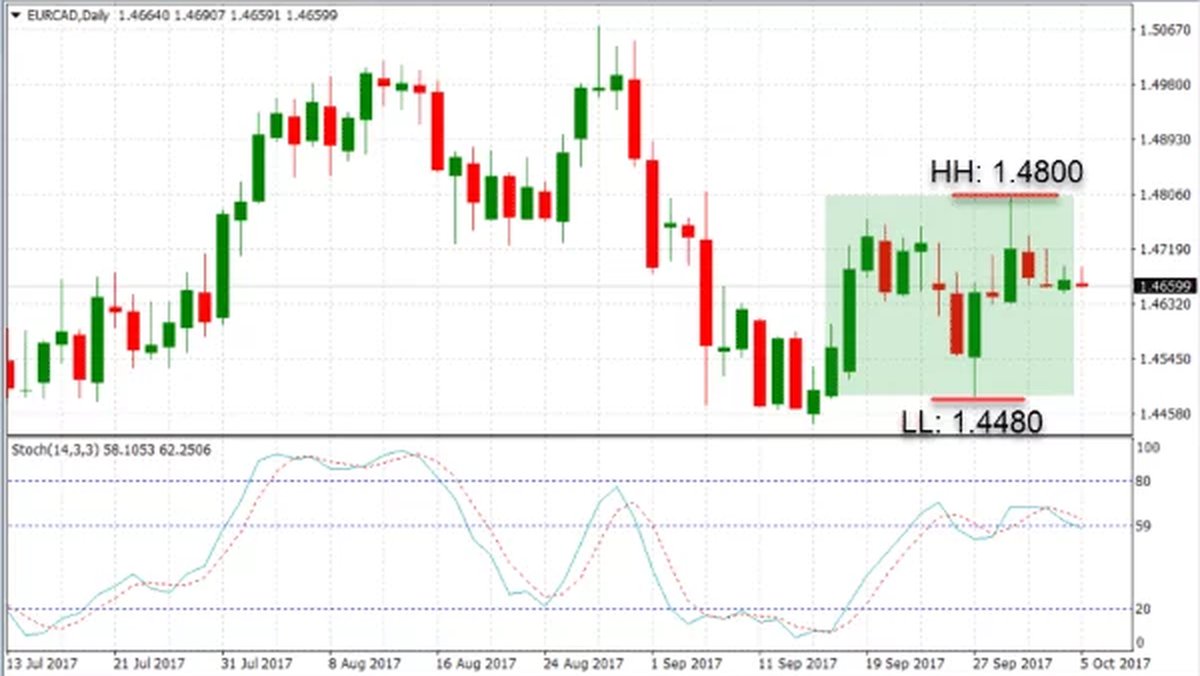
The oscillator turns this idea into numbers. Over a chosen lookback period (often 14 candles by default), it compares the latest close to the highest high and lowest low in that window, then expresses the result as a value between 0 and 100.
In broad terms:
- Readings near 100 indicate that price has been closing close to the top of the recent range.
- Readings near 0 indicate that price has been closing close to the bottom of the recent range.
This perspective makes the Stochastic Oscillator a useful way to talk about momentum and potential extremes relative to recent behaviour.
2. The Two Lines: %K and %D
On most charting platforms, the Stochastic Oscillator is shown as two lines in a separate panel below price:
- %K – the main, raw oscillator.
- %D – a smoothed version of %K, often calculated as a 3-period moving average of %K.
%K reacts quickly to new highs and lows, while %D moves more slowly and acts like a reference curve. The interaction between these two lines—whether they are close together, crossing, or moving apart—forms the basis for many interpretations of the indicator.
3. How the Stochastic Oscillator Is Calculated
Although software handles the exact numbers, it helps to understand the formula. For a given period, the basic Stochastic calculation for %K is:
%K = [(Close − Lowest Low) / (Highest High − Lowest Low)] × 100Where, over the chosen lookback window (e.g. 14 periods):
- Close is the latest closing price.
- Lowest Low is the lowest price reached in that window.
- Highest High is the highest price reached in that window.
The result is then multiplied by 100 to express it as a percentage of the range.
%D is then computed as a moving average of %K, often a 3-period simple moving average. Some platforms offer 'fast' and 'slow' variants that apply different types of smoothing, but the underlying concept stays the same: one line is more reactive, the other is more stable.
4. Reading the 0–100 Scale: Overbought and Oversold Zones
Because the Stochastic Oscillator is bounded between 0 and 100, it is frequently used to describe conditions that are stretched relative to the recent range.
A common convention uses two key thresholds:
- Above 80 – often described as a potentially overbought condition, meaning price has been closing near the top of its recent range.
- Below 20 – often described as a potentially oversold condition, meaning price has been closing near the bottom of its recent range.
However, these labels can be misleading if taken too literally. In strong trends:
- Price can continue to advance even while the oscillator stays above 80 for an extended period.
- Price can continue to decline while the oscillator remains below 20.
For this reason, many analysts interpret “overbought” and “oversold” not as promises of reversal, but as cues that momentum is strong and the market is trading close to the edge of its recent range.
5. Interpreting Crossovers Between %K and %D
Because the Stochastic Oscillator plots both a fast line (%K) and a slower reference line (%D), their crossovers attract attention.
In general terms:
- When %K crosses above %D, it suggests that recent closes are moving toward the upper part of the range more quickly than before.
- When %K crosses below %D, it suggests that recent closes are moving toward the lower part of the range.
Some chart users pay particular attention to crossovers that occur while the oscillator is already in the overbought or oversold zones, seeing them as potential early signs that momentum is changing. Others prefer to use crossovers mainly in the context of the broader trend, for example looking more closely at oversold-zone crossovers during established uptrends and vice versa.
Regardless of approach, crossovers are best seen as changes in the character of recent closes, not as automatic calls to act.
6. Divergences Between Stochastic and Price
George C. Lane placed particular emphasis on divergences—moments when the Stochastic Oscillator and price move in different directions.
6.1 Bullish-style divergences
A commonly discussed bullish-style divergence occurs when:
- Price forms a lower low relative to a previous swing, but
- The Stochastic Oscillator forms a higher low in the same time window.
This suggests that, even though price has pushed lower, it is not closing as consistently near the bottom of its recent range as before. Some analysts interpret this as a sign that downward momentum may be losing strength.
6.2 Bearish-style divergences
A bearish-style divergence occurs when:
- Price makes a higher high, while
- The Stochastic Oscillator makes a lower high.
Here, price has reached new highs, but the oscillator suggests that closes are no longer clustering as close to the top of the range. This can be interpreted as waning upside momentum.
6.3 Divergences as early warnings, not certainties
Divergences are often treated as early warnings rather than as definitive signals. In strong trends, multiple divergences may appear before any significant change in direction. There are also many turning points that occur without any clear divergence at all.
Because of this, divergences are usually combined with other forms of analysis—such as support and resistance zones, trend lines or volume patterns—before they are given much weight.
7. Strengths and Limitations of the Stochastic Oscillator
The Stochastic Oscillator is popular for good reasons, but understanding its limitations is just as important as knowing its strengths.
7.1 Strengths
- Clear and bounded scale: The 0–100 range makes it easy to see when recent closes are clustered near the top or bottom of the range.
- Sensitivity to range position: By focusing on where closes occur within the high–low band, the oscillator captures nuances that pure price-level indicators may miss.
- Useful for studying extremes and divergences: Extended readings and differences between price and the oscillator often prompt closer analysis of whether a move is sustainable.
7.2 Limitations
- Frequent extremes in strong trends: In powerful trends, the oscillator can remain overbought or oversold for long periods, which means those labels must be interpreted carefully.
- Choppiness in sideways markets: In low-direction environments, %K and %D can cross frequently, making it hard to separate meaningful changes from noise.
- Dependence on lookback settings: Different period lengths or smoothing parameters can produce quite different readings. Using a single configuration without understanding its behaviour can be misleading.
For these reasons, most practitioners treat the Stochastic Oscillator as one piece of a broader framework rather than as a stand-alone decision engine.
8. Combining Stochastic with Other Tools
The Stochastic Oscillator often becomes more informative when it is used alongside other elements of technical analysis.
8.1 Trend context with moving averages
One common approach is to combine the Stochastic Oscillator with long-term moving averages:
- When price is trading above a rising long-term moving average, some analysts focus more on periods when the oscillator emerges from oversold conditions, viewing them as potential signs that the broader uptrend is regaining strength.
- When price is below a declining moving average, attention may shift to occasions when the oscillator drops back from elevated levels, reflecting renewed downward pressure.
This type of combination helps filter out readings that conflict with the dominant trend.
8.2 Support, resistance and patterns
Another common technique is to mark important horizontal levels or chart patterns and then observe how Stochastic behaves as price approaches those areas:
- Approaching a well-defined resistance zone with the oscillator in a stretched region may prompt closer scrutiny of whether the move is becoming extended.
- Approaching support with the oscillator already depressed may lead analysts to watch for signs that selling pressure is easing.
In both cases, the indicator serves as context for a broader chart story rather than as an isolated trigger.
8.3 Complementing other oscillators
Some chart users also view Stochastic alongside indicators such as RSI, MACD or volume-based tools. When multiple indicators that measure different aspects of market behaviour point in a similar direction, the combined context can be more persuasive than any single line alone.
9. A Structured Way to Learn the Stochastic Oscillator
For readers who want to gain practical intuition, a simple historical exercise can be very effective:
1. Choose a liquid asset (such as a major digital asset, stock index or currency pair) and open a daily chart with a standard 14-period Stochastic setting.
2. Scroll back in time and mark examples where the oscillator stayed above 80 or below 20 for extended periods. Study how price behaved during these stretches instead of focusing on single candles.
3. Identify a few clear divergences—both bullish-style and bearish-style—and see which ones preceded meaningful changes and which ones did not.
4. Overlay a long-term moving average to see how the oscillator’s behaviour changes in strong trends versus sideways ranges.
5. Record your findings in a brief journal so you can refine your own guidelines over time.
This type of practice helps turn the Stochastic Oscillator from a mysterious pair of lines into a familiar, well-understood part of your analytical toolbox.
10. Key Takeaways
• The Stochastic Oscillator compares the latest close to the recent high–low range and expresses the result as a 0–100 momentum reading.
• It consists of a fast line (%K) and a smoothed reference line (%D); their levels and crossovers help describe changes in where closes are occurring within the range.
• Readings above 80 or below 20 highlight stretched conditions relative to the recent range, but strong trends can keep the oscillator extreme for long periods.
• Divergences between price and the Stochastic Oscillator can provide early warnings that momentum is changing, though they are not guarantees of immediate reversal.
• The indicator is most effective when combined with broader context—trend analysis, support and resistance, volume and sound risk management—rather than used in isolation.
This guide is intended solely for informational and educational purposes. It does not constitute financial, investment, tax or legal advice and should not be treated as a recommendation to buy, sell or hold any asset or to apply any particular strategy. Markets involve risk, including the possibility of loss. Always consider your personal situation and, where appropriate, consult qualified professionals before making financial decisions.