Technical Analysis Guides – Part 1: What Is the CCI Indicator?
The Commodity Channel Index (CCI) is a long-standing indicator in technical analysis. It was introduced in 1980 by Donald Lambert for studying commodity price cycles, but today it is used across many markets, including equities, foreign exchange and digital assets. At its core, CCI measures how far the current price has moved away from its recent average.
This guide explains what CCI is, how it is calculated, how it typically behaves on a chart and how market observers use it to study trends, stretched conditions and divergences. It is written for readers who want a clear, brand-safe and educational overview—not a list of quick rules for making trades.
Nothing in this article is financial, investment, tax or legal advice. It is for informational and educational purposes only.
1. What the CCI Indicator Actually Measures
In everyday use, CCI is a momentum-style oscillator. It compares an asset’s current price to its average price over a chosen number of periods (for example, the last 20 days on a daily chart). The result is plotted as a line that moves above and below a central value of zero.
In simple terms:
- When CCI is high, the current price is trading well above its recent average.
- When CCI is low, the current price is trading well below its recent average.
Because of this, many analysts use CCI to describe whether price is relatively strong or weak compared with its recent history, and to highlight periods when the market may be stretched to the upside or downside.
2. How CCI Is Calculated
Most modern charting platforms calculate CCI automatically, so users rarely need to compute it by hand. Understanding the formula, however, makes the indicator easier to interpret.
A common version of the CCI formula is:
CCI = (Typical Price − SMA(Typical Price, n))
      / (0.015 × Mean Deviation)
Where:
- Typical Price (TP) for each period is:
TP = (High + Low + Close) / 3 - SMA(TP, n) is the simple moving average of the Typical Price over n periods (for example, 20 candles on a daily chart).
- Mean Deviation is the average of the absolute differences between each period’s Typical Price and that SMA over the same window.
- 0.015 is a constant chosen so that, in many markets, most CCI values tend to fall between −100 and +100 during typical conditions.
Some practical notes:
- The original setting used by Lambert was 20 periods, but different markets and timeframes may call for shorter or longer windows.
- Shorter settings (for example, 14 periods) make CCI more sensitive; it reacts quickly but can be noisy.
- Longer settings (for example, 30 or 40 periods) smooth out the line and may reduce noise at the cost of slower response.
3. How CCI Looks on a Chart
On most platforms, CCI appears in a separate panel below the main price chart. The key visual elements are:
- A zero line, which represents the point where price equals its recent average.
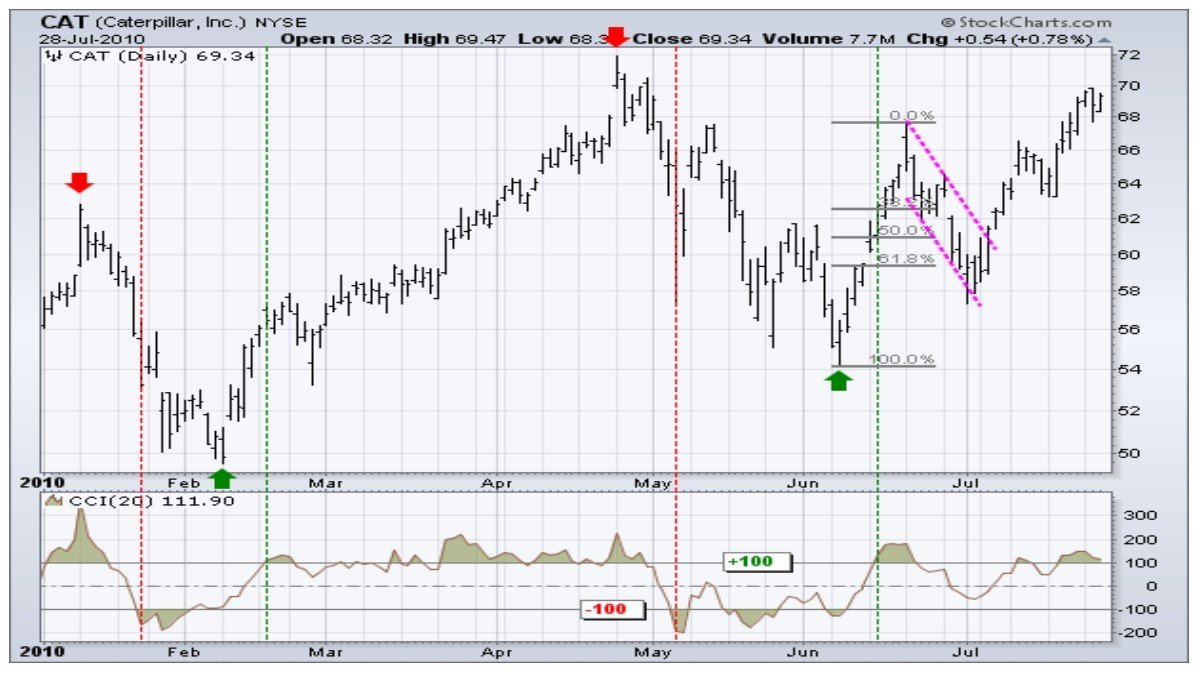
- Two horizontal reference levels, often drawn at +100 and −100.
Typical interpretations include:
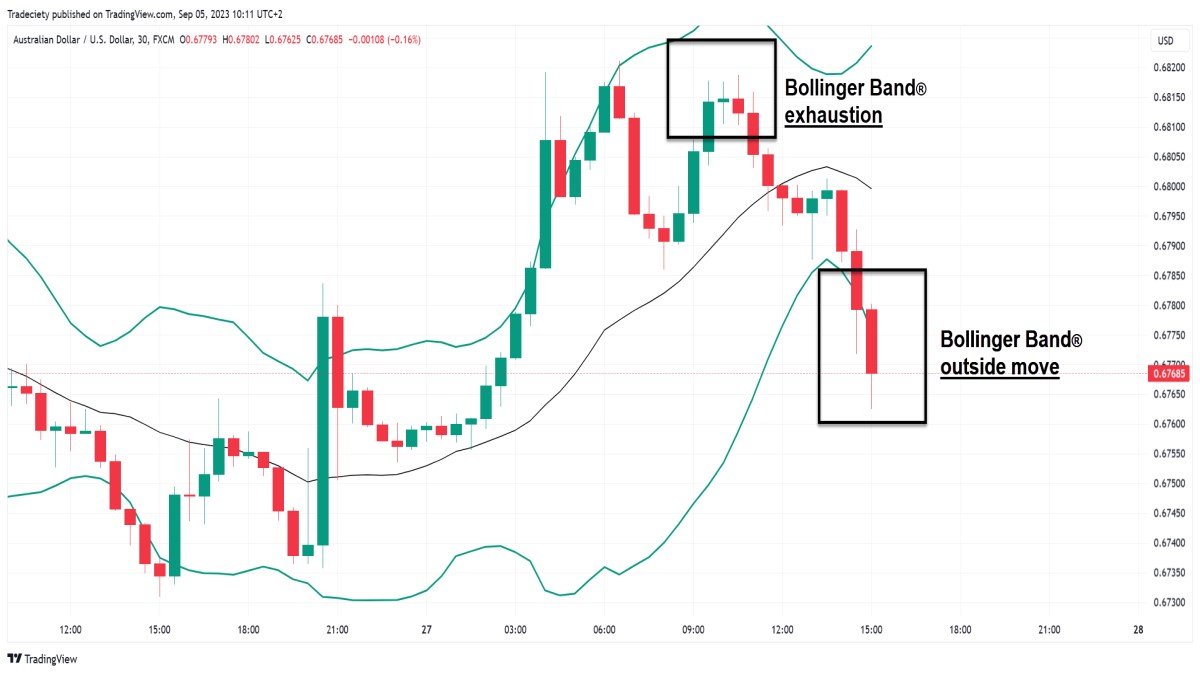
- CCI above +100: price is significantly above its recent average. Many observers describe this as strong upside momentum or a potentially stretched condition.
- CCI below −100: price is significantly below its recent average. This is often described as strong downside momentum or a potentially stretched condition in the opposite direction.
Historically, a large share of CCI values tend to fall between −100 and +100, while values outside that range highlight periods of unusually strong movement.
4. Studying Trend Strength With CCI
One common educational use of CCI is to study whether a directional move appears to be gaining or losing strength.
4.1. Emerging downside pressure
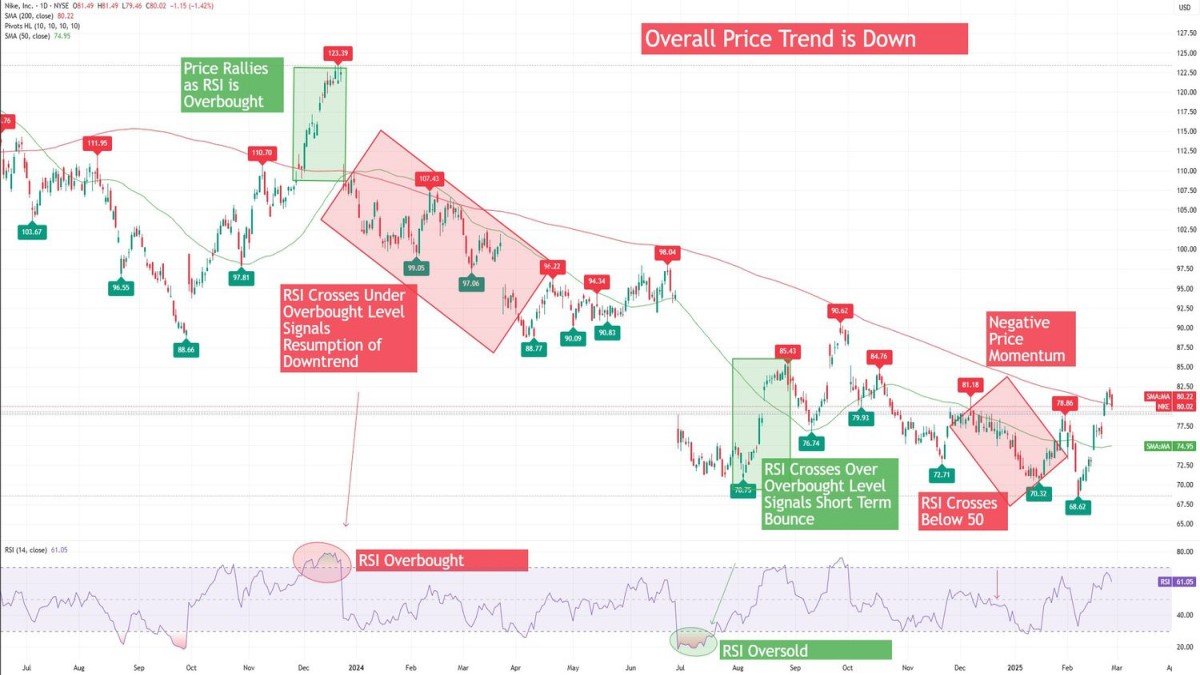
Consider a situation where price has been relatively stable or rising, and then starts to weaken. If CCI drops below −100 and stays there for a time, analysts may describe this as a phase of sustained downside pressure. The indicator is signalling that price is now trading well below its recent average.
4.2. Emerging upside pressure
Conversely, if a previously quiet or declining market begins to recover and CCI rises above +100, this is often noted as a period of strong upside momentum. Price is now trading well above its recent average.
4.3. CCI is descriptive, not predictive
Importantly, CCI does not tell anyone what must happen next. A high reading can accompany both a brief spike and a long, sustained trend. A low reading can accompany both a short-lived pullback and an extended period of weakness. CCI is best treated as a description of recent behaviour, not as a guarantee about the future.
5. CCI and Stretched Conditions (Often Called Overbought/Oversold)
Because CCI measures how far price has moved away from its recent average, it is often discussed in the context of conditions that are described as 'overbought' or 'oversold'. There are, however, several nuances that matter.
5.1. Unbounded values
Unlike some oscillators that are fixed between 0 and 100, CCI is unbounded. It has no hard maximum or minimum. Readings can climb well beyond +100 or fall well below −100, especially in strong trends. This makes it difficult to treat any particular number as an automatic turning point.
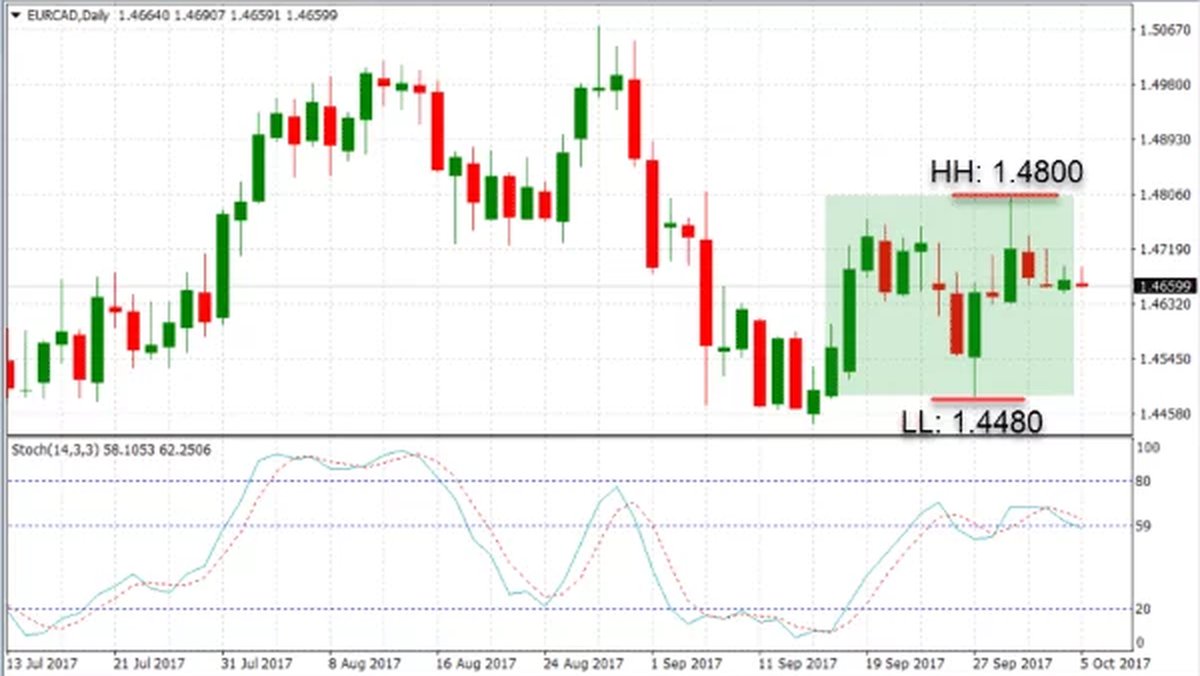
5.2. Stretched does not mean reversal
In a powerful uptrend, CCI can remain elevated—or even push toward +200—for an extended period. In a strong downtrend, it can linger well below −100. In both cases, the indicator is highlighting how intense the move has been relative to recent history, not issuing a guarantee that the move is about to end.
5.3. Alternative thresholds
Some practitioners use ±100 as their main reference levels, while others pay more attention to more extreme readings around ±200. These choices are subjective and should be adapted to the specific asset and timeframe being studied.
6. Bullish and Bearish Divergences
Another place where CCI is frequently used is in the study of divergence—differences between how price behaves and how the indicator behaves.
6.1. Bullish divergence: potential loss of downside momentum
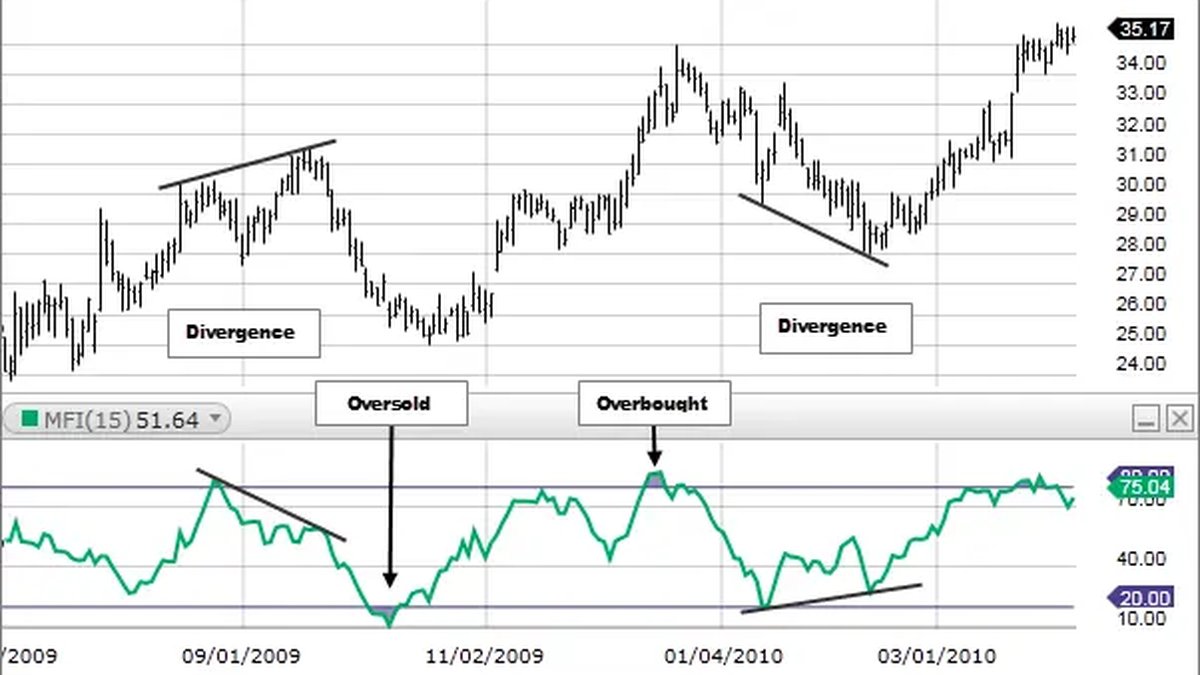
A bullish divergence occurs when:
- Price makes a lower low, but
- CCI forms a higher low during the same general period.
This pattern can suggest that downside momentum is fading even though price briefly moved to a new low. Some analysts treat this as an early warning that the downward phase may be losing strength.
6.2. Bearish divergence: potential loss of upside momentum
A bearish divergence occurs when:
- Price makes a higher high, but
- CCI forms a lower high.
This can indicate that upside momentum is weakening even though price has printed a fresh high. Again, this is generally viewed as a caution signal rather than an instruction.
6.3. The need for confirmation
Divergences should be approached carefully. In strong trends, multiple divergences can appear before any meaningful change happens. For this reason, many chart readers look for additional confirmation, such as:
- CCI crossing back through the zero line, or
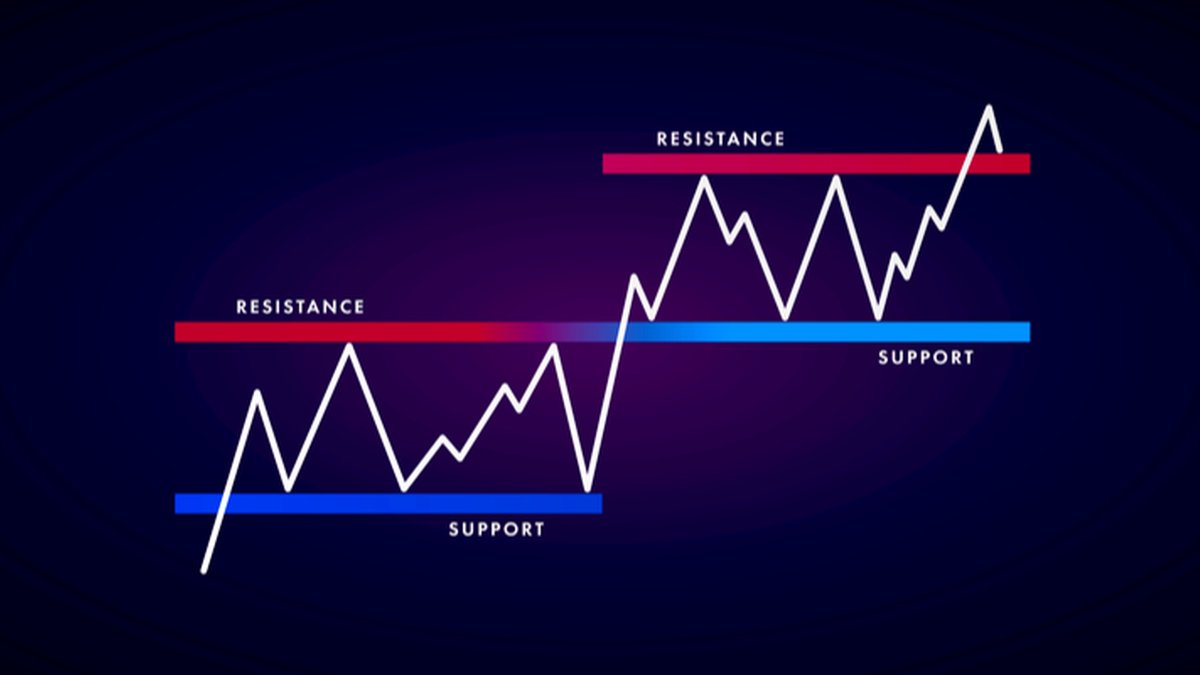
- Price breaking a clearly defined support or resistance area, or
- Confluence with other forms of analysis, such as long-term structure or fundamental developments.
In other words, divergences are usually treated as a piece of context inside a broader framework, not as a stand-alone decision rule.
7. Common Limitations and Misunderstandings
Like every indicator, CCI has limitations. Understanding them helps prevent misuse.
• Lag versus noise: Short settings react quickly but can generate frequent swings; long settings are smoother but slower to register changes.
• Subjective thresholds: Levels such as ±100 and ±200 are conventions, not universal rules, and can behave differently in different markets.
• Indicator dependence: Relying only on CCI can hide other important information such as news events, liquidity conditions or long-term structure.
• Context matters: The same CCI reading can mean different things in a tight range compared with a high-volatility breakout. Volume, timeframe and broader market conditions all influence interpretation.
8. A Practical, Educational Way to Study CCI
For readers who want to explore CCI in more depth, one constructive approach is to use it as a learning tool rather than a shortcut. For example:
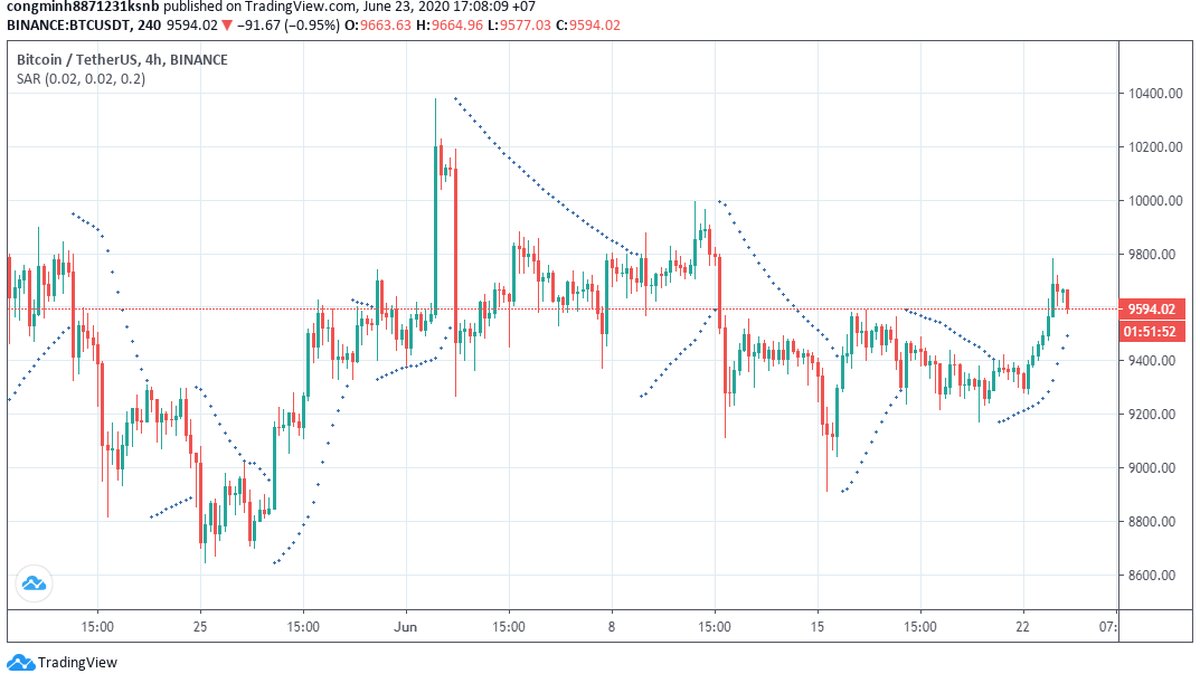
1. Add CCI with a 20-period setting to a chart of a well-known asset such as Bitcoin or Ethereum.
2. Scroll back in time and mark points where CCI moved above +100 or below −100, and note what price was doing at those moments.
3. Observe how long CCI stayed in stretched areas during strong trends versus quieter ranges.
4. Look for examples of bullish and bearish divergences and see how price developed afterwards, paying attention to cases where divergences were followed by meaningful changes and where they were not.
5. Repeat the exercise on different timeframes, such as the 4-hour and daily charts, to see how the indicator behaves over different horizons.
This type of historical review can help build an intuitive sense of what CCI is really signalling in different environments—without treating it as a mechanical recipe.
9. Key Takeaways
• The Commodity Channel Index (CCI) compares current price to its recent average and expresses the difference as an oscillator around zero.
• Readings above +100 or below −100 highlight periods when price has moved unusually far from that average, often described as strong momentum or stretched conditions.
• CCI can be used to study trend strength, stretched moves and divergences, but it is unbounded and can remain elevated or depressed for extended periods.
• Thresholds and interpretations are context-dependent; there is no single number that automatically marks a top or bottom.
• CCI works best as part of a broader, risk-aware framework that also considers price structure, volume, fundamentals and individual risk tolerance.
This guide is provided for informational and educational purposes only. It does not give financial, investment, tax or legal advice, and it should not be treated as a recommendation to buy, sell or hold any asset or to engage in any particular strategy.