Bitcoin Looks Undervalued Versus On-Chain Activity: What the NVT Golden Cross Is Really Telling Us
After weeks of relentless selling, Bitcoin now trades in the mid-80,000 USD area. Sentiment is gloomy, liquidations keep flashing across derivatives dashboards and social media is full of calls for a new multi-year bear market. In the middle of that noise, one on-chain metric is quietly painting a very different picture.
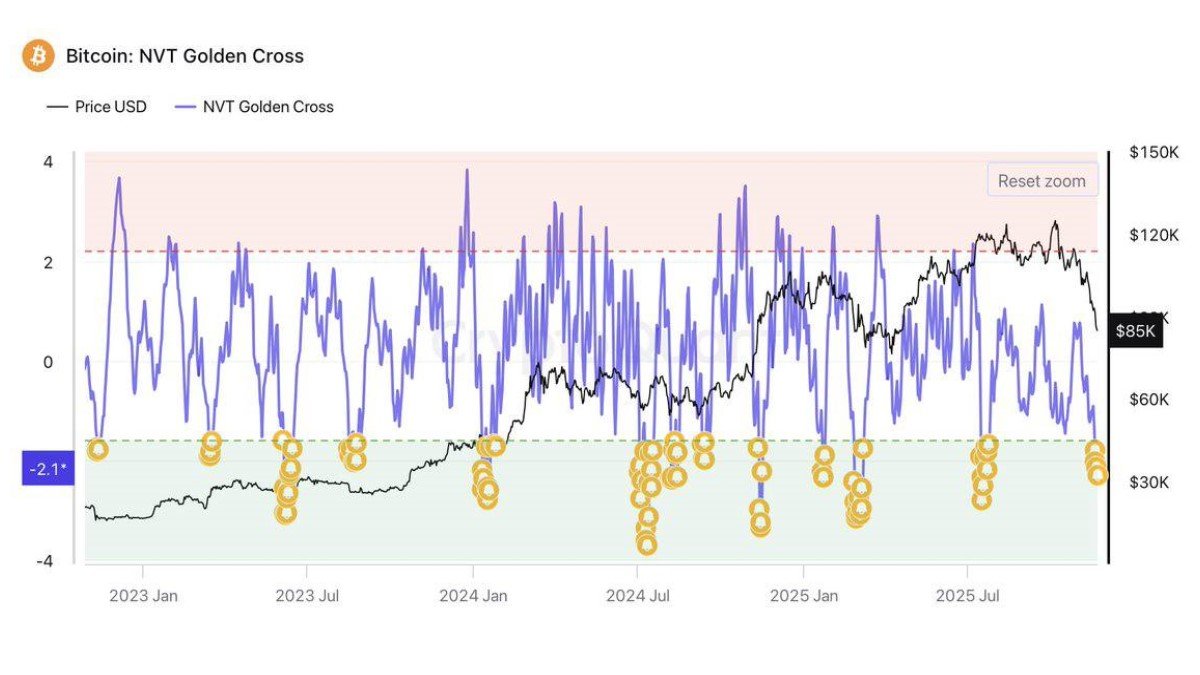
The NVT Golden Cross indicator, which compares Bitcoin's market value to the strength of value flowing through its blockchain, has dipped below the commonly watched threshold of -1.6 and currently sits around -2.1 on the chart you shared. Historically, such deep negative readings have tended to appear in late stages of major corrections, when price is weak but actual network usage is holding up or even improving. In plain language: the indicator is hinting that, relative to what is happening on-chain, the market may be underpricing Bitcoin at current levels.
Because we cannot fetch or verify live market data from within this environment, the analysis below treats the figures in your prompt and chart as scenario inputs rather than audited facts. The goal is not to declare where Bitcoin will trade tomorrow, but to unpack what the NVT Golden Cross is signalling, how it has behaved in the past and how a disciplined investor might use it without falling for false confidence.
1. What the NVT Golden Cross Actually Measures
NVT stands for Network Value to Transactions. At its core, it is a simple ratio: market capitalisation divided by on-chain transaction volume (usually in USD terms). Many analysts have described it as a kind of crypto analogue to the price-to-earnings ratio in equities. Instead of comparing price to company earnings, NVT compares price to the value of money moving through the network.
When NVT is high, it means the network is being valued richly relative to how much value is transacting on it. That often corresponds to speculative phases, narrative bubbles or periods when hodlers are sitting on their coins rather than using them. When NVT is low, it suggests that a lot of value is flowing through the chain relative to its market cap, a situation that can indicate undervaluation or a phase of organic adoption.
The NVT Golden Cross is a refinement of that idea. Instead of looking at the raw ratio, it compares shorter-term and longer-term moving averages of the underlying NVT signal, then normalises the difference. The result is an oscillator that tends to swing between overbought and oversold territory. High positive values have historically lined up with overheated tops, while deep negative values often mark attractive accumulation zones.
Different analytics providers implement the indicator with slightly different parameters, but the logic is similar: whenever the short-term NVT deviates strongly below the longer-term trend, it hints that price has over-reacted to the downside compared with on-chain activity.
1.1 Why this matters more than a simple price chart
Price alone tells you what traders are willing to pay right now. On-chain metrics like NVT tell you something deeper: how much the network is actually being used. In traditional finance terms, it is the difference between watching a stock's price and watching its revenue or user-growth metrics.
If price is falling but underlying usage is stable, you can argue that the asset is being marked down too aggressively. This does not guarantee an immediate rebound, but it suggests that sellers are reacting to macro fear and forced liquidations rather than a collapse in fundamental utility.
2. Reading the Current Signal: NVT Golden Cross Deep in the Green Zone
The chart you provided shows three key elements: the black line for Bitcoin's price in USD, the volatile blue oscillator that represents the NVT Golden Cross value, and a series of yellow circles in the lower green area marking past episodes where the indicator dropped into its undervalued zone.
Right now, the NVT Golden Cross sits around -2.1, clearly below the often referenced boundary of -1.6. In the chart's history, every time the oscillator dipped that far into the green area, a cluster of yellow markers appeared. Most of those clusters coincide with local or medium-term price lows. They do not always catch the exact bottom, but they often appear within weeks of significant reversals or at least relief rallies.
This time, the signal appears after Bitcoin has already fallen sharply from the 120,000 USD region earlier in the year down toward 85,000 USD. Importantly, the indicator is not low simply because price is low; it is low because on-chain settlement volume has not collapsed in proportion to price. Coins are still moving. Value is still being transferred. The chain is not behaving as if demand has disappeared.
From a professional analytics perspective, this combination – price down, on-chain activity holding up – is what creates a potential undervaluation story. The market is marking down the asset faster than the network's usage would justify, at least according to this particular lens.
3. Why the Market Can Underprice On-Chain Activity
To understand why such dislocations happen, it helps to step back and consider who is actually driving prices over the short term. Spot buyers, ETF flows, futures traders and options desks can move the chart dramatically without changing on-chain behaviour overnight. For example:
- A wave of ETF redemptions can force authorised participants to offload spot BTC, pulling price down even if long-term users keep transacting as usual.
- High leverage in futures markets can create chain reactions of liquidations when key levels break, pushing price far below where patient spot buyers would clear the market.
- Macro shocks – a surprise central-bank decision, geopolitical risk or equity-market drawdowns – can cause large investors to sell crypto as part of broad risk reduction, again without immediately affecting organic on-chain usage.
In all of those scenarios, on-chain metrics may remain relatively stable while price lurches violently. The NVT Golden Cross is designed precisely to flag those periods when sentiment and leverage have overshot the fundamental trend of network activity.
4. How a Professional Desk Would Use This Signal
Despite its name, the NVT Golden Cross is not a magic button that prints money. At a professional desk, no single indicator is treated as gospel. Instead, it forms part of a broader mosaic of signals. Below is how an experienced team might integrate the current reading into their process.
4.1 As a probabilistic tilt, not a binary switch
When the indicator dives below -1.6, the desk may treat it as a bullish tilt in their bias for the next several weeks or months. That could mean:
- Allowing slightly larger long allocations in multi-asset portfolios.
- Reducing the aggressiveness of hedges, for example rolling some in-the-money puts up or out in time.
- Shifting from outright short positioning to market-neutral relative-value trades.
Notice what they do not do: they do not automatically flip from net short to all-in long. Undervaluation signals are best used to adjust probabilities, not to make deterministic calls.
4.2 Favouring spot and low leverage
The analyst note that accompanies the chart rightly warns against heavy leverage in the current market. That is more than just boilerplate caution. When an indicator suggests that a bottoming process may be near, history shows that price can still overshoot dramatically before reverting. Using high leverage in that environment is a recipe for being forced out just before the move in your favour actually begins.
Professionals therefore tend to express this kind of view via:
- Gradual spot accumulation.
- Long-dated call options with limited downside.
- Structured trades that earn yield while waiting, such as covered calls or put spreads, sized conservatively.
The objective is to survive further volatility while still having meaningful exposure if and when the expected mean reversion arrives.
4.3 Timing entries with microstructure rather than with the indicator alone
The NVT Golden Cross tells you that price is cheap relative to on-chain activity, not that today's candle must be the low. A competent trading desk will therefore marry this macro signal with shorter-term tools: order-book depth, liquidation clusters, funding rates, options skew, and key technical levels.
For instance, if the indicator is deep in undervalued territory but futures funding remains highly positive and open interest is elevated, the desk may conclude that a final flush of long liquidations is still likely. They might wait for funding to normalise or for a sharp intraday wick to clear out obvious stops before stepping in with heavier bids.
5. Limitations and Failure Modes of the NVT Golden Cross
No discussion of this indicator would be complete without a sober look at when it can mislead.
5.1 Structural changes in how Bitcoin is used
On-chain volume is not a pure proxy for economic activity. It can be influenced by batching policies, exchange consolidation, emergence of second-layer solutions and even fads like inscription protocols that bloat transaction counts without proportional economic value. If a growing share of real economic settlement migrates to layers above the base chain, NVT-style indicators may systematically underestimate activity or misread spam as genuine demand.
5.2 Regime shifts in investor base
The indicator was designed and calibrated during a time when Bitcoin was dominated by retail and early institutional adopters. The rise of large ETFs, corporate treasuries and nation-state holders may change the relationship between on-chain volume and price. For example, an ETF that buys and holds coins without moving them for years can push market cap higher without increasing on-chain volume, making NVT look expensive for long stretches even if the market is simply digesting new holders.
5.3 Macro shocks that drown out micro signals
In the presence of severe macro stress – a credit event, surprise capital controls, or aggressive regulatory action – all signals can fail together. In such scenarios, undervaluation can persist for months or years as participants are forced to raise cash regardless of long-term fundamentals. An indicator based on historical relationships cannot fully anticipate such regime changes.
6. Complementary Metrics to Watch
To mitigate those risks, professional analysts rarely look at NVT Golden Cross in isolation. Instead, they combine it with other lenses that capture different aspects of the market:
• Realised price and MVRV: these metrics compare spot price to the average cost basis of the network, showing how deeply the market is in profit or loss. Clustered losses often coincide with capitulation phases flagged by undervalued NVT readings.
• Long-term holder and short-term holder supply: if long-term holders are steady or adding while short-term holders are dumping, it reinforces the idea that value is rotating from weak to strong hands.
• Stablecoin reserves on exchanges: rising stablecoin balances suggest dry powder waiting on the sidelines, increasing the odds that undervaluation will eventually be met with new buying.
• Derivatives positioning: funding rates, options skew and futures basis help determine whether forced liquidations are near exhaustion or still have fuel.
In the current scenario you described, a deeply negative NVT Golden Cross combined with evidence of short-term capitulation and relatively healthy on-chain utilisation would paint a coherent picture: we are in a late-stage flush where panic is high but the underlying network is not collapsing.
7. A Framework for Investors: From Panic to Plan
What can an individual investor do with all of this? Here is a step-by-step framework built around the indicator but careful not to worship it.
7.1 Define your time horizon up front
If you are trading intraday swings, NVT Golden Cross is too slow and noisy to be your primary tool. Its real value emerges on multi-week to multi-month horizons. Long-term investors who are comfortable holding through volatility will benefit most from using it as a guide.
7.2 Use the signal to shape a buying zone, not a single entry
Rather than trying to nail one perfect bottom, treat the period during which the indicator remains below -1.6 as a zone for scaled entries. For example, you might divide capital into several tranches and deploy them over time as long as the indicator stays deeply negative and no catastrophic macro shock appears.
7.3 Set invalidation levels that reflect risk tolerance
No indicator is infallible. Decide in advance what would tell you that this particular signal has failed for your purposes. It might be a break below a key structural level on the weekly chart, a sharp deterioration in on-chain usage, or a macro event that permanently damages Bitcoin's investment case. Having such criteria helps avoid the trap of endlessly averaging down in the name of conviction.
7.4 Avoid the leverage temptation
Perhaps the most important practical takeaway is the same one highlighted in the original commentary: do not interpret an undervaluation signal as permission to max out leverage. The point of recognising favourable odds is to survive long enough for those odds to play out. High leverage does the opposite; it narrows your margin for error precisely when volatility is highest.
8. Big Picture: What This Says About the Stage of the Cycle
When we zoom out, the combination of events is familiar to students of previous cycles. Price has fallen far enough to hurt late entrants; short-term holders are sending coins to exchanges at a loss; derivatives markets have seen waves of liquidations; headlines are full of phrases like crash and bubble burst. Yet on-chain data shows that value is still moving through the network at a healthy clip, and indicators like the NVT Golden Cross are registering extreme undervaluation.
In prior cycles, similar configurations often marked the transition from euphoria plus leverage to capitulation plus accumulation. That transition can be messy. It can involve more wicks to the downside, fake rallies and prolonged sideways ranges. But it has also tended to precede the next structural advance, as coins move from emotionally driven traders to long-term holders who are less sensitive to short-term noise.
Whether history will rhyme this time cannot be known in advance. What can be said is that, by the logic of the NVT Golden Cross and related indicators, Bitcoin at 85,000 USD with a deeply negative oscillator is not the same market as Bitcoin at 120,000 USD with overheated metrics across the board. The risk profile has changed. Where earlier the question was how far a speculative blow-off could extend before breaking, the more relevant question now is how much further fear can push price below on-chain value before patient capital steps in.
Conclusion
The latest reading of the NVT Golden Cross suggests that Bitcoin is being priced cheaply relative to the economic activity occurring on its blockchain. Historically, similar episodes have often coincided with attractive accumulation zones, particularly for investors willing to think in months and years rather than days. At the same time, the metric is not infallible, especially in a world where macro conditions, regulation and market structure are all shifting rapidly.
For a professional analysis outlet, the responsible interpretation sits between blind optimism and paralyzing fear. The indicator does not promise an imminent moonshot, but it does challenge the simplistic doom narrative currently dominating social feeds. Beneath the surface of price action, the Bitcoin network is still moving value at a pace robust enough to make current valuations look modest.
Important note: This article is based on the scenario and chart data you provided and cannot independently verify live values for the NVT Golden Cross or Bitcoin's market price. The content is for informational and educational purposes only and should not be considered investment, trading, legal or tax advice. Digital assets are highly volatile and can result in the loss of all capital invested. Always conduct your own research and consider consulting a qualified professional before making financial decisions.