Where Did the Stablecoins Go? What Shrinking USDT and USDC Inflows Say About Crypto Liquidity
For most of the past few years, stablecoins have acted as the bloodstream of the digital-asset ecosystem. When market sentiment turned optimistic, supplies of USDT, USDC and other dollar-pegged tokens expanded. When traders were cautious, issuance slowed and a portion of the supply flowed back into traditional bank accounts. Watching these movements became a simple but powerful way to track whether fresh capital was entering crypto or quietly leaving.
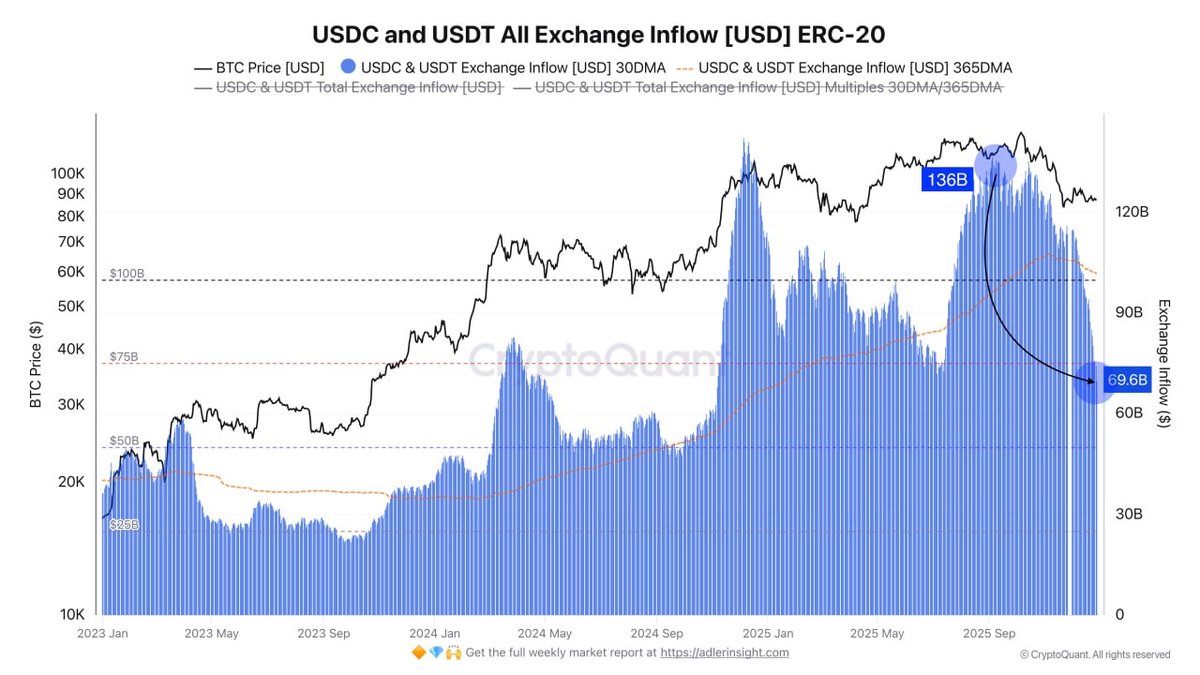
The latest on-chain data shows a clear shift. Over recent weeks, the combined market capitalization of major stablecoins has been drifting lower. At the same time, the chart of USDT and USDC inflows into exchanges (ERC-20) tells a similar story. After peaking around 136 billion USD of cumulative inflow, that figure has rolled over toward roughly 69.6 billion USD – almost a 50% decline in inflows since September.
Put simply, fewer stablecoins are being sent onto exchanges, and the overall supply is no longer expanding. This does not mean the market is about to collapse, but it does mean that common assumptions about endless "dry powder" waiting on the sidelines need to be revisited.
1. How to Read the Stablecoin Inflow Chart
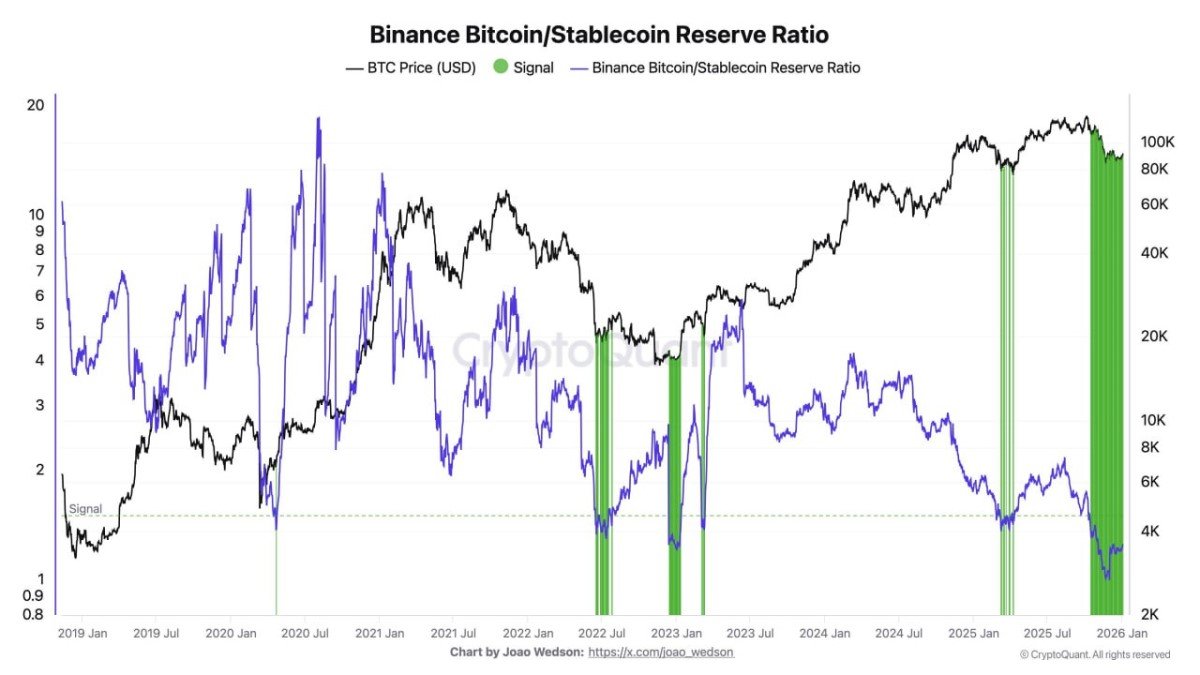
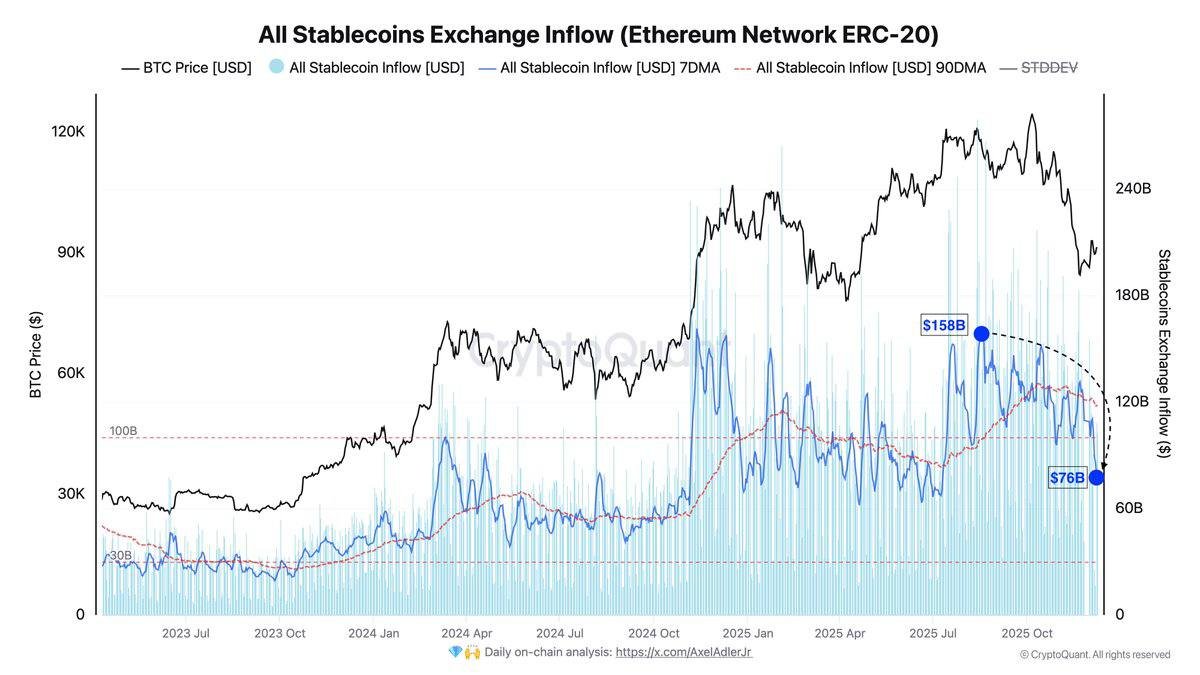
The CryptoQuant chart in focus plots three key elements:
- The black line: Bitcoin price in USD.
- The blue bars: daily USDT and USDC inflows to centralized exchanges on Ethereum, expressed in USD value.
- Smooth trend lines: 30-day and 365-day moving averages of those inflows.
Two moments stand out:
- A previous peak where inflows reached around 136 billion USD, coinciding with a strong uptrend in Bitcoin.
- The most recent reading, near 69.6 billion USD in inflows, showing that the pace of capital entering exchanges in the form of stablecoins has fallen by roughly one half.
Exchange inflows of stablecoins are often interpreted as a proxy for immediately deployable buying power. When traders and institutions are preparing to purchase Bitcoin or other assets, they frequently move stablecoins from self-custody or off-chain accounts onto exchanges. When they are defensive, the direction reverses: funds are withdrawn to private wallets or redeemed back into bank deposits.
With that framework in mind, the recent decline in inflows suggests not necessarily that investors have abandoned crypto, but that fewer participants are currently lining up to deploy new capital at scale.
2. Market Cap Is Shrinking: From Expansion to Gentle Contraction
The inflow chart aligns with another important signal: the total market capitalization of major stablecoins has been edging down for several weeks. Historically, phases of strong bull activity have gone hand in hand with a rising stablecoin market cap, as new fiat currency is converted into tokenized dollars to chase yields, participate in trading, or move across platforms.
Today the picture is different. Supplies are not collapsing, but they are gradually contracting. That tells us two things:
- Redeem pressure is slightly higher than new issuance. More stablecoins are being cashed out or moved into longer-term non-exchange storage than are being created.
- The incremental marginal buyer is cautious. Fresh capital is not rushing in at the same pace seen in earlier stages of the cycle.
In practice, this means that the market is relying more heavily on recycled liquidity – capital that already exists inside the ecosystem and rotates between Bitcoin, large-cap assets, smaller tokens and DeFi strategies – rather than a constant inflow of new money from the traditional financial system.
3. Tether’s Issuance Pause: Why "No New Mint" Matters
A key contributor to this dynamic is the behavior of the largest stablecoin issuer, Tether. For an extended period, there has been no major expansion in the supply of USDT. That absence is meaningful because of how the minting process works.
In broad terms, new USDT is created when large customers send U.S. dollars or equivalent collateral to Tether and request new tokens. Those tokens then enter the crypto ecosystem as fresh purchasing power. If Tether is not minting significant additional supply, it strongly suggests that net inflows of new fiat capital into the stablecoin layer have slowed.
The logic is straightforward:
- When demand to enter crypto rises, clients wire more dollars to stablecoin issuers.
- Issuers respond by minting new tokens, expanding market cap.
- Those tokens hit exchanges or DeFi protocols and fuel increased trading and investment.
The opposite is happening now. With Tether’s supply essentially flat and some other stablecoins seeing redemptions, the net effect is a mild but persistent squeeze on available liquidity. Existing holders can still trade actively, but they are mostly moving around existing chips rather than bringing new ones to the table.
4. Exchange Stablecoin Inflows Cut in Half: Why It Feels Harder to Move the Market Up
The decline in inflows since September is not just a cosmetic detail on a chart; it changes the day-to-day texture of the market. When stablecoin deposits into exchanges are robust, even moderate buy programs can be absorbed without dramatic price swings because there is plenty of two-sided flow. Order books are deeper and slippage is lower.
When those inflows are reduced by around 50%, several patterns typically emerge:
• Upward moves require more effort. Without a steady stream of fresh capital, rallies depend heavily on existing traders changing their positioning. Breakouts can still happen, but they often fade quicker unless macro news or structural supply changes (such as halvings) provide additional support.
• Volatility around key levels increases. Thin liquidity means that large orders can push price more aggressively in both directions. Short squeezes and rapid drawdowns become more frequent, even if the broader trend is sideways.
• Altcoins feel the squeeze first. In low-liquidity environments, the bulk of remaining capital tends to gravitate toward larger, more established assets. Smaller tokens may experience long stretches of low volume and sharp, sporadic moves driven by relatively small orders.
This is consistent with what many traders have felt in recent weeks: markets that move sharply on modest flows, relief rallies that struggle to sustain momentum, and a general sense that conditions are “thinner” than they look on the surface.
5. Why Liquidity Is Draining: Possible Drivers Behind the Numbers
On-chain charts show what is happening but not always why. Several forces likely contribute to the current stablecoin contraction and reduced exchange inflows.
5.1 Macro uncertainty and attractive yields elsewhere
With global interest rates still elevated compared with the previous decade, investors can earn non-trivial returns in traditional cash instruments such as short-term government securities and money-market funds. For cautious capital allocators, that makes it less urgent to move into crypto, especially after significant rallies earlier in the cycle.
In other words, the opportunity cost of staying in cash is no longer close to zero. This naturally slows the rate at which new funds are tokenized into stablecoins.
5.2 Post-rally fatigue
Bitcoin and several large assets have already experienced substantial appreciation from their cycle lows. After extended advances, it is common for both retail traders and institutions to take profits, de-risk and wait for clearer setups before re-entering. That cooling of enthusiasm shows up directly in stablecoin metrics: fewer new conversions, more redemptions, less urgency to send funds to exchanges.
5.3 Regulatory and structural changes
In some jurisdictions, regulatory developments around stablecoins, custodial arrangements or taxation can temporarily slow adoption. In parallel, the growth of regulated exchange-traded products means that part of the capital that might previously have passed through stablecoins now flows directly into listed vehicles instead.
These factors do not invalidate the stablecoin model, but they create additional competition for the role of "on-ramp" between fiat and digital assets.
5.4 Rotation into self-custody and alternative chains
Not all stablecoin movements show up on exchange-based metrics. Some holders may be moving funds into long-term self-custody, on-chain savings strategies or non-Ethereum networks, which can reduce measured inflows even if total usage remains steady. That said, the combination of falling inflows and flat or declining supply still points to a genuine slowdown in immediately deployable liquidity.
6. What a Low-Liquidity Environment Means for Traders and Builders
Understanding the stablecoin picture is not just an academic exercise. It has practical consequences for how participants operate in the market.
6.1 For traders
• Order execution becomes more important. With thinner order books, market orders can incur heavier slippage. Using limit orders, splitting large trades and being mindful of liquidity across venues becomes critical.
• Position sizing and risk management need extra attention. Sharp intraday moves can trigger forced closures if leverage is too aggressive. Lower liquidity magnifies the impact of sudden liquidations, both up and down.
• Signals from stablecoin data gain weight. When exchange inflows begin to rise again after a prolonged lull, that shift can provide an early indication that new capital is returning.
6.2 For long-term investors
- Entry opportunities can be more attractive, but choppier. Low-liquidity environments often coincide with discounted valuations, yet timing becomes harder because price can overshoot in both directions.
- Diversification across liquidity tiers matters. Combining positions in highly liquid assets such as BTC and ETH with more selective exposure to smaller tokens can help balance opportunity and resilience.
6.3 For builders and protocols
- User acquisition is more challenging. With less fresh capital entering, projects must compete more on product quality and genuine utility than on incentive programs alone.
- Treasury management rises in importance. Teams that rely heavily on token sales may find demand thinner; having conservative reserves and diversified holdings becomes an advantage.
7. What to Watch Next in Stablecoin and Liquidity Data
While the current snapshot points to constrained liquidity, conditions can change quickly. Several indicators deserve close monitoring over the coming months:
• Re-acceleration of USDT and USDC supply. A sustained increase in the total market cap of major stablecoins would signal that new fiat capital is again entering the ecosystem.
• Reversal in exchange inflow trends. If the blue bars on the inflow chart begin to climb back toward previous highs, it would indicate a renewed willingness among holders to deploy funds for active trading and investment.
• Changes in on-chain velocity. Beyond raw supply, how frequently stablecoins move between addresses, protocols and exchanges provides insight into whether capital is idle or actively searching for opportunity.
• Macro catalysts. Interest-rate cuts, regulatory clarity around digital assets or major product launches (for example, new payment integrations) can all trigger shifts in stablecoin usage and exchange behavior.
None of these signals guarantees a particular price outcome, but together they help investors understand whether the market is operating on a full or nearly empty fuel tank.
8. Conclusion: A Market Running on Recycled Liquidity
The recent behavior of USDT and USDC tells a clear story. The stablecoin layer of the crypto ecosystem is not collapsing, but it is operating with less fresh fuel than earlier in the cycle. Market capitalization is gently contracting, Tether has not significantly expanded its supply, and stablecoin inflows to exchanges have dropped by roughly half since September.
In practical terms, this means the market is relying more on capital already inside the system. Price action is still driven by human decisions and macro headlines, but those decisions are being made with a smaller pool of instantly deployable dollars. That tends to produce more volatile swings, sharper reactions to news and greater sensitivity to large orders.
For investors and builders who understand these dynamics, the current environment is not purely negative. Lower liquidity can create mispricings, discounts and opportunities for those who are patient and disciplined. However, it also punishes complacency: assuming that every dip will be met by an endless wall of new stablecoin inflows is no longer realistic.
Watching stablecoin metrics alongside price charts does not replace fundamental research, but it adds an important layer of context. In a market where liquidity conditions can shift in weeks rather than years, that context may be one of the most valuable tools available.
Disclaimer: This article is for educational and analytical purposes only and does not constitute financial, investment or legal advice. Digital assets and stablecoins can be highly volatile and may not be suitable for every investor. Always conduct your own research and consider consulting a qualified professional before making financial decisions.