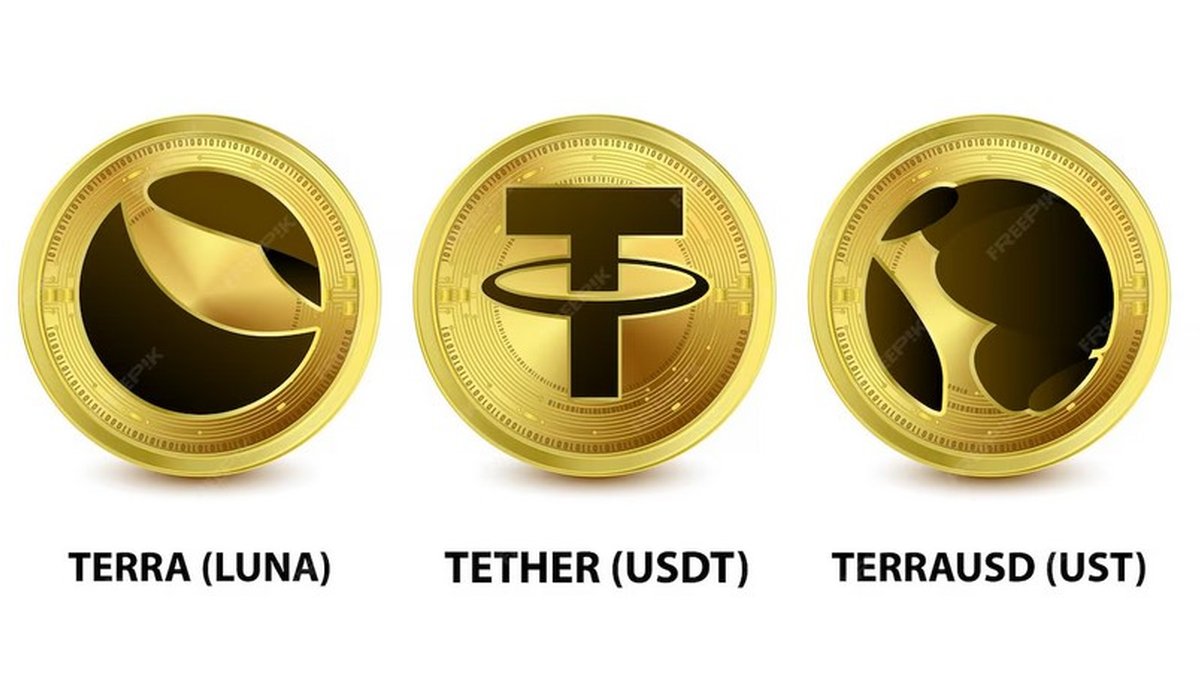
From LUNA to USDT: Can the Largest Stablecoin Survive a Crisis?
When LUNA and its sibling stablecoin UST collapsed in May 2022, the episode left a deep psychological scar on the digital asset space. A supposedly stable asset went to zero in a matter of days, wiping out capital and trust at the same time. Since then, every economic slowdown and every macro scare revives the same question: could something similar happen to USDT (Tether), the largest stablecoin in circulation?
It is a serious question, but it is also one that is often discussed in emotional terms. To build a more useful mental model, we need to separate three layers:
- Design risk – the structure of the stablecoin itself.
- Balance-sheet risk – what actually backs each unit that is issued.
- Psychological and liquidity risk – how human behaviour and market plumbing behave under stress.
This article uses a simplified, illustrative version of Tether’s reported reserve mix to run a stress scenario: what if the global economy slides into a severe downturn, Bitcoin falls sharply, gold corrects, and investors rush to redeem? How large would the potential mark-to-market losses be, and where could the real breaking points emerge?
The numbers below are approximate and designed for education, not for forensic accounting. The goal is to understand mechanics, not to make definitive claims about any specific issuer.
1. Why LUNA Collapsed – and Why USDT Is Different by Design
Before talking about USDT, it is important to recall what actually broke with LUNA and UST in 2022.
1.1 The LUNA–UST feedback loop
UST was an algorithmic stablecoin. It was not backed by a large pool of conservative assets like short-term government securities. Instead, it relied on a mint-and-burn mechanism between UST and LUNA:
- If UST traded above 1 USD, arbitrage traders could mint UST by burning LUNA and sell it for a small profit.
- If UST traded below 1 USD, they were incentivised to buy UST cheaply and redeem it for LUNA, again capturing a small spread.
On paper, this mechanism was supposed to keep UST close to its target value without needing large external reserves. In practice, it was fragile. When confidence broke and redemptions accelerated, the system had to create more and more LUNA to absorb exiting UST. The supply of LUNA exploded, its price collapsed, and the backing for UST evaporated. The mechanism that was meant to stabilise the system became the channel through which the entire structure failed.
This was a design failure. There was no large pool of external assets such as Treasury bills that could absorb an extended period of redemptions. Once sentiment shifted, the feedback loop was almost impossible to stop.
1.2 How USDT is structured
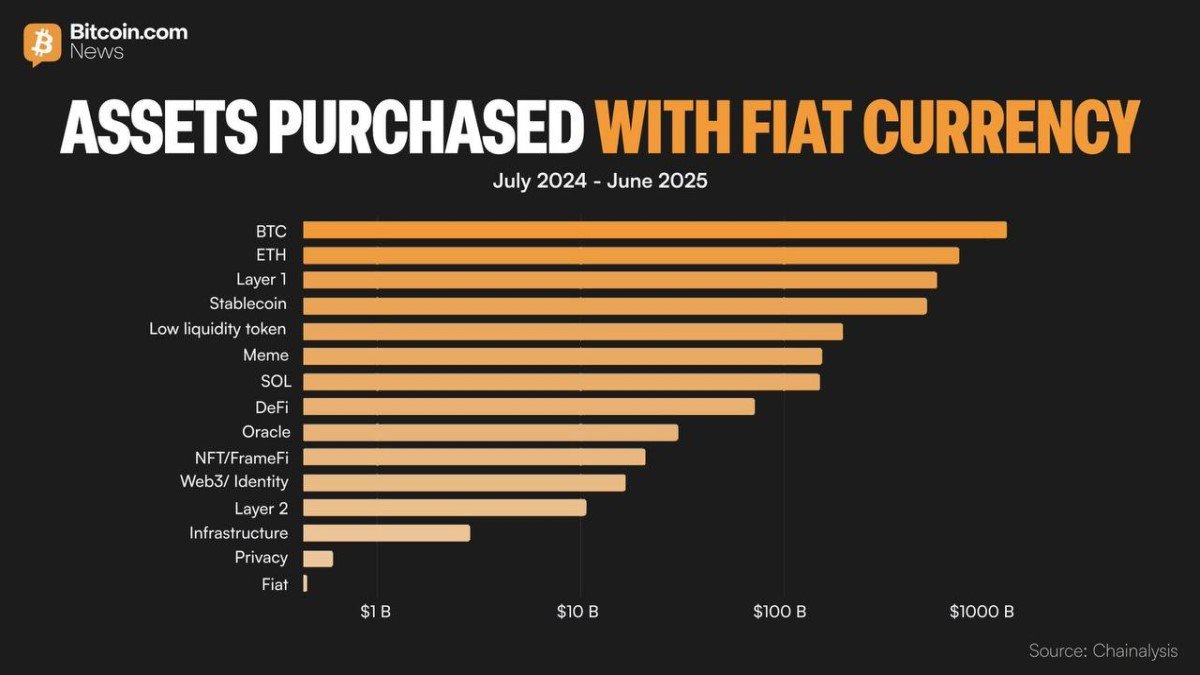
USDT is constructed very differently. Its model is simple: a user sends one unit of fiat currency (for example, 1 USD) to the issuer, and in return receives one unit of USDT. In the scenario we will explore, the simplified, stylised reserve mix looks like this:
- Short-term US government securities and cash-like assets: around 80–85 billion USD.
- Gold holdings: about 5 billion USD.
- Bitcoin holdings: around 80,000 BTC. At a hypothetical pre-crisis price of 90,000 USD, that is roughly 7.2 billion USD.
- Other investments and assets: approximately 8.8 billion USD.
In this simplified picture, the vast majority of reserves sits in short-term government securities and cash equivalents. A smaller portion is allocated to gold, Bitcoin and other assets. Unlike UST, there is no algorithmic mint-and-burn mechanism and no reliance on creating new tokens to hold a peg. The design is closer to a traditional money-market fund: the token is backed by a portfolio of assets, and the key question becomes whether that portfolio can handle large shocks.
2. Building a Severe Stress Scenario
To understand how robust that backing might be, we can walk through a deliberately harsh macro scenario. The numbers below are not a forecast; they are a way to think about capacity to absorb losses.
2.1 Market shocks
First, assume that the global economy enters a clear downturn. Investors retreat from risk, and several things happen at once:
- Bitcoin falls sharply from 90,000 USD to 35,000 USD, a decline of more than 60%.
- Gold corrects by roughly 15% as some investors raise cash by selling precious metals.
- Short-term government securities remain money-good if held to maturity, but their market prices can fluctuate if interest rates move abruptly.
At the same time, fear about the macro backdrop triggers concerns about stablecoins, and a large wave of USDT holders decides to exit into cash or other assets. That is, in effect, a stress test of both the asset portfolio and the redemption process.
2.2 Estimating mark-to-market losses on Bitcoin and gold
Start with the most volatile pieces:
- Bitcoin exposure: 80,000 BTC.
- Price drop per coin in the scenario: 90,000 USD → 35,000 USD, a loss of 55,000 USD per BTC.
- Estimated loss on BTC position: 80,000 × 55,000 USD = 4.4 billion USD.
Next, consider gold:
- Gold holdings: 5 billion USD.
- Price decline: 15%.
- Estimated loss on gold: 5 billion × 15% = 0.75 billion USD.
Combined, the hypothetical loss on Bitcoin and gold in this stress scenario is approximately 5.15 billion USD.
2.3 What about short-term government securities?
Short-term government securities behave differently. If they are held to maturity, the principal is typically repaid in full by the issuer, so the key risk is not credit risk but interest-rate risk and liquidity risk.
Imagine a simplified case:
- The issuer holds 10 billion USD of short-term government securities with a yield of 4%.
- In response to a spike in inflation or financial stress, policy rates move to 6%.
- The older securities with lower coupons are now worth less on the secondary market.
If the issuer does not need to sell, this is mostly an accounting issue. If, however, there is intense redemption pressure and they must raise cash immediately, selling these positions could realise a loss. In practice, a conservative issuer will focus on short maturities and aim to ladder the portfolio so that a portion is constantly maturing into cash.
In our stylised scenario, suppose that:
- The issuer holds around 70 billion USD in short-term government securities.
- It can sell 50 billion USD in a stressed environment but incurs a 1% price discount due to market conditions.
- This would create an additional loss of approximately 0.5 billion USD.
That brings the total hypothetical loss in this severe scenario to roughly 5.65 billion USD (5.15 billion from digital assets and gold, plus 0.5 billion from selling short-term securities under pressure).
3. Solvency vs. Sentiment: What the Spreadsheet Says
In this theoretical example, assume that the issuer also has around 6 billion USD of retained earnings and capital acting as a cushion. Under the scenario above, total losses of 5.65 billion USD would nearly absorb that buffer but would not exhaust it. On paper, the entity would still be solvent: total assets would still slightly exceed total liabilities.
That is a crucial difference from the LUNA–UST episode. In the LUNA case, the mechanism itself meant that once confidence broke, there was effectively no floor. In this USDT stress-test scenario, there is a sizeable pool of liquid, conservative assets that can be used to meet redemptions even after applying harsh price shocks.
However, solvency on a spreadsheet is not the only thing that matters. In real markets, timing and psychology can be just as important as balance sheets.
4. How Panic Can Create Temporary Deviation from the Peg
Consider what actually happens when anxiety spreads. The dynamics usually unfold in stages.
4.1 Stage 1 – Anxiety and selective information
Investors remember previous crises. LUNA in 2022, several exchange failures, and high-profile insolvencies have trained many participants to react quickly to any sign of stress. Even if a balance sheet is technically sound, the combination of alarming headlines and social media discussion can be enough to trigger defensive behaviour.
Most retail users do not study reserve reports or stress tests in detail. What they see is the narrative: news articles stating that an issuer holds large amounts of Bitcoin and that Bitcoin has fallen sharply, or commentary suggesting that losses must be large. The fine print about short-term government securities, overcollateralisation, or capital buffers receives much less attention.
The result is straightforward: a significant group of holders decides to exit first and analyse later.
4.2 Stage 2 – Price slippage on exchanges
At the level of the issuing company, the formal promise is usually simple: 1 unit of the stablecoin can be redeemed for 1 unit of the underlying currency, subject to minimum sizes and compliance checks. In practice, most users interact with the token through exchanges, not through direct redemptions.
When many people try to move out of USDT at once on trading venues, supply can temporarily overwhelm demand. If there are not enough buyers willing to step in at 1 USD, the trading price can slip to 0.99 USD, 0.98 USD, or even lower in more extreme episodes. This is a market price, not a formal change in redemption policy, but it is what most people see.
That price action itself becomes a signal. Even users who were previously comfortable may start to question their position when they see the token trading below 1 USD. This is how psychology can temporarily overpower fundamentals.
4.3 Stage 3 – Arbitrage and the return of “the math”
At some point, if the issuer is perceived as solvent and redemptions remain open, professional traders and institutional investors will notice the gap between the market price and the redemption value. For them, a price of 0.95 USD on an asset that can be redeemed for 1 USD directly with the issuer is an opportunity:
- They buy USDT at 0.95 USD on exchanges.
- They redeem those tokens with the issuer at 1 USD, subject to the operational requirements.
- They capture a 5% spread with relatively low risk, provided redemptions are functioning normally.
The more the token trades below 1 USD, the stronger this incentive becomes. The resulting demand from arbitrage strategies tends to pull the price back toward its target value. In other words, rational capital steps in to exploit the difference between market fear and balance-sheet reality.
4.4 Stage 4 – Liquidity bottlenecks as a real risk
There is, however, an important caveat. For arbitrage to work smoothly, the issuer must be able to process redemptions at scale and at speed. That requires selling assets, wiring funds, and coordinating with banking partners. Large transactions in government securities and large cross-border transfers do not always settle instantly.
If redemptions climb into the tens of billions of dollars over a short period, the issuer might face temporary timing constraints even if it is solvent on paper. A delay or temporary pause – for example, a statement that redemptions are being slowed or temporarily limited while funds are moved – could be interpreted by markets as a sign of deeper trouble, even if the reason is purely operational.
This is the true danger zone. A balance sheet can be robust, but if communication is unclear or if operational constraints force a pause, confidence can erode quickly. At that point, price deviations can become more severe, and the recovery process becomes harder.
5. What the Stress Test Really Tells Us
Putting all of this together, what does the hypothetical scenario suggest?
5.1 On the numbers
Under the severe assumptions we walked through – a major decline in Bitcoin, a correction in gold, and some losses on forced sales of short-term government securities – the calculated loss on reserves is in the region of 5.65 billion USD. With an assumed capital cushion of around 6 billion USD in this example, the issuer would still be solvent in balance-sheet terms.
That does not mean such a scenario would be comfortable, or that the cushion would always be sufficient under every conceivable shock. It does mean that there is a meaningful difference between an algorithmic design with no external collateral and a reserve-backed model with large holdings of conservative assets.
5.2 On psychology and behaviour
The more subtle insight is that the greatest risk for a reserve-backed stablecoin in a downturn may be behavioural rather than purely mathematical. In a crisis, most participants do not run balance-sheet models; they respond to headlines, price moves, and memories of past collapses.
That is why temporary deviations from 1 USD can appear even when backing is strong. It is also why clear, timely communication from issuers, transparent reporting, and reliable redemption processes matter so much. The aim is not only to have sufficient assets but also to ensure that the market believes those assets can be mobilised when needed.
6. Practical Lessons for Stablecoin Users
For individual users and institutions who rely on stablecoins for liquidity, payments or trading, there are several practical lessons that emerge from this kind of stress-test thinking.
6.1 Diversification instead of blind trust
There is no rule that says all liquidity must sit in a single stablecoin. Holding a mix of reputable issuers, including those backed by different types of assets and regulated in different jurisdictions, can reduce exposure to any one idiosyncratic event.
Just as investors do not typically place their entire portfolio in a single equity or a single bond, it is sensible to avoid relying entirely on one tokenised representation of cash. Diversification cannot eliminate systemic risk, but it can help to moderate issuer-specific shocks.
6.2 Understanding what actually backs a token
Reading reserve reports may not be exciting, but it is one of the few ways to distinguish between designs that rely heavily on internal mechanics and those that hold large pools of external assets. Key questions include:
- What percentage of reserves sits in short-term government securities and cash equivalents?
- How much is allocated to more volatile assets such as Bitcoin or other investments?
- Is there a clear capital buffer beyond liabilities – retained earnings or equity – that can absorb losses?
These questions do not require perfect information to be useful. Even approximate answers can help users compare risk profiles across different stablecoins.
6.3 Watching actions, not only prices
If a stress event arrives, the most important signals may not be the minute-by-minute price fluctuations on exchanges, but the behaviour of the issuer:
- Are redemptions still being processed in a timely manner?
- Is the issuer communicating clearly about reserve composition and liquidity?
- Are independent attestations or reports being updated and shared?
As long as redemption channels remain open and there is evidence that assets are being mobilised to meet outflows, temporary deviations between 0.97 and 1.00 USD can be seen as part of the stress mechanism rather than a definitive sign of failure. Conversely, if redemptions are suspended or restricted for an extended period without clear justification, that would be a material warning sign regardless of what any model might say.
7. Conclusion: Between Mathematics and Narrative
The central lesson from comparing LUNA’s collapse with a hypothetical stress test of USDT is that not all stability mechanisms are created equal. Algorithmic designs that rely on creating more of a linked asset when confidence fades can unwind very quickly. Reserve-backed structures with large holdings of short-term government securities, cash and conservative instruments have more tools to navigate a downturn, even if they also hold volatile assets such as Bitcoin.
In the stress scenario outlined here, even severe market moves leave the simplified balance sheet with a small positive cushion. In that framework, USDT does not mechanically follow LUNA’s path. Instead, the key vulnerability lies in timing, liquidity logistics and investor psychology. A technically solvent issuer can still face intense pressure if the market doubts its ability to convert reserves into cash fast enough.
For users, the most constructive response is not to oscillate between complacency and panic, but to deepen their understanding. That means recognising the difference between design risk and liquidity risk, diversifying across stablecoins where appropriate, and paying attention to how issuers behave in moments of stress. It also means acknowledging that market prices during a panic often reflect emotion more than underlying value.
In other words, the right question is not simply 'will USDT repeat LUNA?' but rather: how resilient are its reserves under different scenarios, how robust are its redemption processes, and how prepared are users to navigate temporary volatility without being driven entirely by fear?
Disclaimer: This article is for educational and informational purposes only and does not constitute investment, legal or tax advice. Digital assets and stablecoins involve risk, including possible loss of principal. Always conduct your own research and consult a qualified professional before making financial decisions.