Whales Accumulate, Retail Sells: Why This Pattern Matters—and Why It’s Not a “Guaranteed Bottom”
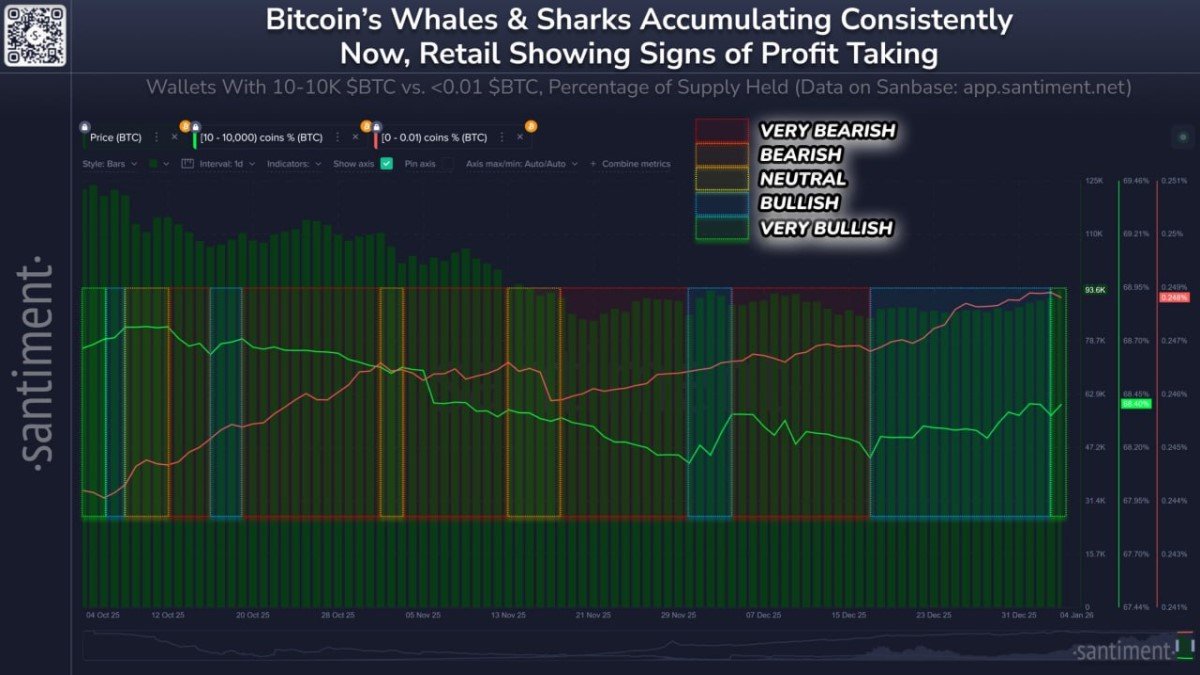
According to Santiment, wallets holding 10 to 10,000 BTC—often labeled “whales and sharks”—have accumulated an additional 56,227 BTC since December 17. Over the last 24 hours, as Bitcoin pushed up toward $94,000, smaller holders (often proxied by wallets holding <0.01 BTC) appear to be trimming exposure—taking profit and framing the move as a potential “bull trap.”
It’s a classic split-screen: large players quietly add inventory while the crowd lightens up into strength. Crypto loves to reduce this to a meme—“smart money buys, weak hands sell.” But the market is rarely that simple. The same pattern can signal a healthy regime shift or a temporary illusion created by custody flows, leverage, or narrative stress. The difference is not philosophical. It’s structural.
The real question isn’t “who is buying?”—it’s “who is setting the marginal price?”
Markets don’t move because “someone bought.” They move because a buyer was willing to pay a higher price than the last trade and there wasn’t enough sell liquidity to stop them. That’s why the whale/retail split is interesting: it hints at who is absorbing supply and whether the market is transitioning from fragile rallies to structurally supported rallies.
When whales accumulate while retail distributes, you often get a hidden dynamic: the market’s float gets tighter. Retail tends to sell in smaller chunks, frequently into liquid venues and visible order books. Whales tend to buy in ways that minimize slippage—OTC, algorithmic execution, or patient bid stacking. If that absorption is real, the “available supply” at each price level thins out, and the next leg higher can happen faster than people expect.
But there’s a catch: whale wallets don’t always represent “investors.” Sometimes they represent custodians, exchanges, ETFs, treasury vehicles, or consolidation. The signal is powerful when it reflects true net accumulation by decision-makers. It is weaker when it reflects operational reshuffling.
What Santiment’s data is good at—and what it cannot prove
On-chain segmentation is a strong lens because it’s harder to fake than social sentiment. If large cohorts steadily increase their share of supply while price holds up, that generally suggests persistent demand from deep pockets. The fact that the accumulation began around Dec 17 (per your note) adds narrative weight: it frames that date as a potential “local bottom” in positioning and psychology.
However, “local bottom” is a market word, not a physics law. A bottom is only a bottom in hindsight. The best you can say in real time is: conditions became more supportive. Whales adding 56,227 BTC can mean accumulation—but it can also mean coins moved into a smaller number of large wallets due to custody changes. Retail selling can mean fear—but it can also mean simple profit-taking after a sharp bounce. Same behavior, different motivation.
So treat the chart as a probability shifter, not a prophecy. The right read is: “If this is genuine absorption, the market is healthier than it looks.” The wrong read is: “Therefore, price must go up.”
Why retail selling into $94K is rational—and why it can still fuel a bull leg
Retail behavior often looks emotional from the outside because it is constrained by reality: smaller bankrolls, higher sensitivity to drawdowns, and shorter time horizons. When Bitcoin snaps back toward a psychologically loud level like $94K, taking profit is not irrational. It’s risk management. Many participants remember past whipsaws where rallies failed, turning “green days” into regret.
At the same time, this exact impulse—selling too early—creates the supply that stronger hands can absorb. If large holders truly believe the market is underpricing the next 6–18 months, they prefer buying into skepticism, not euphoria. That’s why “whales buy while retail doubts” has historically been a supportive pattern: it’s a form of transfer from weak conviction to strong conviction.
Still, the nuance matters. The pattern is bullish when retail selling is gradual and whales absorb it without forcing price down. It is less bullish when retail selling accelerates into panic (because that can trigger broader risk-off flows) or when whale “accumulation” is actually an exchange wallet swelling ahead of distribution.
The hidden driver: liquidity regimes and leverage, not just spot buying
Most traders talk about spot flows because they are intuitive. But in modern crypto, derivatives often decide whether a move becomes a trend or a head fake. A $94K print can be supported by spot demand, but it can also be amplified by short liquidations or suppressed by dealer hedging. That’s why the same on-chain signal can lead to two different market outcomes.
Here’s the simplest way to think about it. If whales are buying spot while leverage is being cleaned up (less crowded longs, healthier funding), you often get a sturdy grind upward. If whales are buying spot while leverage is rebuilding aggressively on the long side, you may get a sharp squeeze followed by a messy pullback—because the market becomes fragile again.
So the whale/retail split is best read as one layer in a stack. The stack also includes: derivatives positioning, stablecoin liquidity, macro risk appetite, and whether large allocators are adding through regulated rails or just rotating within crypto.
A more honest interpretation: “smart money vs. dumb money” is the wrong story
The “smart vs dumb” framing flatters one group and insults another, but it misses what’s actually happening. Whales are not always right. Retail is not always wrong. The real distinction is that whales can survive volatility and keep optionality. Retail often can’t. That survivability advantage lets whales behave differently—buying when it feels uncomfortable and waiting longer for outcomes.
In fact, the most dangerous moment for retail is not “selling too early.” It’s switching strategies mid-game: selling in fear, then buying back higher in relief, then panic-selling again. The market extracts its edge from inconsistency. If this cycle truly is shifting into a more mature regime, the edge will come less from memes and more from process.
What would confirm the bullish interpretation of the Dec 17 accumulation?
Two things matter more than the headline number 56,227 BTC. First: persistence. One week of accumulation can be tactical. Multiple weeks suggests strategic demand. Second: price response to sell pressure. If BTC holds higher lows while retail distribution continues, it implies supply is being absorbed without needing a dramatic drawdown.
In plain English: a real bottom is not a single candle. It’s a period where selling stops being effective. When sellers hit the market and price refuses to fall meaningfully, that’s when structure changes. If whales are absorbing retail’s profit-taking at $94K without losing key support zones, the bullish case strengthens—not because whales are “smarter,” but because the market’s microstructure becomes tighter.
What could invalidate the signal quickly?
There are a few clean failure modes. One is that “whale accumulation” is mostly custody consolidation, which can reverse without warning. Another is that a macro shock pulls liquidity out of risk assets broadly, causing correlations to spike—Bitcoin included. A third is a leverage rebuild that becomes too one-sided, turning the market into a liquidation machine again.
Also watch the narrative layer. If the crowd broadly labels every bounce a “trap,” that skepticism can be constructive—until a catalyst hits that forces everyone to de-risk at the same time. The market doesn’t punish skepticism. It punishes crowdedness, whether bullish or bearish.
Conclusion
Santiment’s observation—56,227 BTC accumulated by 10–10K BTC wallets since Dec 17 while retail trims into ~$94K—is a meaningful market-structure clue. It often aligns with phases where supply migrates from short-term hands to long-term hands, setting the stage for stronger continuation. But it is not a mechanical “bottom call.”
The mature way to read this is: the market may be transitioning from fragile rallies (powered by leverage and mood) to sturdier rallies (supported by absorption and tighter float). If that’s true, the biggest risk isn’t missing the exact bottom. It’s misreading the regime and trading with the wrong time horizon.
Frequently Asked Questions
Does whale accumulation always mean price will go up?
No. It can be supportive, but it can also reflect custody movement or positioning that later unwinds. It’s a probabilistic signal, not a guarantee.
Why would retail sell if whales are buying?
Because retail often has shorter time horizons, higher sensitivity to volatility, and a rational desire to lock profits after sharp moves. This doesn’t make retail “wrong”—it reflects constraints.
Is “retail selling” always bearish?
Not necessarily. Controlled retail distribution can provide supply for stronger hands to absorb. It becomes bearish when it turns into broad panic selling that drags liquidity and confidence lower.
What’s the biggest mistake when reading this chart?
Treating it like a price target generator. The chart is best used to understand supply dynamics and sentiment divergence—not to predict an exact next move.
Disclaimer: This article is for informational and educational purposes only and does not constitute financial, investment, legal, or tax advice. Cryptoassets are volatile and involve risk. Past patterns and on-chain signals do not guarantee future outcomes.