Bitcoin’s Liquidity Drought: What Falling Stablecoin Inflows Are Telling Us
Bitcoin is struggling to regain upward momentum. Price has bounced from the recent lows, but each attempt to climb higher quickly runs into invisible resistance. Spot exchange flows are quiet, derivatives activity is muted, and even positive macro headlines only produce short-lived rallies. On the surface, the market looks tired. Under the surface, on-chain data suggests a simple explanation: the pool of new liquidity is shrinking.
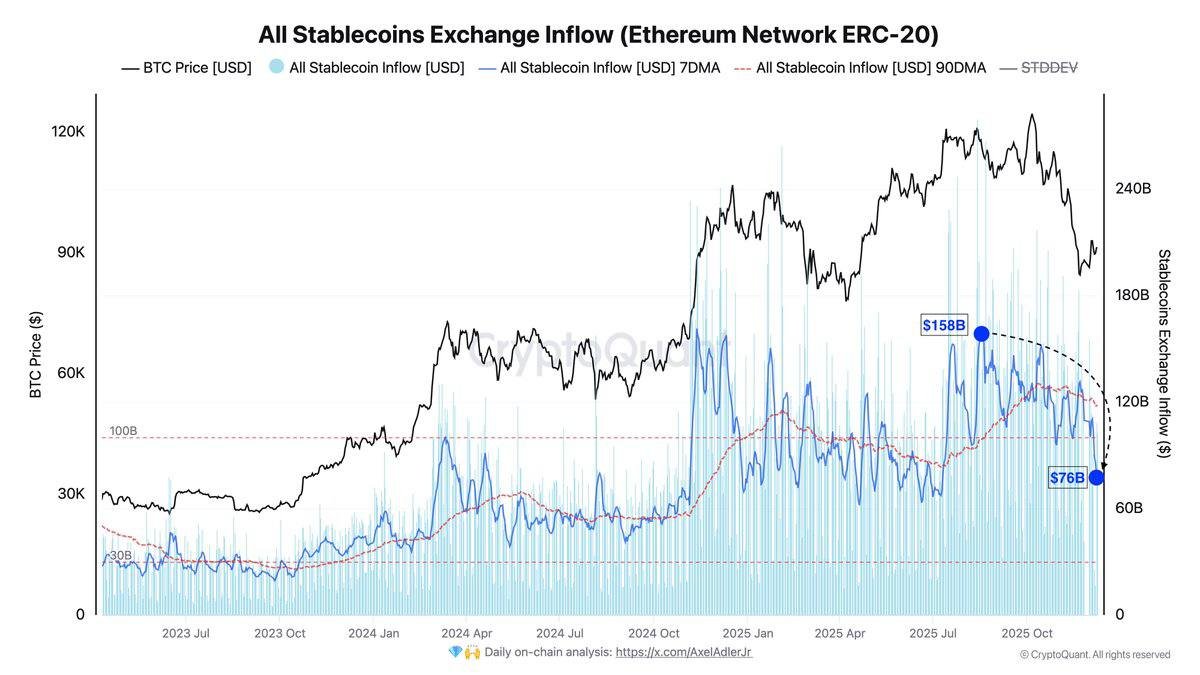
The chart above, compiled from CryptoQuant data, focuses on one of the cleanest proxies for that liquidity: stablecoin inflows to exchanges on Ethereum (ERC-20). The light blue bars represent total daily inflows; the dark blue line is the seven-day moving average; and the red dashed curve is the 90-day moving average. Overlaid is the black Bitcoin price line.
Since August, the seven-day average of stablecoin inflows has dropped from around 158 billion USD to roughly 76 billion USD — a decline of about 50 percent in new capital moving onto exchanges. The 90-day trend tells a similar, if less dramatic, story: it has slipped from approximately 130 billion to 118 billion USD. In other words, not only has the short-term pulse of capital weakened, the medium-term trend is now bending lower as well.
This is more than just a technical curiosity. In contemporary crypto markets, stablecoins are the primary fuel that powers spot trading, market-making, on-chain liquidity and, indirectly, the pricing of Bitcoin itself. When that fuel level is rising, it becomes easier for the market to absorb sell pressure and push to new highs. When it is falling, even relatively modest selling can keep the market pinned down.
1. Why stablecoins are the best real-time proxy for crypto liquidity
In traditional markets, liquidity analysis often focuses on bank reserves, money-market balances or cross-asset funding spreads. Crypto has its own language. Because most exchanges and on-chain protocols quote assets against stablecoins rather than against fiat directly, the presence of those tokens on trading venues becomes a near real-time indicator of how much deployable capital is available.
Three features make stablecoin flows particularly informative:
• They reflect fresh capital entering the trading arena. When investors move stablecoins from self-custody wallets or issuing platforms onto exchanges, it usually means they are preparing to buy, provide liquidity or rebalance positions.
• They aggregate many sources of demand. The same inflow metric captures activity from retail users deploying savings, trading firms refilling inventories, and institutional desks moving funds between venues.
• They are visible on-chain. Unlike traditional bank transfers, stablecoin movements can be tracked with high transparency, providing timely insight into market conditions that is difficult to obtain in most other asset classes.
The chart focuses on ERC-20 stablecoins — essentially, those issued on Ethereum. This does not cover the full universe of stable value tokens, which also live on networks such as Tron, Solana or layer-2 systems. Nevertheless, Ethereum remains a major settlement layer for institutional and DeFi flows, and its inflow trends have historically been closely correlated with broader risk appetite across the digital-asset space.
2. Reading the chart: from liquidity surge to liquidity fatigue
The story the chart tells can be divided into three phases.
2.1. The build-up phase
In the first part of the chart, roughly covering mid-2023 through the first half of 2024, both Bitcoin and stablecoin inflows rise together. Liquidity is expanding: new tokens are being issued, more funds are migrating from fiat into stable assets, and inflows to exchanges accelerate. The seven-day average climbs steadily, and the 90-day line follows. During this period, rallies in Bitcoin are supported by a genuine increase in purchasing power.
2.2. The climax
Around late 2024 and early 2025, inflows spike, hitting the highlighted 158 billion USD mark. This coincides with one of Bitcoin’s strongest upward legs in the cycle as price pushes through prior resistance zones. At this point, new capital is not only entering but doing so at an unusually rapid pace. This is often the stage where narrative, momentum and liquidity all feed into each other.
2.3. The erosion
From August onward, the tone changes. The seven-day inflow line starts to roll over, and successive peaks become lower. By the latest data point, the metric sits near 76 billion USD, roughly half of its high. The 90-day average, slower to move, has also turned down, sliding from 130 billion to 118 billion USD.
During the same period, Bitcoin’s price action shifts from impulsive advances to choppy, downward-sloping consolidation. This is precisely what one would expect if the market is being asked to digest ongoing sell pressure without a comparable amount of new capital to offset it.
3. Demand is the missing piece — not just narratives
It is tempting to explain Bitcoin’s hesitation through narratives: investors are waiting for more clarity on interest rates, election outcomes or regulation; traders are fatigued after a strong run; altcoin rotations are diluting attention. Those factors all play a role, but on-chain data keeps pulling us back to a simpler conclusion: there is currently not enough fresh demand to overpower existing supply.
Where does the supply come from?
• Long-term holders taking partial profits. After a multi-fold move from the 2022 lows, some early entrants are systematically trimming exposure, especially as Bitcoin revisits psychological round numbers.
• Miners and corporate treasuries. Even if miners are under less pressure than in prior cycles, they still need to sell a portion of block rewards or treasury holdings to cover operating costs and investments. Corporate holders with large positions may periodically rebalance when volatility increases.
• Structured-product hedging. As more yield products and options strategies are built on top of Bitcoin, market makers hedge their exposures through spot and futures markets, effectively adding to sell flows during specific windows.
In an environment where stablecoin inflows are strong, this stream of supply can be absorbed smoothly. Market makers have ample capital to lean against selling, and new investors can step in without significantly moving prices. But when inflows drop by half, as the ERC-20 data suggests, the balance changes. Even normal, healthy profit-taking can create outsized price impact when fresh liquidity is scarce.
4. Why the decline in inflows matters even if stablecoin supply looks healthy
An important nuance is that falling exchange inflows do not necessarily mean the total supply of stablecoins is contracting at the same pace. New tokens may still be issued, and existing balances can remain high. The problem is that an increasing share of these tokens appears to be parked in wallets, DeFi protocols or off-exchange accounts rather than being actively deployed on trading venues.
Several forces can explain this behaviour:
• Higher yields in traditional markets. With policy rates still elevated in many economies, some investors prefer short-term government instruments or money-market funds to on-exchange stablecoin balances that earn little or no yield.
• Risk management after a strong cycle. Long-only participants who rode the rally may be deliberately waiting in stablecoins on the sidelines, preserving optionality while they reassess the macro environment.
• Migration to layer-2s and alternative networks. Part of the capital pool may have shifted from Ethereum-based venues to other ecosystems, diluting the signal when we only measure ERC-20 inflows.
In practice, what matters for Bitcoin price discovery is not only how many stablecoins exist, but how many are sitting on order books, ready to transact. The chart makes clear that this active trading capital has shrunk substantially in recent months.
5. What would it take to restart a sustainable uptrend?
If lack of liquidity is the main drag, then the obvious follow-up question is: what needs to happen for stablecoin inflows to recover? There are several plausible pathways, each tied to a different driver of capital allocation.
5.1. A renewed macro impulse
One catalyst would be a clearer shift from central banks toward a more accommodative stance. Although policy rates are already easing at the margin, communication has been cautious, and some officials continue to emphasise inflation risks. A more decisive move — for example, a sequence of rate reductions accompanied by guidance that real rates will trend lower — could push a new wave of capital out of cash and into risk assets, including digital ones.
Historically, periods of declining real yields and stable inflation expectations have coincided with expansions in stablecoin issuance and exchange inflows. Investors seek assets with higher return potential, and digital assets become a natural candidate for a portion of that search.
5.2. New on-ramps and regulated products
Another route involves infrastructure rather than macro policy. When regulated venues add spot products, licensed banks integrate digital-asset rails, or large payment firms adopt stablecoins for cross-border flows, they lower the friction for new participants to enter the market. Each time an institution enables their clients to move from fiat to stablecoins in a familiar environment, the potential pool of inflows grows.
Recent developments — from banks exploring tokenised collateral to regulators clarifying the status of specific stablecoin issuers — point in this direction, but the implementation is gradual. In the short term, those initiatives may not yet offset the cyclical slowdown captured in the current inflow data.
5.3. Rotation from passive holding to active deployment
Finally, even without fresh external capital, market conditions can change if existing stablecoin holders decide to redeploy. A period of relative price stability, followed by evidence that selling pressure is fading, often encourages sidelined investors to restart dollar-cost-averaging or to provide liquidity at attractive levels.
Monitoring metrics such as the ratio of stablecoins on exchanges vs. in self-custody, or changes in large-holder behaviour, can help gauge whether such a rotation is underway. At the moment, however, the downward slope of inflows suggests that this reactivation has not yet happened at scale.
6. How traders and long-term holders can use this information
From an educational standpoint, it is important to highlight what on-chain liquidity metrics can and cannot tell us.
They can:
- Provide early warning when the market is entering a phase where rallies may be shallow because the supply of new capital is shrinking.
- Help distinguish between corrections driven mostly by temporary sentiment and those occurring against a backdrop of deteriorating funding conditions.
- Offer context for interpreting price moves — for example, whether a sudden spike is accompanied by a surge in inflows or is occurring in a liquidity-thin environment.
They cannot:
- Predict exact price levels or timing of reversals. A recovery in inflows can lag price by weeks, and markets can occasionally move higher even as liquidity indicators soften, especially if supply suddenly retreats.
- Capture activity on every network or venue. The chart here focuses on ERC-20 inflows; capital moving through other layers may offset part of the decline.
- Replace broader macro analysis. Real yields, equity valuations, credit spreads and regulatory developments still shape how investors allocate across asset classes.
For long-term participants, the key takeaway is not that the cycle is over, but that the current phase is characterised by liquidity fatigue. In such an environment, strategies that rely on continuous upside or very rapid trend continuation carry higher risk, while approaches that focus on gradual accumulation, risk management and patience tend to be more resilient.
7. Conclusion: liquidity as the quiet driver of the cycle
Narratives change quickly in digital-asset markets. One month the focus is on monetary policy; the next it is on new exchange-traded products, corporate treasuries, or technological upgrades. Beneath all of those stories, however, sits a quieter but more persistent driver: liquidity.
The latest on-chain data shows that ERC-20 stablecoin inflows to exchanges have fallen from around 158 billion to 76 billion USD on a seven-day basis, while the 90-day trend is bending lower as well. That roughly 50 percent decline in fresh deployable capital helps explain why Bitcoin, despite strong longer-term fundamentals and growing institutional adoption, is finding it difficult to sustain a robust recovery.
Until those inflows stabilise and begin to climb again, the market is likely to remain in a region where rallies are possible but fragile, and where the balance between existing sellers and new buyers is finely tuned. For observers and participants alike, watching the flow of stablecoins may be as important as following any headline or narrative. Price tells us where the market has been; liquidity often hints at where it is capable of going next.