The Binance BTC/Stablecoin Reserve Ratio: A Liquidity Signal, Not a Crystal Ball
One of the fastest ways to misread crypto markets is to treat a single metric like a prophecy. The Binance BTC/Stablecoin reserve ratio is popular precisely because it feels intuitive: when the ratio compresses (Bitcoin reserves look smaller relative to stablecoin reserves), traders interpret it as rising “buying power” sitting on the exchange—dry powder waiting to be deployed. That’s the core claim behind today’s setup.
And to be fair, there is a real, mechanical logic here. Spot markets clear with quote currency. If more stablecoins are available where trading happens, the market can absorb sell pressure better and can also push higher more easily—if participants actually choose to spend that liquidity rather than park it defensively. The problem is that “liquidity exists” and “liquidity will be used to buy risk” are not the same sentence.
1) What the ratio actually measures (and what it doesn’t)
Despite the name, the ratio is not a direct measure of demand. It’s a measure of inventory—how much BTC and how much stablecoin are sitting on Binance at a given time. Inventory is upstream of price, not the same thing as price. It’s the “materials in the warehouse,” not the “sales at the checkout.”
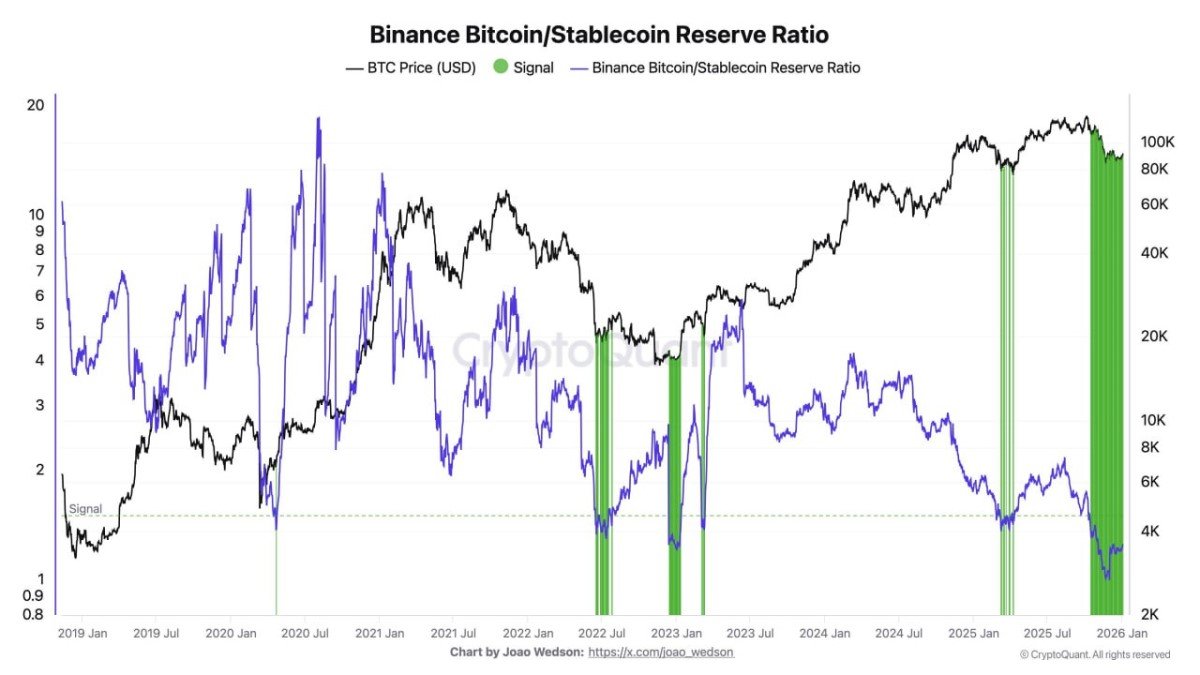
When the BTC/Stablecoin reserve ratio drops, it typically means stablecoin reserves are rising faster than BTC reserves (or BTC is leaving faster than stables). Many analysts label these periods as “signal zones,” because historically they have sometimes aligned with better forward returns—especially after a market has already been punished and positioning is less crowded.
But here’s what the ratio doesn’t tell you: it doesn’t reveal intent. The chart can’t tell whether those stablecoins belong to dip-buyers, market makers hedging delta exposure, desks preparing to short perps, or participants simply repositioning collateral. Same liquidity, very different behavior under stress.
2) Why the March 2025 comparison is emotionally compelling
You referenced the closest comparable moment: the March 2025 correction, when BTC reportedly fell from roughly $109k to $74k before beginning a new rally that ultimately carried price to an ATH around $126k. This sequence matters because it matches a familiar market rhythm: leverage gets cleansed, fear peaks, and then liquidity quietly rebuilds.
In that kind of regime, a reserve-ratio “signal” can look uncanny—not because the metric is magical, but because it often appears when the market transitions from forced selling to discretionary risk-taking. After a big drawdown, stablecoins tend to re-accumulate on exchanges as participants prepare to re-enter. If they do re-enter, price responds quickly because the marginal seller has already been exhausted.
Still, the most important word in that paragraph is “if.” A similar chart shape can occur in a different macro environment, with a different derivatives structure, and a different risk appetite. History can rhyme without repeating the chorus.
3) The “buying power” story is plausible—here’s the version that makes sense
Let’s steelman the bullish interpretation, because it’s not unreasonable. A lower BTC/Stablecoin ratio can represent a market that is reloading quote currency on-exchange. In practical terms, it can improve the market’s ability to bid—to catch dips without needing new fiat rails at the exact moment volatility spikes.
In a healthier liquidity setup, three things often happen together:
- Stablecoins rise on-exchange while volatility cools: liquidity is not just arriving, it’s arriving into a calmer tape where people are willing to execute spot buys.
- Spot activity matters more than perp reflexes: price advances are less dependent on leverage and more on actual inventory transfer from sellers to holders.
- Dips become “shallower”: not because dips vanish, but because the market finds buyers sooner, reducing the distance price must fall to locate demand.
Under those conditions, the reserve ratio behaves like a liquidity tailwind. It doesn’t guarantee upside, but it makes upside mechanically easier to express—especially if the market is under-owned relative to its narrative (institutional adoption, macro uncertainty, or crypto-friendly policy signals).
4) The less popular interpretation: a low ratio can also be a warning label
Here’s the part most headline threads skip: sometimes stablecoins accumulate on an exchange because participants are preparing for volatility, not for upside. In other words, stables can be “buying power,” but they can also be “defensive cash.” The ratio doesn’t tell you which one it is.
There are at least three scenarios where a favorable-looking ratio can fail to produce a sustained rally:
- Collateral migration for derivatives: stablecoins may arrive primarily to support margin, hedges, or short positioning. Liquidity is present, but its first job is risk management—not buying spot.
- One-way positioning: if everyone already expects the signal to work, markets can front-run themselves. The metric becomes a consensus trade, and consensus trades are fragile when a surprise catalyst hits.
- Macro shock timing: stablecoins might be loaded ahead of major events (jobs data, inflation, central bank surprises). Participants want optionality. Optionality can flip bearish instantly if risk-off sentiment takes over.
That’s why treating the ratio as a “go long” button is a category error. It’s closer to a weather report: it tells you the conditions, not the outcome.
5) How to read the signal like a professional (without pretending to be one)
If you want this metric to become analysis rather than superstition, you pair it with context that answers one question: Is liquidity arriving with risk appetite, or arriving with fear? You don’t need a dozen indicators. You need a few that clarify intent.
These cross-checks are usually more informative than arguing about the ratio alone:
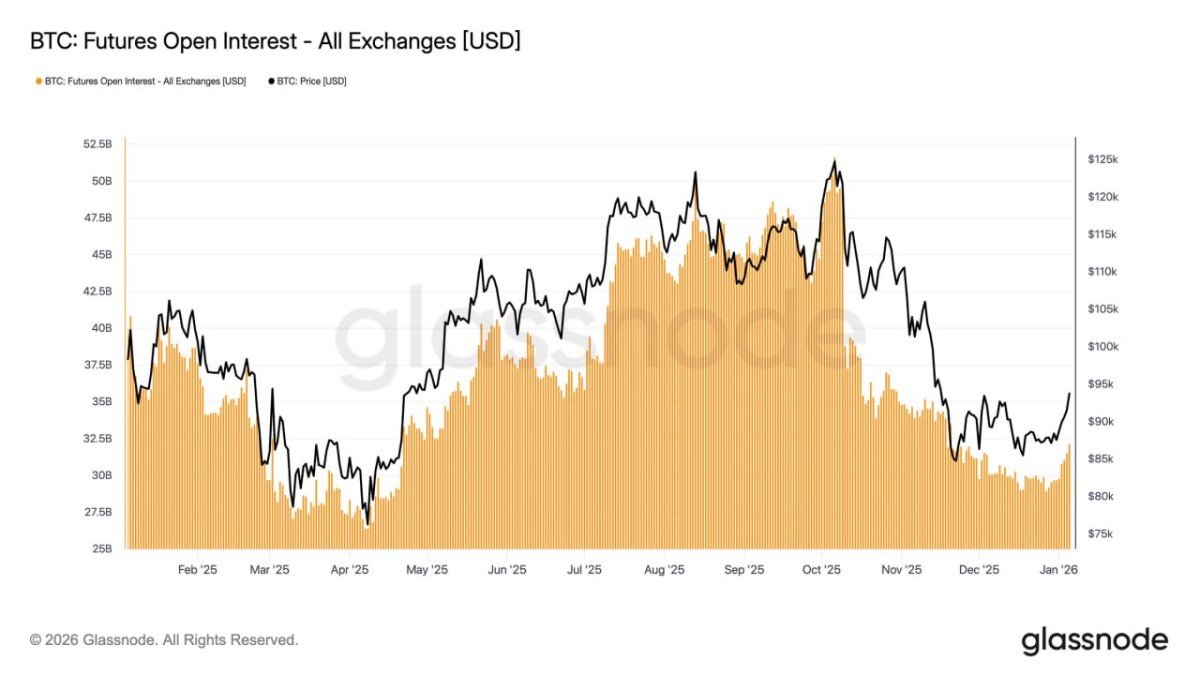
- Funding + open interest behavior: if funding is calm and open interest isn’t exploding, liquidity rebuilding can be constructive. If funding is euphoric and open interest is stretched, liquidity may be fueling leverage—more fragile.
- Spot vs. perp dominance: spot-led moves tend to be sturdier. Perp-led moves can be fast but more prone to liquidation cascades in both directions.
- Exchange net flows (BTC and stablecoins): stablecoins rising while BTC quietly leaves exchanges can look like accumulation. Stablecoins rising while BTC also piles in can mean “inventory for trading,” which cuts both ways.
None of these are perfect. But together, they force you to think in balance-sheet terms instead of narrative terms—and that’s where real market edges live.
Conclusion
The Binance BTC/Stablecoin reserve ratio is a useful lens because it is fundamentally about liquidity posture. When it compresses, it can indicate that stablecoin firepower is rebuilding on the venue—one ingredient that can support higher prices. Your March 2025 analogy captures why traders watch it: after a violent correction, liquidity returning to exchanges often coincides with a regime shift from forced selling to voluntary risk-taking.
But the same chart can also reflect defensive cash management, derivatives collateral rotation, or consensus positioning that becomes vulnerable to shocks. The ratio is not “bullish” or “bearish” by itself. It is a clue about the market’s inventory—and inventory only becomes direction when intent shows up.
Used properly, this metric doesn’t tell you what will happen next. It tells you what the market is capable of doing next—depending on how participants choose to spend their liquidity.
Frequently Asked Questions
Does a lower BTC/Stablecoin ratio always mean Bitcoin will pump?
No. It can indicate more stablecoin liquidity relative to BTC on the exchange, but it doesn’t reveal whether that liquidity will be used to buy spot, hedge risk, or support derivatives positions.
Why would stablecoins increase on an exchange if people are scared?
Because stablecoins are optionality. In uncertain periods, participants often move stables onto venues so they can react quickly—either to buy dips or to manage margin and hedges.
Is the March 2025 pattern proof the signal works again?
It’s a reference point, not proof. Similar setups can lead to different outcomes depending on macro conditions, leverage, and market structure at the time.
Disclaimer: This article is for informational and educational purposes only and does not constitute financial, investment, legal, or tax advice. Cryptoassets are volatile and involve risk. Past patterns are not guarantees of future results.