Bitcoin Futures Open Interest Is Rising Again: A Healthy Return of Risk Appetite—or the First Ingredient of the Next Shakeout?
When traders say “open interest is rising,” it usually sounds like a simple bullish headline: more money is coming in, risk appetite is back, and the market is warming up again. The problem is that open interest (OI) is not a vote of confidence. It’s a measure of commitment. And commitment can be either stabilizing or explosive depending on what kind of positions are being built.
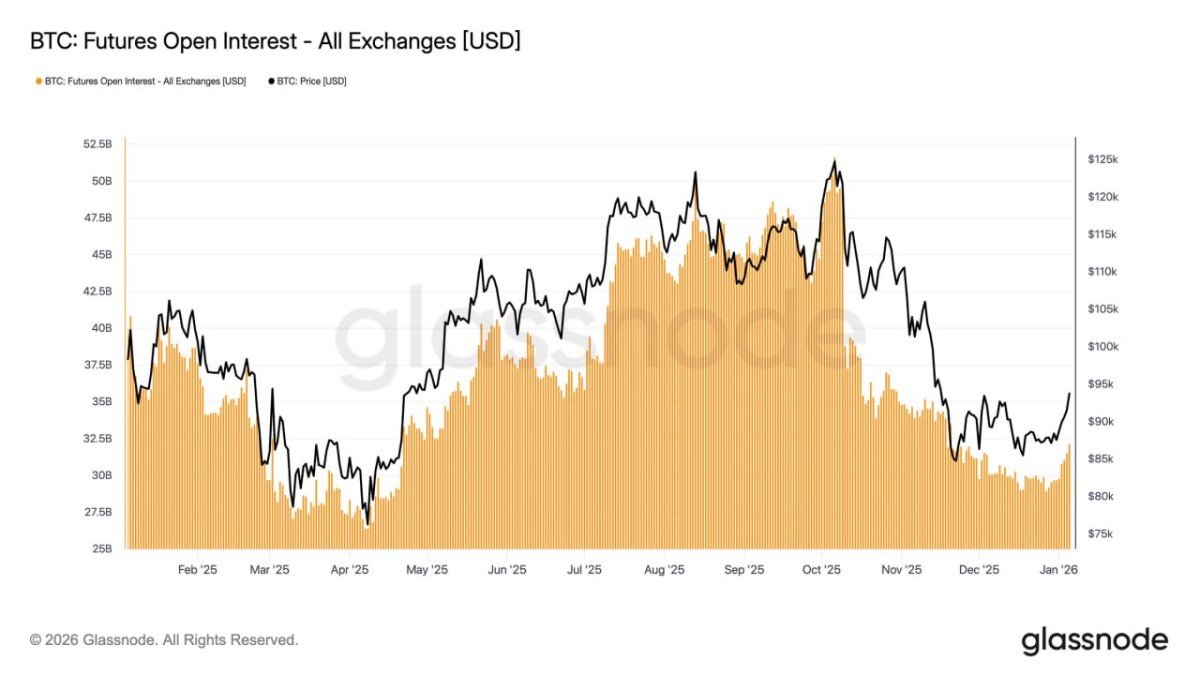
Your chart (Glassnode, futures OI across all exchanges in USD) shows OI climbing again into early 2026 alongside a modest price recovery. That does suggest an improving willingness to take risk and a derivatives market that’s regaining traction after a cooling phase. But the deeper question is the one most news recaps skip: is this “good leverage” or “bad leverage”?
What Open Interest Really Is (And Why It’s Often Misread)
Open interest is the total notional value of outstanding futures positions that have not been closed. It rises when new positions are opened and falls when positions are closed. That’s it. OI does not tell you:
• whether positions are long or short (directional bias),
• whether they’re hedges or bets (intent),
• whether leverage is high or low (fragility),
• whether the market is balanced or crowded (stability).
So when OI rises, the correct interpretation is not “bullish.” The correct interpretation is: more positions exist that can be forced to close. That’s both the fuel for smoother price discovery and the fuel for sudden cascades.
Why Rising OI Can Be a Sign of a Healthier Market
Despite the risks, rising OI can absolutely reflect improvement. In markets that have been through a drawdown or an extended chop, traders reduce exposure. Liquidity thins. Spreads widen. Price becomes jumpier. When OI returns gradually, it often coincides with three constructive dynamics:
1) More two-sided participation
A recovering derivatives market usually brings back both longs and shorts. Two-sided flow reduces the odds that price moves are purely one-directional panics. Paradoxically, healthy short activity can stabilize markets by providing liquidity into rallies and by enabling basis/hedge strategies.
2) More hedging and inventory management
As institutional access grows (ETFs, prime brokerage rails, custodial infrastructure), more participants use futures for hedging rather than gambling. A miner hedging production, a market maker delta-hedging options, or an ETF liquidity provider managing inventory can all add OI that makes the market more resilient.
3) Better price discovery
Derivatives often lead spot in signaling consensus. Rising OI can mean the market is rebuilding the machinery that translates disagreement into price, rather than leaving spot to lurch on thin liquidity.
This is the optimistic interpretation behind your note: rising OI can indicate improving risk appetite and a derivatives market that is “normalizing.” That’s plausible—especially if the rise is gradual and price volatility does not spike alongside it.
Why Rising OI Can Also Be the Setup for the Next Volatility Spike
Here’s the part that makes OI such a sharp tool: it doesn’t just measure activity, it measures stored tension. Every futures position is a potential forced buyer or seller if margin gets stressed. When OI rises faster than real liquidity, the market becomes like a crowded theater with too few exits.
Two classic failure modes:
1) Crowded directional leverage
If OI rises because everyone is leaning the same way—typically leveraged longs after a rebound—then a modest dip can trigger liquidations, which push price lower, which triggers more liquidations. The result is not “risk appetite,” it’s reflexive fragility.
2) Hidden basis unwinds
Not all leverage is a retail long. In more mature markets, a lot of OI can come from cash-and-carry trades (long spot/ETF, short futures), yield harvesting, or funding-based strategies. These can be stable—until volatility rises or the basis compresses quickly. Then “low-risk” trades unwind together, and the market still dumps. The flow looks institutional, but the reflex looks the same.
This is why the best mental model is: OI is a volatility amplifier. It doesn’t create direction by itself, but it can magnify whatever direction the catalyst pushes.
The “Stabilizing Derivatives” Narrative: When It’s Real
How do you tell whether OI growth is healthy? You look for signs that the market is rebuilding exposure without building instability. Even without extra data, there are practical “behavioral” tells:
• OI up + price up + volatility down often implies constructive participation (positions are being built without constant forced unwinds).
• OI up + price flat + volatility down can mean hedging, basis trades, or range positioning—often healthy but watch for compression risk.
• OI up + price up + volatility up is more dangerous: it can be a leverage race where the first downside impulse triggers a cascade.
In other words, “derivatives demand returning” is only bullish if it comes with market quality—not just market quantity.
Why 2026 Is Different: Open Interest in a Post-ETF, Multi-Venue World
In earlier cycles, rising futures OI was often shorthand for “speculation is back,” because the dominant marginal player was retail leverage on a few venues. In 2026, the structure is more complex:
• Liquidity is more distributed across exchanges, on-chain perps, ETFs, and OTC flows.
• Participants are more diverse: retail, prop firms, market makers, treasury-style accumulators, ETF liquidity providers.
• Intent is more mixed: not just directional bets, but hedges, basis, and structured strategies.
This makes OI more informative in one sense (it reflects broader adoption), but less useful as a simplistic signal (because you can’t assume the same player type is driving it). In a mature market, rising OI can be “boring”—and boring is often bullish, because boring is what stability looks like.
So What Does Rising OI Mean Right Now?
Based on your framing—OI rising as sentiment improves and derivatives demand stabilizes—the most reasonable interpretation is:
1) Risk tolerance is returning. Traders are willing to hold exposure again rather than staying flat.
2) The derivatives engine is switching back on. More participants are using futures for positioning and hedging, which can improve liquidity.
3) The market is rebuilding “stored leverage.” That can support trends until a catalyst forces deleveraging.
That final point is the nuance most commentary misses. Rising OI is not a green light; it’s a statement that the market has more to unwind if things go wrong. If price keeps climbing and OI keeps rising, the next pullback may be sharper than expected—not because the market is weak, but because the market is more “loaded.”
Conclusion: Open Interest Is the Thermometer, Not the Diagnosis
Rising Bitcoin futures open interest can indeed reflect improving risk appetite and a derivatives market that is becoming more orderly again. That’s the constructive story: more liquidity, more participation, better price discovery.
But OI is also the market’s stored kinetic energy. It makes trends smoother—until it makes corrections violent. The real edge is not celebrating OI growth as bullish; it’s recognizing what kind of regime it implies: a market that’s getting comfortable again. Comfort is how bull markets are built. Comfort is also how leverage quietly accumulates.
In 2026, the “bullish” version of rising OI is the boring one: steady growth in exposure without panic spikes. If OI climbs while volatility stays contained, that’s normalization. If OI climbs and the market starts reacting to every headline with sharp wicks, that’s not normalization—it’s tension.
Disclaimer: This article is for informational and educational purposes only and does not constitute investment, legal, or tax advice. Nothing herein is a recommendation to buy, sell, or hold any asset. Digital assets are volatile and carry risk, including the risk of total loss.
Frequently Asked Questions
Is rising open interest always bullish for Bitcoin?
No. It means more futures positions are outstanding. That can support liquidity and trends, but it can also increase the probability of liquidation cascades if positioning becomes crowded.
What’s the difference between “healthy” and “unhealthy” open interest?
Healthy OI growth tends to come with stable volatility and two-sided positioning (hedging, market making, basis trades). Unhealthy growth often appears alongside rising volatility and one-sided directional leverage.
Can open interest rise while price falls?
Yes. That can happen when traders open new shorts (or longs catching a falling knife), or when hedging demand increases. The combination can signal rising disagreement—or rising stress.
What other metrics help interpret open interest?
Funding rates, liquidations, basis (futures premium), margin composition, and exchange balance changes often help determine whether OI represents hedging or speculative leverage.