Bitcoin’s 85k–92k Stalemate: What URPD Reveals About a Possible Drop to 75k
Over the past weeks, Bitcoin has been locked in a narrow band between 85,000 and 92,000 USD. Price spikes above 90k quickly meet selling pressure, while dips toward the low 80k area tend to attract buyers. From the outside this looks like a standard consolidation range, nhưng dữ liệu on-chain lại kể một câu chuyện chi tiết hơn rất nhiều.
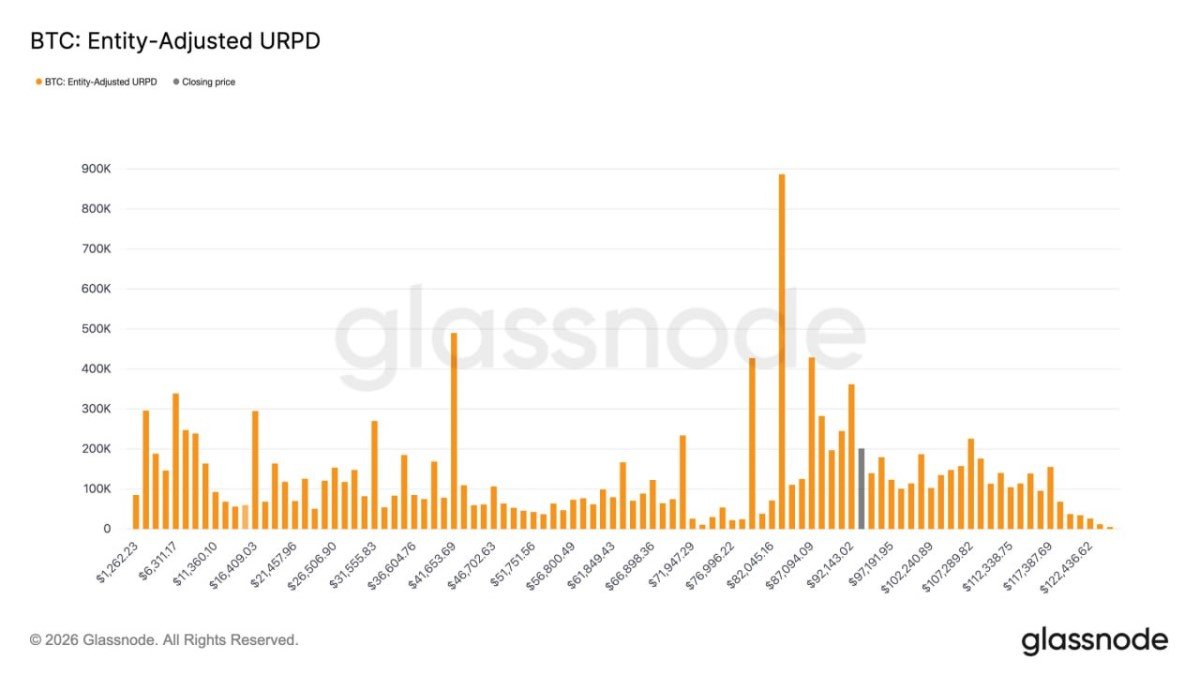
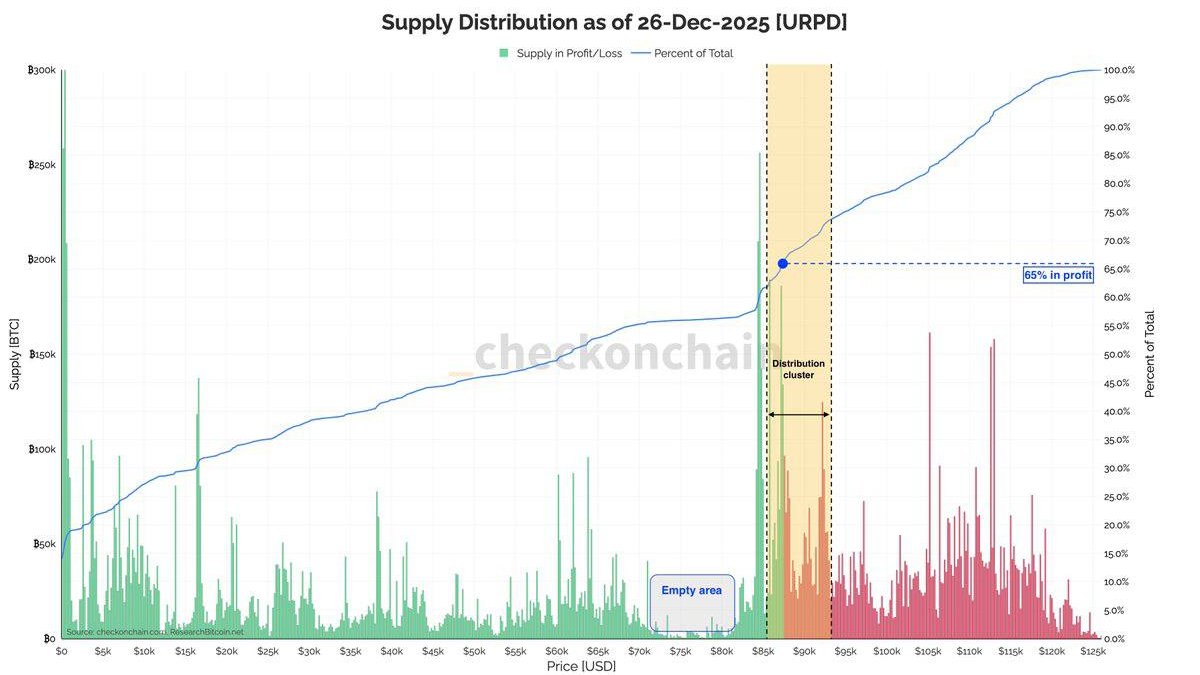
The latest URPD (UTXO Realized Price Distribution) chart shows a clear distribution cluster right inside this band. Large amounts of BTC have changed hands between 85k and 92k, turning this area into a kind of “magnet zone” where both demand and supply are heavily concentrated. At the same time, only about 65% of circulating supply is currently in profit — a relatively low figure for what many still call a bull market.
These two facts together raise an important question: is the market preparing for another leg higher, or is it quietly setting up a deeper pullback toward the 75k region to refill liquidity gaps? In this article we break down what URPD actually measures, why this 85k–92k range matters so much, and how to interpret the relatively modest share of supply in profit.
1. URPD 101: Turning History of Purchases into a Price Map
Before looking at the current situation, it is worth revisiting what URPD data represents.
• Each bar on the URPD chart shows how much BTC was last moved at a given price zone. A tall bar near 90k means a lot of coins last changed hands around that level — either through spot purchases, internal rebalancing or transfers that crystallized a new cost basis.
• Green bars typically represent supply currently in profit (coins whose last move was at a lower price than today), while red bars represent supply in loss (last moved at a higher price).
• The blue cumulative line shows what percentage of the total supply is in profit at each point on the x-axis, giving a sense of how broadly the rally has been shared.
URPD is therefore a kind of thermal camera for the market’s memory. It reveals where holders entered, where they are comfortable, and where they may start to feel pressure if price moves against them. In the current snapshot, almost all of the visual drama is concentrated in the 85k–92k band.
2. The 85k–92k Band: A Textbook Distribution Cluster
Looking at the chart, one feature stands out immediately: a dense cluster of green bars between 85,000 and 92,000 USD. This is the zone where the market has been repeatedly trading in recent weeks, and it has become a major cost-basis hub for short-term participants.
In practical terms, this band is functioning as:
- Support near 85k: many buyers who entered slightly above or below this level are inclined to defend it. When price approaches the lower boundary, dip-buying tends to appear, fueled by the idea that this zone has already “proven itself” several times.
- Resistance near 92k: the upper part of the band is where earlier buyers see a chance to realize profit or reduce risk after a volatile year. Each attempt to push through 92k triggers renewed selling from those who want to lighten exposure.
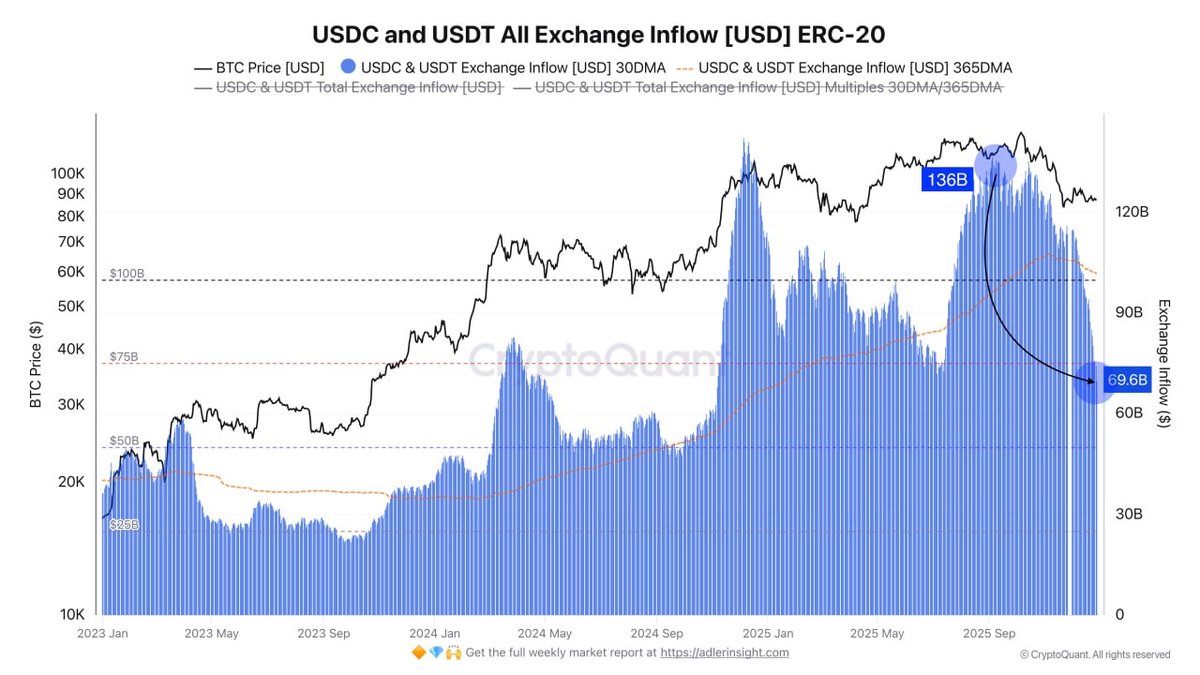
The recent modest bounce, which some observers attributed to renewed demand, coincided with large internal transfers from Binance wallets. On-chain analysts were quick to note that much of the volume was structural — movement between exchange addresses — rather than an influx of new capital. That does not invalidate the move, but it reminds us that not every price reaction is driven by fresh outside buying.
As long as most recent coins have their cost basis inside this 85k–92k distribution cluster, price will tend to stall here. To break out decisively, the market needs either a new wave of buyers willing to absorb profit-taking, or a shakeout that removes some of the weaker hands who bought the range late.
3. Only 65% of Supply in Profit: Modest for a Mature Bull Market
Another key insight from the URPD chart is that only around 65% of existing BTC supply is currently in profit. Historically, late-stage bull phases have often seen this ratio climb well above 80% and in some cycles even toward 90%, as the majority of coins appreciated strongly from their last on-chain transfer.
What does a 65% profit share imply?
• Many holders are still close to their cost basis. A sizable fraction of coins were acquired at levels not far from today’s price, including those in the current 85k–92k band and those higher up in the 100k+ region. These owners may be quick to react if the market moves against them.
• There is still a large pool of unrealized loss and break-even supply. When price revisits areas where people previously bought and then saw drawdowns, their behavior can flip from confidence to caution. That dynamic is not yet fully resolved.
• The cycle may be more mid-stage than late-stage. A mature blow-off peak tends to push almost everyone into profit for a brief period. The current configuration, by contrast, looks more like a heated but incomplete advance, where the distribution of cost bases is still quite thick near the market price.
In simple terms, the market is not stretched in the way previous absolute tops were. That cuts both ways: it suggests room for further upside later in the cycle, but it also means that a deeper correction would not be unusual in order to redistribute coins from weaker hands to stronger ones.
4. The “Empty Area” and the 75k Question
The URPD snapshot also highlights a relatively sparse region of supply just below the current range. Between roughly 75k and the low 80k area, the bars are noticeably lower. Fewer coins have their cost basis there, meaning there is less historical trading volume anchored to that zone.
These sparse regions often act like air pockets for price. When a range with heavy supply (such as 85k–92k) eventually breaks, price can move quickly through the thinner area beneath it because there are fewer cost-basis clusters where holders feel compelled to defend their entries.
This is where the idea of a move toward 75k enters the conversation. A decline into that region would serve several potential functions:
• Fill the liquidity gap. A drop into the sparse zone would allow a new wave of trading activity to occur there, turning an empty area into a fresh cost-basis band where long-term participants could accumulate.
• Test conviction of recent buyers. Many coins in the 85k–92k cluster belong to relatively new entrants. A sharp but controlled move down toward 75k would pressure them to decide whether they are truly long-term holders or simply short-term participants reacting to headlines.
• Reset leverage and short-term positioning. Even without using extreme borrowing, many traders structure their risk based on recent volatility. A swift move toward 75k would likely flush out overconfident positioning and create a cleaner base for future advances.
None of this guarantees that the market will visit 75k, but the structure of supply makes it a logical candidate for a deeper retest if the current range eventually fails.
5. Behavioral Layers: Who Holds What Around These Levels?
To understand the potential path ahead, it helps to break down the key groups involved:
5.1 Long-Term Holders (LTH)
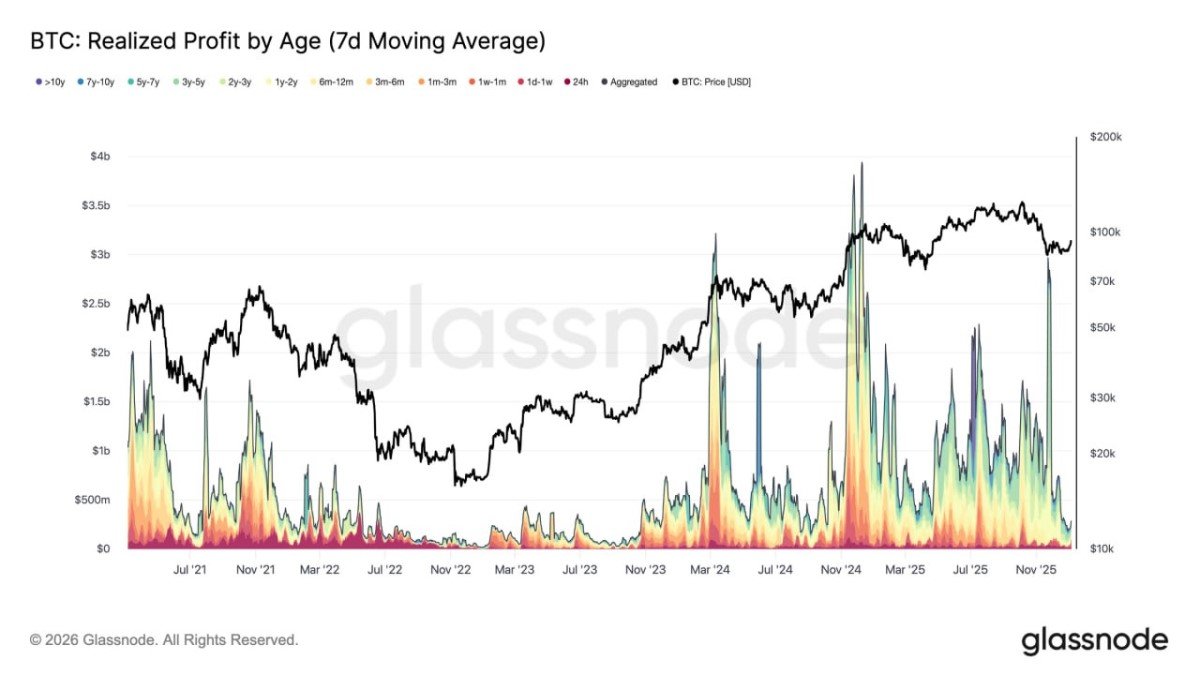
Coins that have not moved for many months tend to belong to long-term holders. Many of them accumulated in much lower regions — sub-40k, 40k–60k and the grinding consolidation zones that followed. For these participants, even an 80k or 75k price still represents substantial profit.
On-chain data over recent months has generally shown that LTH cohorts are distributing only gradually. They may sell into strength, but they are not rushing to exit. As a result, a large portion of the supply is effectively locked away unless price reaches much higher extremes.
5.2 Short-Term Holders (STH)
By contrast, short-term holders — coins that moved within the last few months — are heavily concentrated between 80k and the high 90k range. Many of them are recent buyers from the current bull wave. Their behavior is crucial for near-term volatility:
- If price holds above their cost basis, they tend to show patience or aim for higher targets.
- If price drops meaningfully below that basis, some will choose to exit to avoid further drawdown.
The combination of a dense STH cluster in the 85k–92k band and a sparse area down to 75k means that a break of 85k could quickly trigger a cascade of defensive selling. That is not inevitable, but it is the risk embedded in the current structure.
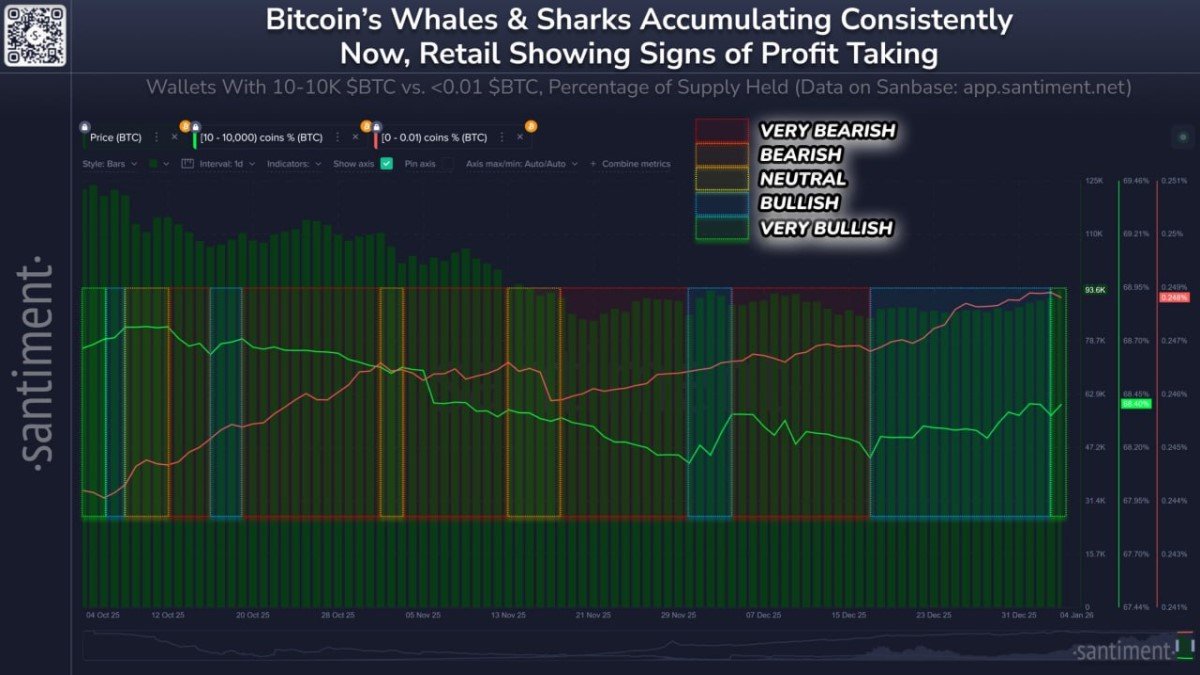
5.3 Large Entities and Exchange Flows
The recent market bounce aligned with sizeable transfers on Binance, which were primarily internal. This reminds us that headline-sized flows can be misleading if they are not placed in context. What matters is not simply how many coins move, but whether they migrate from long-term storage to exchanges (a sign of potential distribution) or in the opposite direction (a sign of accumulation or self-custody).
So far, the picture is mixed: some large entities are locking in holdings for the long term, while others periodically realize profit. The net impact is a gradual churning of supply around the current band, rather than a decisive shift in one direction.
6. Three Possible Paths from Here
Given this backdrop, how might the market evolve over the coming weeks and months? No single model can predict the exact path, but URPD data suggests three plausible scenarios.
6.1 Scenario A: Extended Range Between 85k and 92k
In this scenario, Bitcoin spends more time in the current band. Each attempt to break above 92k meets profit-taking, while dips near 85k attract buyers who missed previous entries. This would effectively convert 85k–92k into a long, grinding consolidation base.
What to watch:
- Gradual shift of coins from shorter-term to longer-term age bands, indicating that traders inside the range are maturing into committed holders.
- Stable or declining share of supply on exchanges, suggesting that holders are not preparing for large-scale distribution.
Such a range could be healthy if it resolves upward later, but it would test patience. Sentiment would likely turn cautious as other asset classes keep moving while Bitcoin appears stuck.
6.2 Scenario B: Flush to the 75k Region
Here, price eventually loses the 85k floor and slides through the thin area down toward 75k. This move could be sharp, especially if it coincides with macro headlines or a broader reduction in appetite for risk.
What this would achieve:
- Fill the empty URPD region with new trading activity, creating a fresh cost-basis band where long-term players can accumulate.
- Test and reset short-term positioning, particularly of those who bought late in the rally or relied on optimistic assumptions about straight-line growth.
- Shift more supply to strong hands if long-term participants view 75k as an attractive entry relative to their multi-year thesis.
Such a correction would feel uncomfortable, but it would not necessarily break the larger cycle. Historically, even strong bull markets have included deep pullbacks that later looked like opportunities in hindsight.
6.3 Scenario C: Break Above 92k Without a Deep Retest
The third path is that Bitcoin eventually gathers enough momentum — perhaps through macro easing, renewed institutional flows or a new narrative — to push cleanly through the 92k ceiling.
For this to be sustainable, on-chain metrics would likely need to show:
- An increase in the share of supply in profit toward 75–80%, reflecting a broader participation in the rally.
- Healthy spot demand rather than only derivatives-driven moves, so that any reversal does not immediately unwind.
- Controlled exchange inflows, indicating that large holders are not using the breakout solely as an opportunity to exit.
Even in this optimistic scenario, a later retest of the breakout area would be common. Markets rarely move in a straight line, and prior resistance often gets revisited as support.
7. Practical Takeaways for Market Participants
For individual investors and builders in the ecosystem, URPD and supply-in-profit data are most useful when they inform risk management rather than short-term predictions. A few practical points stand out:
• Recognize that the current band is crowded. A large share of recent buyers are sitting around 85k–92k. Crowded zones can produce sharp moves when sentiment changes.
• Understand your own time horizon. If your thesis spans multiple years, a potential visit to 75k may look more like volatility than a structural failure. If your horizon is short, positioning should reflect the possibility of both a breakout and a deeper correction.
• Avoid relying solely on headlines about large transfers. Always check whether flows are internal or genuine changes in ownership, and consider how they fit with broader on-chain trends.
• Do not confuse range-bound pauses with the end of a cycle. Many prior advances included long phases where price hovered below previous highs while supply quietly redistributed.
The key is to treat data like URPD as a map rather than a prophecy. It shows where risk is concentrated and where liquidity gaps might exist, but it does not dictate the exact route price will take through that landscape.
8. Conclusion: A Market in Negotiation, Not in Final Verdict
Bitcoin’s current behavior between 85k and 92k is not just a sideways chart pattern; it is a live negotiation between different groups of holders with different time horizons and levels of conviction. URPD reveals a heavy distribution cluster in this zone, a sparse area beneath it down toward 75k, and a relatively modest 65% of supply in profit.
That combination suggests a market that is neither euphoric nor exhausted. There is room for further upside if liquidity conditions improve and new demand materializes, but there is also a clear pathway for a deeper reset if the 85k support eventually gives way.
Instead of trying to guess the next few thousand dollars of price action, participants can use this information to structure portfolios with appropriate resilience: avoiding overextension, preparing mentally for both extended ranges and sharper swings, and focusing on whether their own investment thesis still holds under different scenarios.
Whatever path the market chooses, the URPD chart serves as a reminder that price is not just a number on a screen; it is anchored to a complex history of where people actually entered the market. Understanding that history turns volatility from something purely emotional into something that can be analyzed, discussed and planned for.
Disclaimer: This article is for educational and informational purposes only and does not constitute financial, investment or legal advice. Digital assets are volatile and may not be suitable for every investor. Always conduct your own research and consider consulting an independent professional before making financial decisions.