Big Perp Traders Turn Cautious While Binance Reserves Hint at the Next Bitcoin Move
Bitcoin has just come through another intense bout of volatility. Prices slid from the 91–92k region down toward 80k before bouncing, liquidating a large number of over-leveraged positions along the way. If you only looked at the daily chart, the story would seem simple: a sharp pullback after an extended advance. But when we dig into derivatives positioning and exchange reserves, the picture becomes much more nuanced.
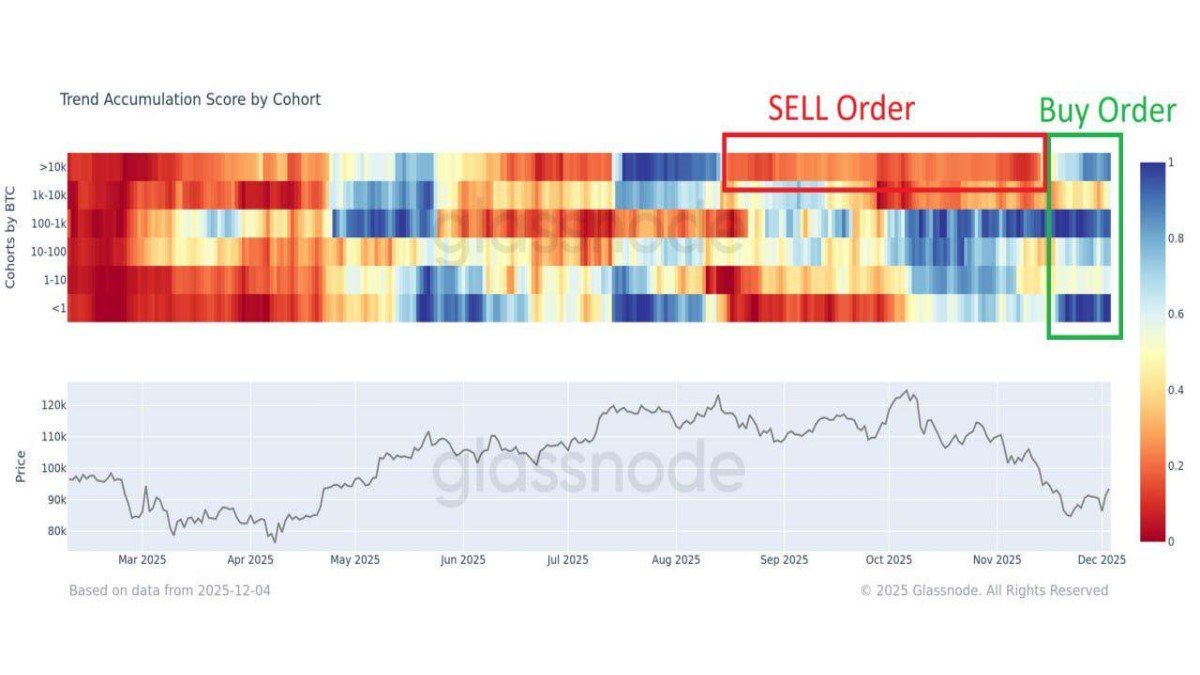
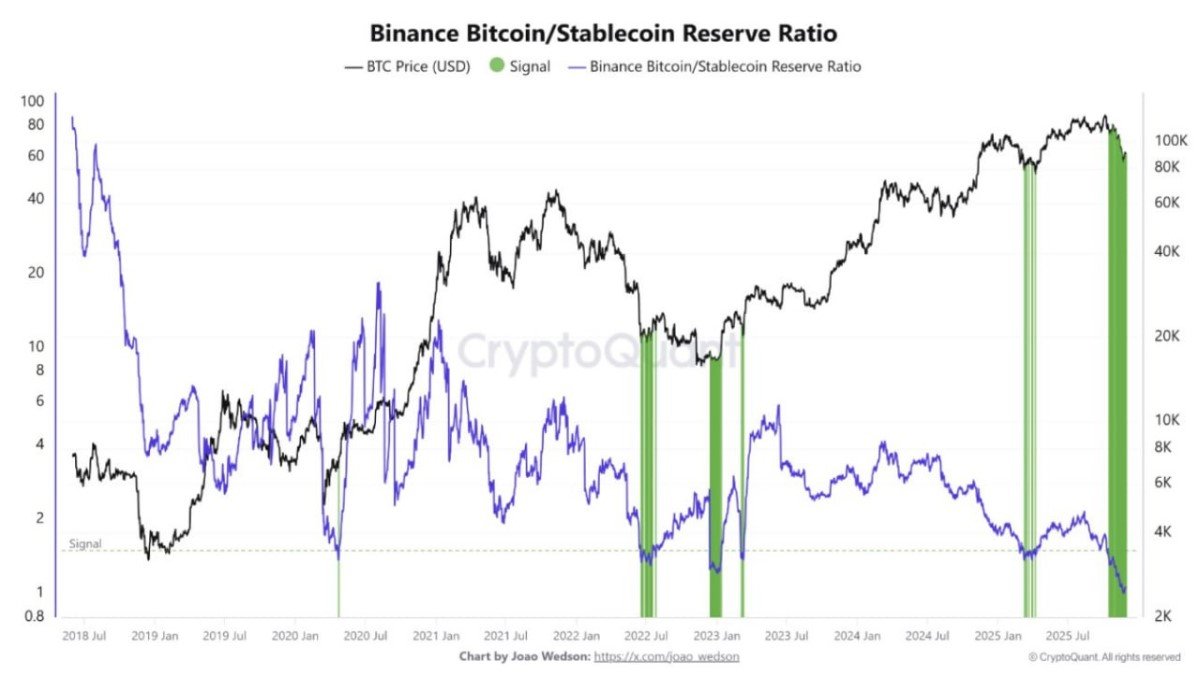
The two visuals attached to this analysis tell that story. The first is the Global Position Heatmap from Hyperliquid, which aggregates more than one hundred thousand perpetual futures accounts and segments them by cohort size. The second is a long-term chart of the Binance Bitcoin/Stablecoin Reserve Ratio, comparing how much BTC and how many dollar-pegged assets sit on the exchange over time.
On Hyperliquid, the largest cohorts have shifted from confident long exposure to a clearly more defensive stance. Meanwhile, on Binance, the reserve ratio has dropped to levels not seen since 2018. In plain language, large leveraged traders are cautious, but there is substantial stablecoin liquidity parked on the sidelines with relatively little BTC left on the exchange.
This combination often marks an important transition in the market cycle: leverage is reset, forced selling eases, and spot liquidity begins to rebuild. It does not guarantee an immediate reversal, but it changes the balance of risks in ways that are worth understanding.
1. How the Hyperliquid Global Position Heatmap Works
The Hyperliquid heatmap is designed to answer a simple question: how are different types of perpetual futures traders positioned right now? Instead of only looking at aggregate open interest, it breaks the universe of traders into cohorts based on the size of their positions.
- Smaller cohorts represent retail and modest-sized accounts.
- Whales typically refer to accounts with mid-seven-figure exposure.
- Leviathans are the largest players on the platform, with open interest above roughly five million dollars.
Each row in the heatmap corresponds to an asset (BTC, ETH, SOL, and so on), and each column corresponds to a cohort. The colour gradient runs from red (short bias) through neutral shades to green (long bias). By scanning the grid, you can see at a glance whether large traders are leaning in the same direction as retail, or whether there is a split in sentiment.
In quiet markets, the grid often looks fairly balanced: mild long or short bias scattered across assets with no strong theme. During stress, however, the pattern changes dramatically. Large cohorts can quickly pivot, and when they do, it tends to leave a clear visual imprint.
2. What Large Traders Are Doing Now
In the weeks leading up to Bitcoin’s recent local high near 91–92k, the heatmap showed whale and Leviathan cohorts predominantly long BTC. That alignment made sense. The broader trend was still up, and many large accounts were positioned to benefit from continued strength.
As price tapped the upper band of that range, the first subtle shift appeared. Whales began to reduce their net long exposure, moving toward a more neutral stance. Leviathans, while still constructive, were no longer adding to longs with the same enthusiasm. This was an early hint that sophisticated traders were de-risking even before the headline pullback.
Then came the sharp downside move. Over a short window, the heatmap flipped. Leviathan cohorts in particular rotated into a short-leaning posture, either by actively opening directional shorts or by using futures to hedge spot holdings and other exposures. Whales were less extreme but still clearly more defensive than before. Rather than betting aggressively on a fast recovery, these large traders opted for protection.
An interesting detail is that while their BTC stance cooled, risk appetite did not disappear entirely. The same dashboards show that these cohorts have been gradually adding long exposure in ETH perpetuals. In other words, some capital is rotating from Bitcoin into Ether rather than exiting the crypto complex altogether. That kind of selective positioning is typical of a maturing phase in the cycle: traders stop buying everything and instead look for relative value between majors.
3. Support Near 80k: The Role of Spot Buyers
While leverage was being unwound on Hyperliquid and other derivatives venues, spot markets told a slightly different story. As BTC dipped into the 80k region, order-book data and on-chain metrics show a wave of buyers stepping in. Many participants treated that area as a strategic level for adding exposure after several weeks of grinding downside.
The result is that the 80k zone now looks like a provisional support band. It is not an unbreakable floor—no level ever is—but it is a region where the market has already proven willing to absorb significant supply. The fact that this support formed while large leveraged traders were cautious is noteworthy. It hints that a different cohort, likely longer-horizon participants with less leverage, is quietly accumulating while derivatives remain in risk-off mode.
That split between derivatives and spot is important. When the only demand comes from highly leveraged long positions, the market is vulnerable to cascading liquidations. When support is built instead by spot buyers with lower leverage, drawdowns can still happen but the likelihood of forced selling spirals is reduced.
4. Understanding the Binance Bitcoin/Stablecoin Reserve Ratio
The second chart takes us from derivatives to exchange reserves. The Binance Bitcoin/Stablecoin Reserve Ratio compares the amount of BTC held on Binance to the amount of dollar-denominated stablecoins such as USDT and USDC on the same platform. Conceptually, it looks like this:
Reserve Ratio = BTC Reserves / Stablecoin Reserves
When the ratio is high, Binance holds relatively more BTC and fewer stablecoins. When it is low, there is a large pool of potential buying power (stablecoins) compared with the amount of BTC currently sitting on the exchange.
Several broad regimes show up on the chart:
- Early accumulation phases, where stablecoin balances rise as participants deposit fresh capital in preparation for buying.
- Late-cycle euphoria, where BTC holdings swell as traders move coins onto the exchange to take profits or trade more actively.
- Post-correction rebuilds, where BTC reserves decline (as coins move to cold storage or other venues) while stablecoin balances remain elevated.
The current reading sits at the lowest level since 2018, highlighted on the chart by a dense green band. That means that, relative to the amount of stablecoins parked on Binance, there has rarely been so little BTC available on the exchange.
5. Why a Low Reserve Ratio Often Precedes Strong Upside
At first glance, a low BTC balance on an exchange might sound concerning. After all, if fewer coins are available, does that not mean interest is waning? In practice, the dynamic is more subtle.
When participants feel deeply pessimistic, they often move coins off exchanges into self-custody, signalling a preference for long-term holding rather than frequent trading. At the same time, other participants deposit stablecoins instead of BTC, choosing to wait in a neutral asset until conditions look more attractive. The net effect is a low reserve ratio: plenty of purchasing power in stable form, but comparatively little BTC sitting in hot wallets ready to be sold.
Historically, these conditions have often preceded strong upward phases in the Bitcoin market. The mechanism is straightforward:
- A shift in sentiment, macro conditions or narratives encourages sidelined capital to redeploy.
- Stablecoins on Binance are converted to BTC, but the thin on-exchange supply means even moderate buying imbalances can move price quickly.
- As price rises, some holders transfer coins back to the exchange to realise profits, but early moves are often dominated by buyers rather than sellers.
The green bands on the chart mark previous occasions when the reserve ratio was similarly depressed. While every cycle is different, many of those bands align with periods in which Bitcoin either formed a long-term base or began a strong advance.
It is crucial to stress that the ratio is not a timing tool. It does not say when exactly a new uptrend might start, only that the structural conditions—ample stablecoin liquidity and limited readily available BTC—are consistent with the kind of environment in which sharp upside moves have occurred in the past.
6. Reconciling Cautious Derivatives With Strong Potential Liquidity
At first glance, there seems to be a contradiction. Hyperliquid’s largest traders are biased short or at least heavily hedged, yet Binance’s reserve data points to a market where potential buyers have plenty of dry powder. Which one is “correct”?
The answer is that they are looking at different dimensions of the same system.
- Leviathan and whale cohorts are primarily managing leverage. Their short positions may be outright bearish bets, but in many cases they function as hedges against spot holdings or structured products. Their main concern is protecting capital through volatile periods, not necessarily calling the exact bottom.
- Stablecoin reserves reflect optionality. The owners of those assets are not forced to act. They can wait as long as they like, but when they decide to re-enter, they can do so quickly and at size.
Viewed together, the picture looks less like a contradiction and more like a reset. Leverage has been reduced, many of the most aggressive long positions have been unwound, and a sizeable amount of purchasing power has accumulated in neutral assets. In that kind of environment, new information—whether a favourable macro development, a regulatory breakthrough or a technological milestone—can have an outsized impact because the market is both lighter (less over-leveraged) and more liquid (more stablecoins ready to deploy).
7. Possible Scenarios From Here
With that framework in mind, a few broad scenarios stand out for the weeks ahead. None of them is guaranteed; the goal is not prediction, but structured thinking.
Scenario A: Gradual Rebuild and Range Trading
In this scenario, Bitcoin continues to oscillate around recent levels, perhaps revisiting the 80k support band while occasionally testing higher ranges. Leviathan cohorts maintain partial hedges, adding and trimming short exposure as volatility shifts. Stablecoin reserves stay high, but their owners are in no rush to fully re-enter. Over time, realised volatility declines and the market builds a more solid base.
Scenario B: Short Squeeze on Positive News
A favourable catalyst—such as improved clarity on interest-rate policy or a strong wave of institutional inflows—could push price through a level that many shorts consider important. If that happens while the reserve ratio remains low, new buying from stablecoins plus forced covering of short positions can combine to drive a powerful advance. The heatmap would show Leviathan rows flipping from red toward green as hedges are closed and new longs are opened.
Scenario C: Another Down-Leg Before Stabilisation
It is also possible that macro conditions deteriorate again or that a negative event temporarily overwhelms existing support. In that case, Bitcoin could retest or even briefly undercut the 80k area. The key question in such a scenario would be whether stablecoin reserves stay high—indicating patient capital still waiting—or whether they begin to flow out of the ecosystem altogether.
In all three cases, the combination of cautious derivatives positioning and high stablecoin balances means that the market is less stretched than it was at the recent peak. That does not remove risk, but it changes its shape: from the danger of a crowded, over-leveraged long side to the more typical uncertainty of a market searching for its next narrative.
8. Practical, Brand-Safe Takeaways for Readers
For everyday participants who are not running multi-million-dollar books on Hyperliquid, how should these metrics be used?
1. Think in terms of context, not instructions. The heatmap and reserve ratio help describe how different groups are positioned. They are not signals telling you what to do. Treat them as weather reports rather than as GPS directions.
2. Recognise the difference between leverage and spot. Large perpetual futures traders can change their stance quickly because they are managing margin and risk limits. Long-term investors with spot holdings behave differently. Understanding which cohort you belong to helps you interpret these charts more appropriately.
3. Support zones are areas, not precise lines. The 80k region has shown evidence of buying interest, but exact levels can vary across exchanges and time frames. Building a plan around ranges rather than single numbers is usually more resilient.
4. Liquidity on exchanges can amplify moves. A low reserve ratio means that if sentiment turns positive, price can move faster because there are fewer coins immediately available. That is a reason to be aware of volatility, not a guarantee of a specific direction.
5. Risk management still comes first. No metric removes the need for diversification, position sizing, and an honest assessment of your own time horizon and tolerance for drawdowns. Data is most useful when it helps you avoid emotional decisions, not when it tempts you to over-commit.
9. Conclusion: A Market Reset, Not a Simple Top or Bottom
The latest readings from Hyperliquid and Binance point to a Bitcoin market that has shed much of its excess leverage while quietly accumulating potential buying power. Leviathan and whale cohorts have shifted into a more cautious stance, using shorts and hedges to protect capital after a steep pullback from the highs. At the same time, Bitcoin’s reserve ratio on Binance has fallen to multi-year lows, indicating that many coins have left the exchange while stablecoin balances—and thus optionality—remain high.
Whether this configuration ultimately resolves into a renewed advance, an extended consolidation, or another down-leg will depend on forces that lie beyond any single dashboard: macroeconomic data, regulatory developments, technological progress and the evolving preferences of investors worldwide. What the data does offer is a clearer view of the current landscape. The most aggressive phase of forced selling appears to be behind us, leverage is reset, and liquidity is sitting on the sidelines waiting for its next cue.
For analysts and investors alike, this is an invitation to stay curious, to integrate multiple sources of information, and to keep risk management at the centre of any decision. Market structure metrics are powerful tools when used thoughtfully, and they are most valuable in exactly the kind of environment we see today: one where the noise of day-to-day price moves can obscure the deeper shifts happening beneath the surface.
Disclaimer: This article is for informational and educational purposes only. It does not constitute financial, investment, legal or tax advice, and it should not be interpreted as a recommendation to buy, sell or hold any asset. Digital asset markets are volatile and carry significant risk, including the possibility of total loss. Readers should conduct their own research and consider consulting a qualified professional before making any financial decisions related to cryptocurrencies or other financial instruments.