Bitcoin Whales Slow Down on Binance: What a 50% Drop in Inflows Really Means
When the market focuses on price alone, it is easy to miss the structural shifts happening behind the candles. One of the clearest examples right now comes from on-chain data that tracks whale inflows into Binance, the largest spot and derivatives venue for Bitcoin.
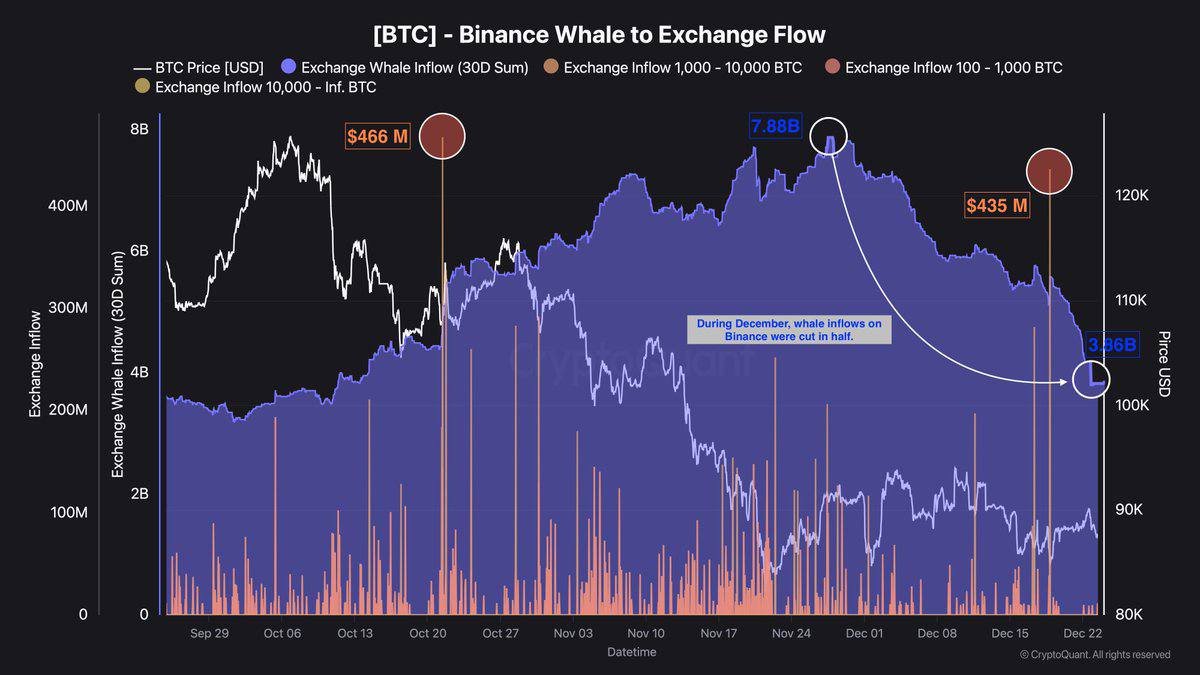
Over the past month, the 30-day sum of whale deposits on Binance has dropped from around $7.88 billion to $3.86 billion. In other words, the amount of Bitcoin that large holders are sending to this single exchange has been cut roughly in half in just a few weeks.
At first glance, that sounds like pure good news for bulls: fewer coins arriving on a major exchange means less immediate potential sell pressure. Yet the picture is more nuanced. The same data set also highlights a series of isolated spikes—around $466 million and $435 million in single bursts—originating from addresses holding between 100 and 10,000 BTC. These occasional waves remind us that whales may be quieter, but they are not gone.
This article examines what the slowdown in whale inflows could mean, why it matters for Bitcoin’s short-term balance of risk, and how long-term participants can interpret the signal without overreacting to any single metric.
1. Reading the Chart: What the Numbers Actually Show
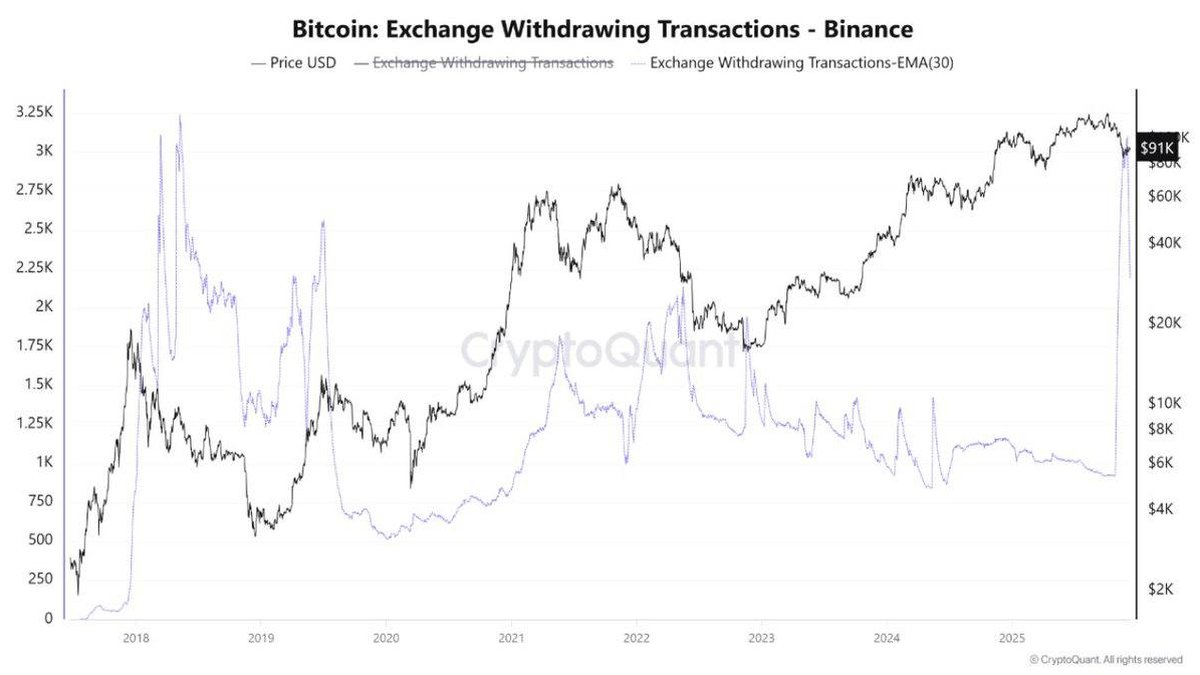
The chart behind this discussion plots three core elements:
- The Bitcoin price in USD, shown as a white line.
- The 30-day summed inflows of whale deposits to Binance, represented by the large blue area. This aggregates all transfers to Binance from large addresses (typically 1,000+ BTC) over the last 30 days.
- Individual deposit events from different whale size bands—for example, wallets holding 100–1,000 BTC or 1,000–10,000 BTC—visualized as vertical bars.
Two elements stand out immediately:
- During the previous distribution wave, the 30-day whale inflow metric climbed toward $7.88 billion, signaling heavy deposits onto the exchange.
- By late December, this figure had collapsed to roughly $3.86 billion, a decline of about 50%, even though the price remained elevated relative to earlier in the year.
In between, we see sharp individual spikes of hundreds of millions of dollars in deposits—most notably around $466 million and $435 million. These spikes correspond to large entities transferring substantial amounts of BTC to Binance within a short time frame.
So we are not observing a situation where whales have vanished entirely. Instead, we see a lower baseline of selling potential punctuated by occasional high-impact events.
2. Why Whale Inflows to Exchanges Matter
On-chain inflows from large holders receive attention for a simple reason: coins that arrive on exchanges become easier to sell. While not every deposit results in an immediate market order, the probability that the coins are being prepared for trading, hedging, or rebalancing is significantly higher than for coins held in cold storage.
In general:
- Rising whale inflows often coincide with distribution phases, where large holders lock in profits or de-risk exposure.
- Falling whale inflows tend to align with consolidation or renewed accumulation, especially when combined with declining balances on exchanges overall.
However, there are important nuances that keep this from being a simple one-indicator timing tool:
- Whales may deposit BTC to provide collateral for derivatives, not necessarily to sell spot holdings outright.
- Some inflows represent internal reshuffling between wallets and exchanges, although good on-chain labeling attempts to reduce this noise.
- Large entities may use over-the-counter (OTC) desks or other venues that do not show up in simple spot exchange inflow metrics.
Because of these factors, whale inflow data is best used as a context signal rather than a direct trading instruction. It can indicate whether the environment is structurally heavy with potential sell-side supply or, conversely, relatively constrained.
3. December’s 50% Decline: What Could Be Driving It?
The core observation is straightforward: in a matter of weeks, the 30-day sum of whale inflows to Binance has fallen by about half. Several factors could be contributing to this shift.
3.1 The most aggressive profit-taking wave may be behind us
Earlier in the cycle, whales who accumulated at much lower levels had powerful incentives to realize gains. Strong price advances offer an opportunity to rebalance portfolios, pay down liabilities, or diversify into other assets.
As those large tranches of realized profit are digested, the marginal willingness to sell at current prices may decline. Whales who intended to de-risk have already done so, while those remaining are more inclined to hold or allocate elsewhere in the ecosystem.
This is consistent with a transition from a phase dominated by aggressive distribution to one where the market is attempting to find a new equilibrium between long-term holders and new entrants.
3.2 More coins may be moving into long-term storage or staking-related use
Another explanation is that a larger share of BTC is now being held in custodial solutions, multi-signature setups, or yield-generating products rather than being actively traded on exchanges. As the asset matures, long-term institutional and corporate holders often prefer specialized custody or structured products over keeping large balances on trading platforms.
Even though Bitcoin itself does not have native staking, derivatives, hedging products, and yield-bearing instruments (for example, in combination with dollar-denominated assets) can influence where coins sit at any given moment. The more that long-term capital chooses to park assets away from spot exchanges, the lower the immediate inventory available to hit bids during stress events.
3.3 Growth of alternative venues and OTC channels
A third possibility is that some trading activity has migrated toward OTC desks, liquidity providers, or jurisdiction-specific platforms. These flows are less visible in standard on-chain exchange metrics. As ETF products, structured notes, and other regulated wrappers expand, a portion of large trades may be internalized in these vehicles rather than being routed directly through public order books.
In that context, the decline in whale inflows to Binance may reflect both reduced immediate selling interest on that particular venue and a broader redistribution of liquidity across the ecosystem.
4. The Significance of Sudden $400M+ Inflows
The more encouraging macro signal—falling whale inflows overall—should not obscure the risk posed by isolated high-magnitude deposits. The chart highlights at least two clear examples where roughly $466 million and $435 million worth of BTC arrived on Binance over a short period, sourced from wallets holding between 100 and 10,000 BTC.
Why do these events matter?
- They prove that substantial sell-side capacity still exists. A single entity or a small cluster can materially influence intraday order books if they choose to execute aggressively.
- They can trigger or amplify liquidations in derivatives markets when price moves quickly, even if the broader trend is constructive.
- They often coincide with key psychological levels or macro headlines, acting as the catalyst for sharp moves that appear sudden to those not watching on-chain data.
Importantly, a large inflow does not automatically mean that the entity intends to market sell everything. Whales may be:
- Rebalancing between spot and derivatives positions.
- Preparing collateral for hedging strategies.
- Transferring coins for operational reasons such as lending or internal treasury needs.
Nevertheless, risk-aware participants treat such spikes as moments of elevated uncertainty. When hundreds of millions of dollars in BTC are parked on an exchange, the market becomes more sensitive to sudden shifts in order-flow.
5. What the Slowdown Means for Short-Term Market Structure
Combining the reduced baseline inflow with intermittent spikes yields a mixed but informative picture for short-term dynamics.
5.1 Reduced constant sell pressure
With the 30-day inflow metric down ~50%, the background availability of whale-controlled coins on Binance is clearly lower. That tends to support:
- Less persistent ask-side liquidity from large holders who previously sold into every rally.
- Greater sensitivity to net spot buying from smaller traders and longer-term accumulators; in other words, positive demand shocks may have more price impact.
- Potentially faster recoveries after local drawdowns, since there is less supply waiting to sell every bounce.
5.2 Volatility can still flare up
However, the presence of large, irregular deposits implies that volatility is not going away. Instead of being dominated by continuous heavy selling from whales, the market is shifting toward a pattern where periodic events—large deposits, macro headlines, funding shifts—create sharp but shorter episodes of stress.
For traders, this means that risk management should focus less on the assumption of a one-way grind down and more on the possibility of sudden swings in both directions. For investors, the key message is that lower whale inflows improve the medium-term supply picture but do not eliminate the need for patience and psychological resilience.
6. Longer-Term Context: Are Whales Quietly Accumulating Again?
Zooming out, a decline in exchange inflows often shows up near the transition between profit-taking and renewed accumulation. After a strong run-up, coins flow from long-term holders to new buyers until much of the latent selling pressure is absorbed. If price holds near higher ranges while inflows drop, it suggests that the market is gradually adjusting to a new reference level.
Several broader forces support this interpretation:
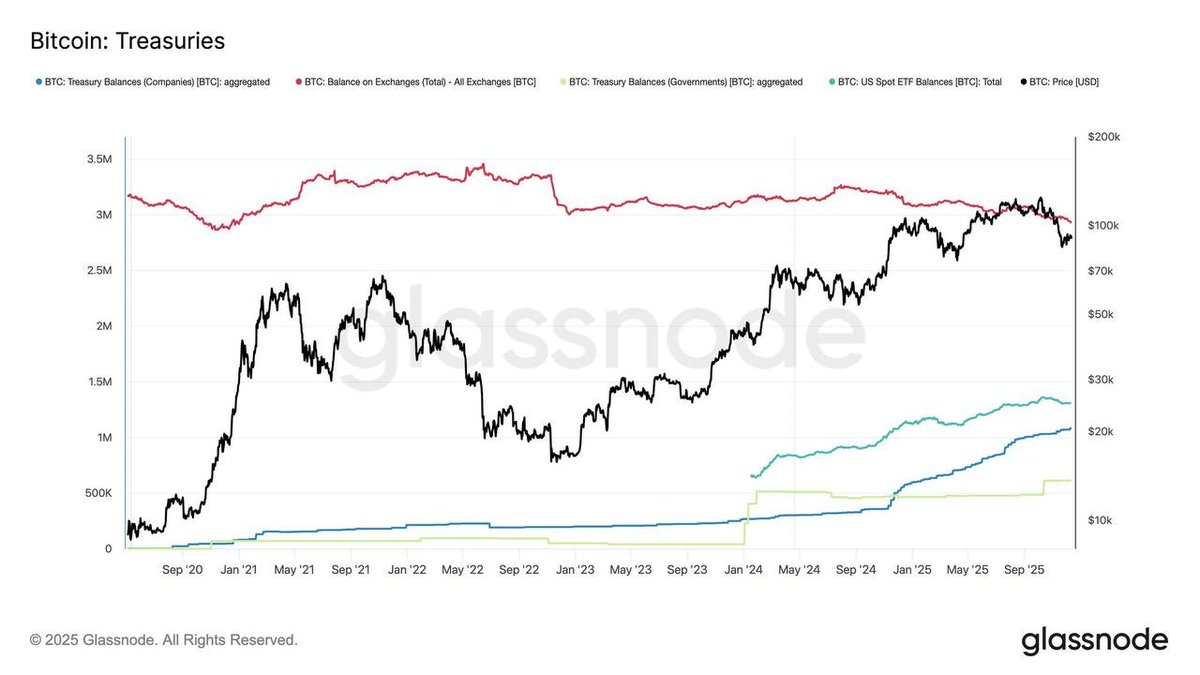
- Institutional vehicles such as ETFs and listed companies continue to accumulate, creating a steady bid for circulating supply.
- Long-term holder metrics often show relatively little distribution compared with previous cycle tops, implying that a substantial share of coins remains in strong hands.
- Exchange reserves across multiple platforms have trended downward over multi-year horizons, indicating that more BTC is migrating to long-term storage or structured products.
If this pattern persists, the current environment may resemble earlier consolidation phases where prices oscillated but the underlying ownership structure quietly shifted toward long-term participants. In such phases, whale inflows to exchanges tend to remain suppressed for extended periods, punctuated by occasional spikes that drive short bursts of volatility without necessarily changing the overarching trend.
7. How to Use Whale Inflow Data Responsibly
Given the richness of modern on-chain analytics, it is tempting to treat each metric as a predictive signal. A more sustainable approach is to see these data points as context for risk management and narrative building, not as automatic triggers.
When evaluating whale inflows, consider the following guidelines:
• Look at trends, not single days. A one-off spike may or may not matter; a multi-week decline in aggregate inflows carries more weight.
• Combine inflow data with exchange balances, derivatives positioning and macro conditions. For example, low whale inflows plus falling exchange reserves and moderate funding rates paints a different picture than low inflows combined with overcrowded leverage.
• Distinguish between structural and tactical behavior. Structural shifts—such as a multi-month migration of coins to cold storage—often align with long-term themes. Tactical moves—like a sudden $400 million deposit—are more about short-term volatility.
• Avoid binary interpretations. Declining whale inflows do not guarantee higher prices; they simply reduce one source of potential immediate selling pressure.
In practice, the most valuable role of whale data is to help participants assess asymmetry: is the market currently set up so that negative news might trigger an avalanche of supply, or has much of the easy selling already taken place?
8. A Quieter Ocean, but Not a Calm One
The key takeaway from the recent data is that whale inflows to Binance have slowed dramatically, dropping by around half from their recent peak. This likely reflects a combination of reduced profit-taking, growing use of alternative venues and custody solutions, and a gradual shift of BTC from trading inventory into longer-term holdings.
At the same time, large, sudden deposits worth hundreds of millions of dollars still appear, reminding the market that big players retain the capacity to move prices quickly when they choose. The ocean is quieter, but there are still waves.
For long-term participants, the current configuration looks more constructive than earlier in the year: less constant sell pressure from whales on the largest exchange and a market that is trying to stabilize around a higher price range. For shorter-term traders, the message is more balanced: respect the improving structural backdrop, but do not underestimate the impact of isolated whale moves, especially in an environment where liquidity can thin out during holidays and macro events.
Ultimately, on-chain metrics such as whale inflows are best seen as tools for understanding how different groups of holders behave, rather than as precise forecasts. The recent halving of whale deposits on Binance tells us that one important group is less eager to offload supply at current levels. How the market chooses to build on that foundation will depend on macro conditions, policy developments and the collective sentiment of millions of smaller participants.
Disclaimer: This article is for educational and informational purposes only. It does not constitute investment, financial, or legal advice. Digital assets are volatile and can involve significant risk, including the possible loss of principal. Always conduct your own research and consider consulting a qualified professional before making financial decisions.