Bitcoin Whales Refuse to Sell While Price Slides: What Ultra-Low CDD Is Telling Us
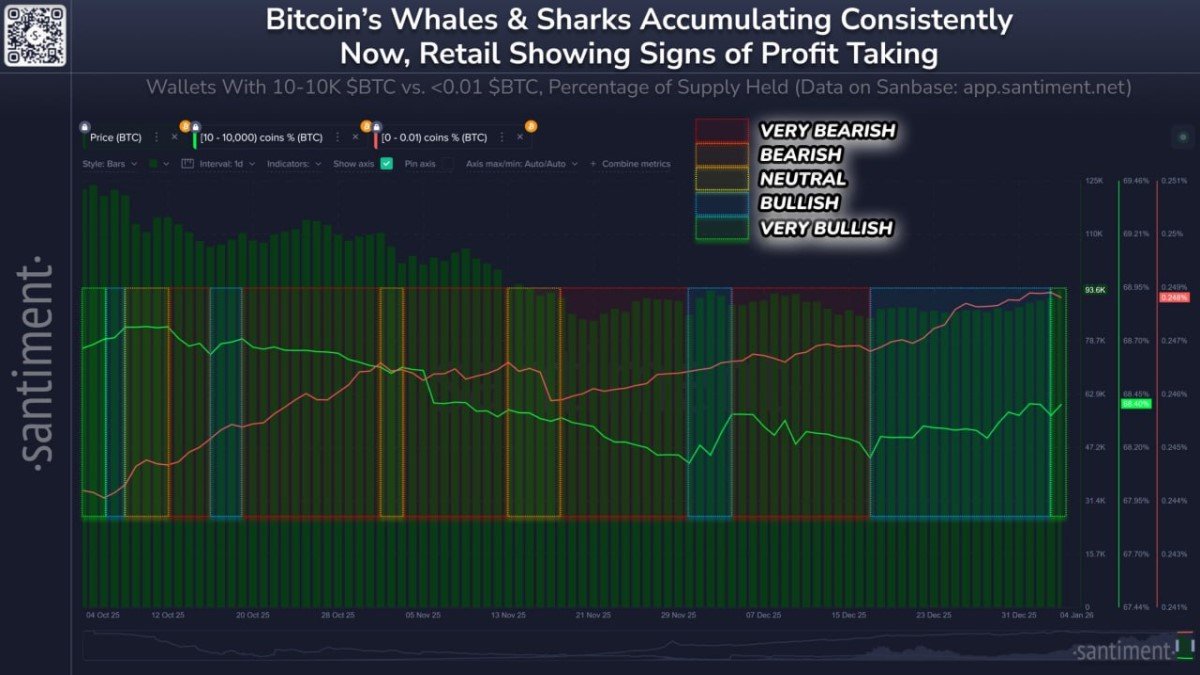
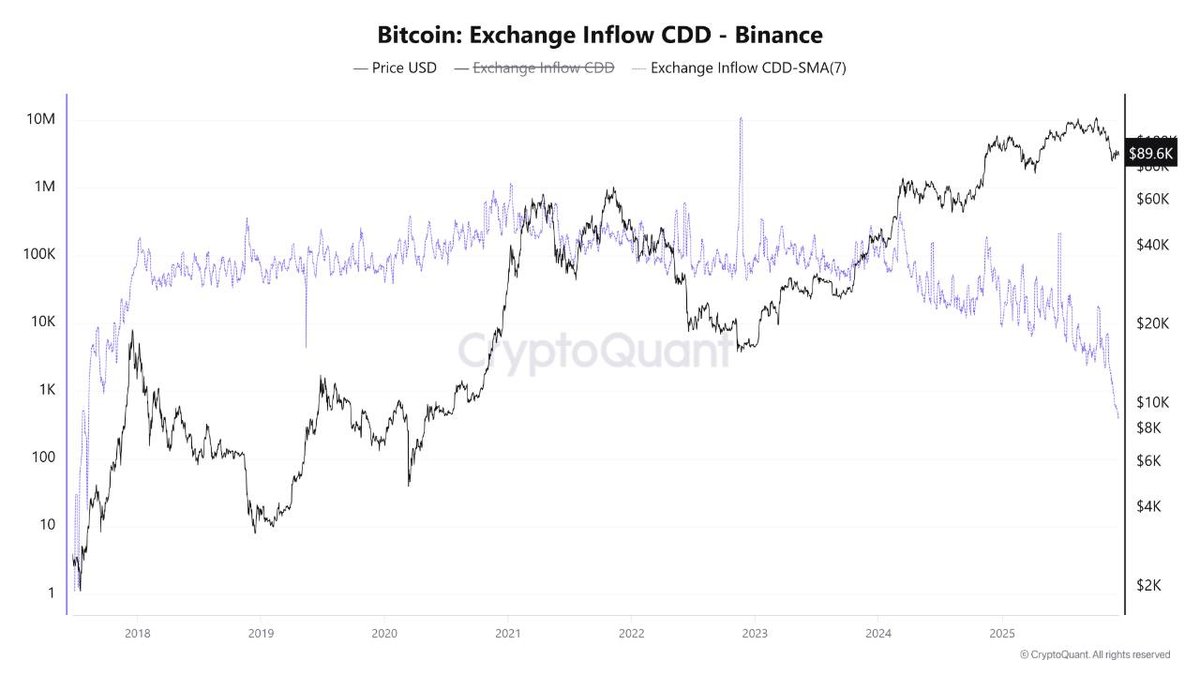
Bitcoin is back in an uncomfortable place for many investors: the price has pulled down toward the 90,000 USD area, social sentiment looks fragile, and headlines are once again asking whether the cycle is over. But under the surface, on-chain data is painting a very different picture. One of the most important metrics, Exchange Inflow CDD on Binance, has quietly fallen to its lowest level in roughly seven years.
In simple terms, that means the coins being sent to Binance today are – on average – much younger than usual. The older, deeply profitable Bitcoin held by long-term investors is not being transferred to the exchange in size. The sell pressure we are seeing at current prices is coming mostly from short-term participants rather than the whales and long-term holders who anchor each cycle.
This divergence between price and behaviour is exactly the type of signal that tends to appear in the late stages of a drawdown or consolidation phase. It does not guarantee that the market will immediately rebound, but it helps us answer a crucial question: who is actually selling here?
1. What Is Exchange Inflow CDD and Why Does It Matter?
To understand why this metric is important, we need to unpack two ideas: Coin Days Destroyed (CDD) and exchange inflows.
1.1 Coin Days Destroyed: Volume Weighted by Time
Every Bitcoin accumulates 'coin days' while it sits still in a wallet. If you hold 1 BTC for 100 days, you have 100 coin days. When that coin finally moves on-chain, those 100 coin days are considered destroyed. This gives us a way to quantify not just how much BTC moved, but also how old that liquidity was.
Traditional volume metrics treat 0.1 BTC moved after one day the same as 0.1 BTC moved after ten years. CDD does the opposite: it amplifies the movements of older coins. A small transfer from a long-dormant whale wallet can create a much larger spike in CDD than millions in short-term trading.
1.2 Exchange Inflow CDD: The Supply Side of Sell Pressure
When we focus specifically on exchange inflow CDD, we look at how many old coin days are being sent from personal wallets to trading platforms like Binance. Historically, large spikes in this metric often precede or accompany periods of heavy profit-taking:
- Long-term holders send coins to exchanges.
- Those coins become available for sale.
- The market must absorb that supply, often at premium prices near local peaks.
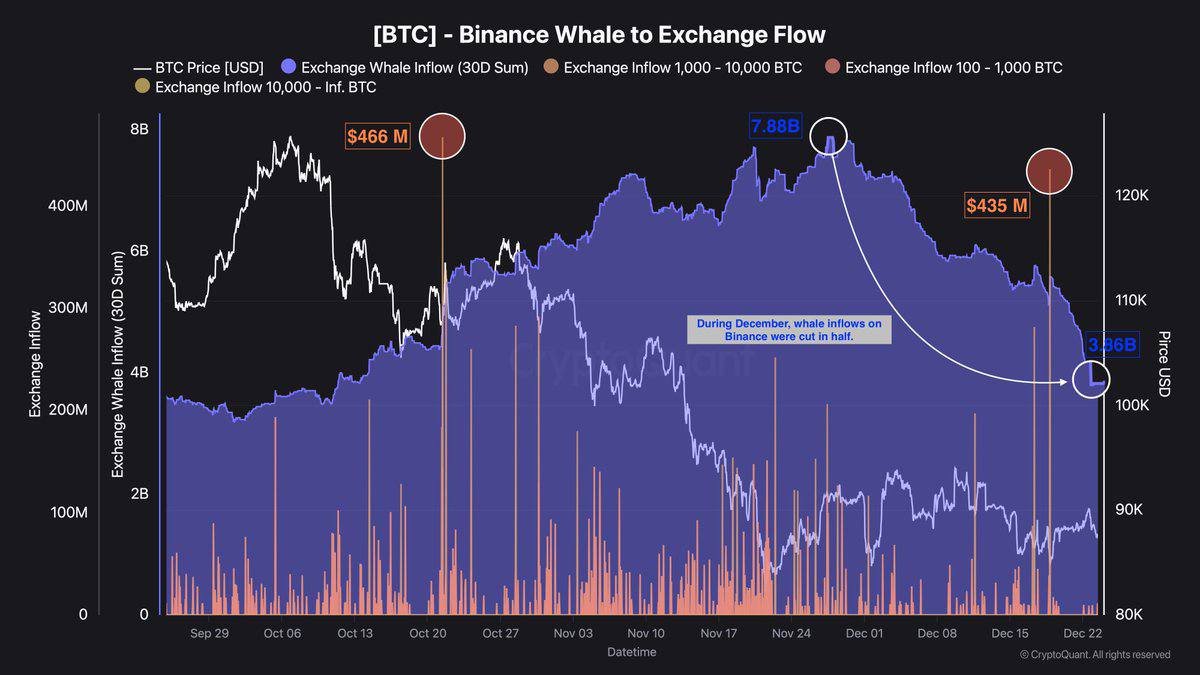
The opposite is also true: when exchange inflow CDD collapses, it means the very same long-term holders are choosing not to send coins to exchanges, even as prices move against them. That is exactly what the latest chart for Binance is telling us.
2. A Seven-Year Low in CDD: What Are Whales Signaling?
The current reading is remarkable. While Bitcoin has corrected back to the 90k region, exchange inflow CDD on Binance is near its lowest level since 2018. In plain English:
- Whale and long-term holder activity toward the exchange is extremely subdued.
- Most coins currently moving onto Binance are relatively young and likely belong to short-term traders.
- There is no sign of broad, panic-driven distribution from old hands.
This type of on-chain behaviour fits a well-known pattern across previous cycles:
- Early in a bull market, long-term holders occasionally take profits but mostly remain patient as price discovers higher ranges.
- Near the euphoric peak, exchange inflow CDD tends to spike sharply, as even the most stubborn holders begin to trim positions.
- During subsequent drawdowns, short-term holders panic sell while long-term holders gradually revert back to accumulation or inaction.
The interesting aspect of the current environment is that we are seeing step 3 – short-term stress, long-term patience – without clear evidence of the classic CDD spike that usually marks a final blow-off top. That leaves room for two very different, but equally plausible interpretations.
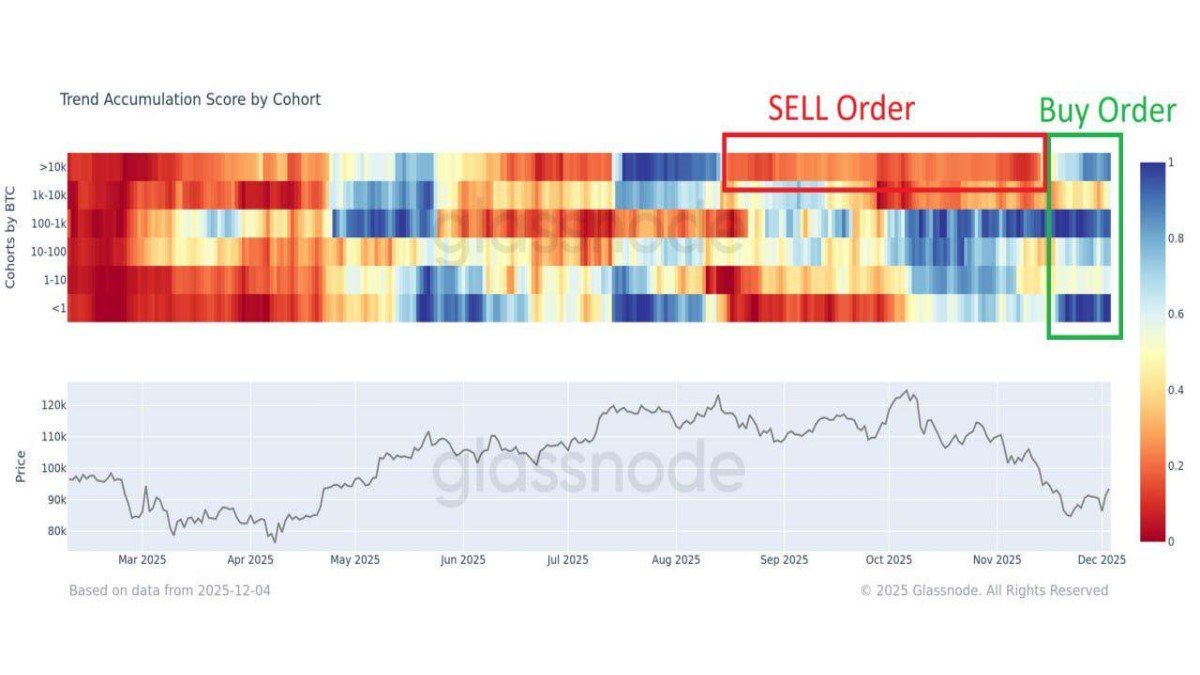
- Scenario A: Late-cycle digestion – The market already registered a soft top without the type of extreme distribution seen in previous cycles. Whales, having sold earlier via OTC or ETF channels, now prefer to hold what remains, while the market searches for a sustainable floor.
- Scenario B: Mid-cycle pause – Long-term holders are simply refusing to sell at current prices because they believe the fair value of BTC in this cycle lies much higher. In this case, the lack of whale selling becomes latent fuel for a later expansion phase.
In both scenarios, the message is the same: the dominant supply overhang being digested today does not come from long-term whales. It comes mainly from newer participants reacting to volatility.
3. Short-Term Holders Are Driving the Current Drawdown
If whales and early-cycle buyers are not the ones pressing the sell button, who is? The answer lies in the structure of short-term holdings.
On-chain data shows a significant cluster of coins that were acquired in the 95k–110k USD range – essentially, the cohort that entered during the late stages of the most recent uptrend. When price fell back toward 90k, this group moved from unrealized profit into unrealized loss. That shift tends to change behaviour quickly:
- Short-term holders are more sensitive to headlines and day-to-day price moves.
- They are more likely to use leverage and to manage positions based on fixed price levels.
- They often have less conviction in the long-term thesis, as their decision was driven by momentum rather than foundational belief.
As a result, even a moderate pullback can trigger stop-losses, forced unwinds, or voluntary exits from this group. Combined, these actions generate visible but shallow sell pressure – enough to push the market from 100k toward 90k, but not necessarily enough to break the structural uptrend, unless macro conditions turn sharply worse.
The absence of high CDD inflows means this sell pressure is finite. Once the majority of recent entrants finish de-risking, the order book begins to dry up on the supply side. At that point, even modest new demand can cause outsized price reactions, because there simply are not many coins being offered for sale.
4. The 84k–98k Range: A Compression Zone for the Next Move
From a purely structural perspective, Bitcoin currently trades inside a relatively tight band between 84,000 USD and 98,000 USD:
- The 90k area has become the centre of gravity, a zone of repeated tests where buyers and sellers are still negotiating direction.
- If 90k decisively breaks lower and fails to reclaim quickly, the next logical demand area sits around 84k, where on-chain realized prices and previous consolidation begin to cluster.
- If BTC pushes through 98k and holds, that would signal that the market has successfully absorbed current sell pressure and is ready to challenge the psychological 100k+ region again.
It is important to stress that these levels are reference points, not guarantees. Markets do not owe anyone perfectly clean retests. But they help us translate the abstract message of on-chain data into practical zones of interest:
- Trading below 90k while CDD remains depressed would confirm that short-term holders are still dominating flows.
- Reclaiming 98k alongside stable or declining CDD would reinforce the idea that long-term supply remains locked away, creating room for a renewed advance.
Either way, the on-chain evidence suggests the market is in a compression phase: volatility in price contrasts with a remarkable lack of movement from older coins. Historically, such periods often precede strong expansions – the direction of which will depend on macro conditions, risk appetite and the pace of new capital entering the ecosystem.
5. Why Whale Patience Matters for the Next Big Wave
So, does ultra-low CDD mean a 'guaranteed' large rally is around the corner? No. But it stacks the probabilities in an interesting way.
5.1 Structural Scarcity vs. Cyclical Demand
Bitcoin is structurally scarce by design: new issuance after each halving becomes smaller, and a significant portion of existing supply is effectively locked by long-term investors who rarely move their coins. When those investors choose to remain inactive – as the current CDD reading shows – the tradable float shrinks further.
In such an environment, price trends are largely dictated by the cyclical side: demand. If demand pulses higher while long-term supply remains tight, price must adjust upward to clear the market. The exact timing is impossible to predict, but the underlying mechanics are clear.
5.2 Whales as Shock Absorbers
Another way to think about whale behaviour is to view them as shock absorbers. When long-term holders are selling heavily into strength, they can cap upside moves but also reduce the risk of violent reversals later (because much of their supply has already been distributed). When they are not selling during pullbacks, they limit the depth of drawdowns by refusing to add additional supply to a stressed order book.
Today we are clearly in the second configuration. That does not mean whales will never distribute again, but it does mean the current correction is occurring against a backdrop of ongoing structural support rather than capitulation from old money.
6. How to Read This Phase Without Chasing Noise
For long-term participants, the key challenge is not predicting whether BTC will revisit 84k before reclaiming 98k. It is deciding how to respond to a market where on-chain data is constructive while price feels uncomfortable.
A few principles can help frame this phase more calmly:
• Separate structural data from short-term price moves. Ultra-low exchange inflow CDD is a structural, slow-moving signal. Daily candles around 90k are noise by comparison.
• Acknowledge that different cohorts have different time horizons. Short-term holders manage their risk in days or weeks; long-term holders think in years. Their actions can conflict in the short run while still aligning over the full cycle.
• Remember that no single metric is infallible. CDD is powerful when combined with other indicators such as realized price bands, ETF flows and macro trends. It should inform decisions, not dictate them.
Perhaps the most useful mental model is this: the market is currently running a stress test on short-term conviction, not on Bitcoin’s long-term thesis. Whales have effectively voted with their wallets by choosing not to send coins to exchanges, even as price dips. The result is a market that feels weak on the surface but remains tightly held underneath.
7. Conclusion: Calm Whales, Restless Short-Term Holders
The latest data from Binance’s exchange inflow CDD paints a surprisingly calm picture in the middle of what feels like a tense consolidation. Bitcoin has slid back to the 90k area, yet long-term holders – the backbone of every cycle – have rarely been this inactive on the sell side over the last seven years.
The adjustment we are witnessing is being driven mainly by short-term participants adjusting risk, not by whales abandoning their positions. That distinction matters. It suggests that, while prices can certainly probe lower support levels such as 84k, the core supply of Bitcoin remains tightly locked in strong hands. If and when new demand returns in size, the lack of available coins could amplify the move.
For now, the 84k–98k band acts as a compression chamber: below, nervous short-term holders; above, patient whales quietly 'tử thủ'. Exchange inflow CDD reminds us that the story of this market is not only written in price charts but also in the invisible choices of those who refuse to sell.
Whether the next chapter is a deeper retest or a renewed breakout will depend on macro data, ETF flows and broader risk appetite. But one thing is clear from the chain itself: the long-term believers are still sitting tight.