Bitcoin Sharks Add 54,000 BTC: Reading the Signal Behind Mid-Sized Accumulation
While attention often focuses on large institutional buyers or short-term traders, the latest on-chain data from Glassnode highlights a quieter but highly informative group: so-called “sharks”, entities holding between 100 and 1,000 BTC. Over the last week, this cohort has accumulated an estimated 54,000 BTC, equivalent to roughly $4.6 billion at recent prices, pushing their aggregate holdings to about 3.575 million BTC.
At first glance, this may look like a simple statistic. In reality, it offers a window into how more established market participants are reacting to the current drawdown. At a time when headlines focus on short-term volatility and liquidations, sharks appear to be treating the correction as an opportunity to scale into larger strategic positions.
This article unpacks why that matters, how shark behaviour has aligned with past market phases, and what investors should (and should not) infer from such aggressive net buying.
1. Who Are the “Sharks” in Bitcoin’s Food Chain?
On-chain analytics often sort holders into cohorts based on wallet size. In this framework:
- Retail and small holders typically hold less than 1 BTC.
- “Fish” and “dolphins” span roughly 1–100 BTC.
- “Sharks” are entities with 100–1,000 BTC.
- “Whales” and larger entities hold more than 1,000 BTC.
Sharks occupy an interesting middle ground. They are usually too large to be casual individuals, but too small to be sovereign funds or the largest public companies. This group tends to include early adopters, professional traders, family offices, hedge funds, crypto-native companies and mining treasuries. In other words, they are often active, research-driven and sensitive to price.
Because sharks operate at a scale where decisions must be deliberate, their net position changes can offer a useful gauge of how sophisticated market participants read the risk–reward balance at a given moment.
2. What the Latest Glassnode Data Shows
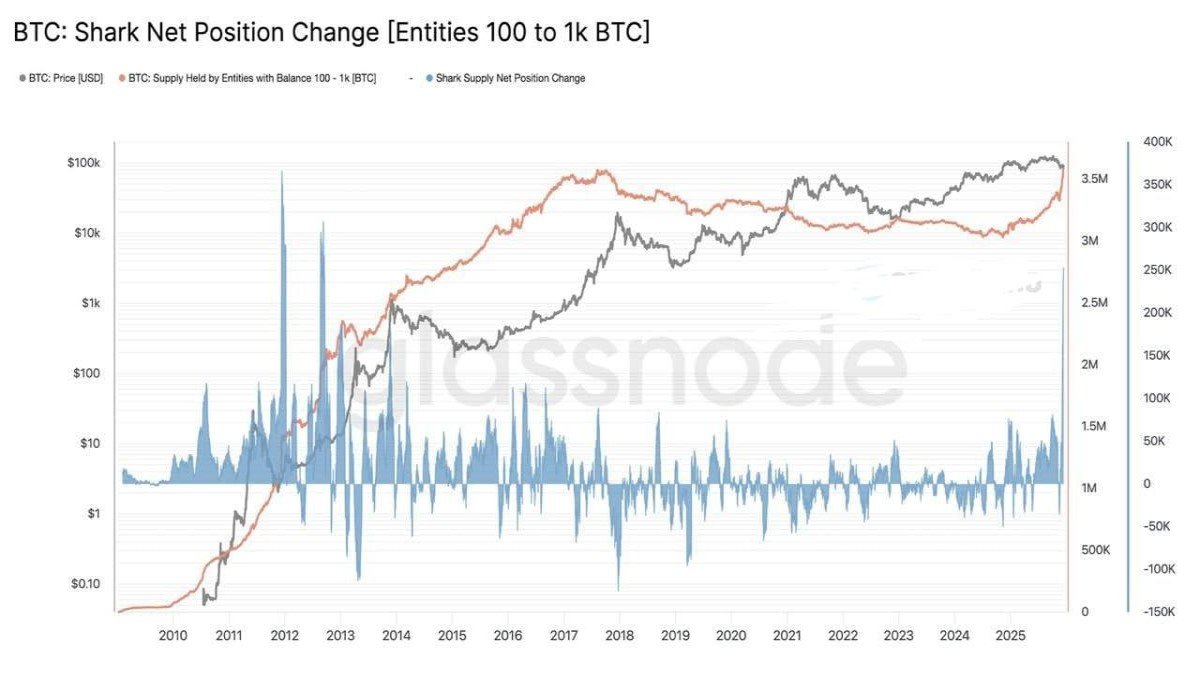
The Glassnode chart plots three key elements:
- The Bitcoin price (black line), capturing the broader market trend.
- The total supply held by shark entities (orange line), currently near 3.575 million BTC.
- The net position change of sharks (blue bars), showing how much this cohort adds or reduces per period.
In the most recent weekly data, the blue bars spike sharply positive: net shark holdings climbed by about 54,000 BTC. That is a sizeable move even in the context of Bitcoin’s multi-trillion-dollar market, and it continues a broader trend of accumulation that has been building over recent months.
Put differently, while the price has been correcting and short-term sentiment has turned cautious, mid-sized long-horizon players have used the weakness to add aggressively to their positions.
3. Why Shark Accumulation Matters
3.1. A bridge between retail enthusiasm and institutional scale
Retail investors tend to move in fast, respond strongly to headlines and often use high leverage. Large institutions, by contrast, typically execute through regulated products such as exchange-traded funds, and may rebalance based on mandate or macro models. Sharks sit between these two extremes.
They are large enough that their behaviour affects the order book but nimble enough to act quickly when they see attractive prices. When this cohort accumulates tens of thousands of BTC in a short period, it suggests that participants with both experience and flexibility see value in absorbing supply from weaker hands.
3.2. Supply absorption reduces immediate downside risk
Bitcoin’s price is ultimately a function of how much supply is available at each level of demand. When sharks buy 54,000 BTC in a week, that supply is effectively removed from liquid circulation and transferred to balance sheets that historically show longer holding periods. This has two implications:
- Less sell pressure at current levels. Coins held by entities with a history of accumulation are less likely to be sold on small rallies, making it harder for sudden spikes in supply to overwhelm the bid.
- Potential for future supply squeezes. If demand later recovers while this cohort continues to hold, the relative scarcity of freely available coins can amplify upside moves.
None of this guarantees a bottom, but it does suggest that downside moves increasingly require new sellers, not simply the same long-term holders capitulating.
3.3. Behaviour is aligning with historical accumulation zones
When we look back across previous cycles, sharp upticks in shark net position change have frequently appeared near key inflection points:
- After steep corrections, when sentiment was fragile and headlines were pessimistic.
- During long consolidation periods, when price moved sideways but ownership quietly rotated from short-term participants to more patient holders.
- In early stages of new uptrends, as conviction grew but before the broader market fully recognised the shift.
Once again, these patterns are not crystal balls. They do, however, show that the current behaviour of sharks is consistent with phases where the market was in the process of rebuilding a stronger base, even when price action alone looked indecisive.
4. What This Means for the Current Cycle
To interpret shark accumulation properly, it helps to place it within today’s broader context.
4.1. Price has corrected, but long-term supply is increasingly locked
Bitcoin has retreated significantly from its recent highs, with many short-term holders sitting on unrealised losses. This tends to trigger forced selling, liquidations and a general tightening of risk appetite. Yet at the same time, more of the total supply is migrating into hands that, by historical behaviour, tend to hold through volatility: exchange-traded products, corporate treasuries, some governments and now an increasingly committed shark cohort.
The net result is a market where the marginal seller is shrinking while the set of long-term holders expands. In such an environment, price can still be volatile, but each successive sell-off typically transfers coins to buyers with higher conviction.
4.2. Sharks appear to be leaning into the long-term thesis
For a shark-level entity, buying tens of thousands of BTC during a drawdown is not a purely tactical trade. It usually reflects a view that, over a multi-year horizon, the risk–reward has improved as price has fallen while long-term drivers – such as fixed supply, institutional infrastructure and macro uncertainty around traditional money – remain intact.
In essence, this cohort seems to be acting on the belief that short-term volatility does not invalidate the long-term thesis for Bitcoin as a store of value-type asset. Instead, it provides an opportunity to accumulate more units at lower prices.
4.3. However, accumulation does not prevent further corrections
It is important to be clear about what this signal does not imply. Shark buying does not mean price cannot fall further. Markets can and do overshoot to the downside, especially when macro news, derivatives positioning or regulatory headlines trigger additional stress. Even strong hands may decide to rebalance if conditions change sharply.
What the data does suggest is that every additional leg lower now requires new cohorts of sellers. If those sellers fail to materialise in sufficient size, the path of least resistance gradually shifts from persistent downtrend to a more neutral or upward-sloping market, even if the timing of that shift remains uncertain.
5. Practical Takeaways for Market Participants
For individuals and institutions watching these on-chain signals, the recent shark accumulation offers several practical lessons.
5.1. Follow the flows, not just the headlines
News coverage often focuses on price action or short-term derivatives metrics. On-chain data provides a complementary perspective: it shows who is actually buying and selling. When mid-sized entities quietly accumulate billions of dollars’ worth of BTC during a correction, it suggests that part of the market is positioning for a longer horizon than the daily narrative would imply.
5.2. Distinguish between structural and speculative demand
Short-term rallies can be driven by liquidations, momentum strategies or option flows. By contrast, steady accumulation by shark and whale cohorts is more indicative of structural demand – buyers who intend to hold for meaningful periods. Structural demand is what ultimately shapes the long-run supply profile and creates the conditions for large advances when sentiment turns.
5.3. Use on-chain data as a risk-management tool, not a shortcut
No single indicator – including shark net position change – should be treated as a trigger to buy or sell on its own. Instead, it can be a useful input in a broader framework that considers macro conditions, liquidity, valuation metrics and personal risk tolerance.
For example, persistent shark accumulation during falling prices might prompt an investor to reassess whether their own positioning is too short-term. Conversely, if shark balances were decreasing sharply during a euphoric rally, that could be a yellow flag that the market was leaning too heavily on less experienced participants.
6. Looking Ahead: What To Watch From Here
The latest week of data is notable, but the more important question is whether this pattern continues. A few markers to monitor in the coming months include:
- Trend in shark net position change: Do blue bars on the chart remain positive, indicating ongoing accumulation, or flip negative, suggesting profit-taking?
- Interaction with other cohorts: Are long-term holders and exchange balances shrinking in tandem with shark buying, confirming a rotation from weak to strong hands?
- Price behaviour around key levels: Does BTC stabilise or rebound as supply tightens, or do macro factors overwhelm on-chain strength and push prices lower regardless?
The answers will reveal whether this week's 54,000 BTC addition is an isolated event or part of a broader, enduring shift in ownership.
7. Conclusion: Quiet Accumulation in a Noisy Market
Glassnode’s latest data shows that Bitcoin’s shark cohort – entities holding between 100 and 1,000 BTC – has added around 54,000 BTC in just one week, lifting their total holdings to roughly 3.575 million BTC. At a time when price has corrected and sentiment is cautious, these mid-sized, often professional participants are behaving less like speculators and more like long-term allocators, using volatility to secure additional supply.
This does not guarantee a near-term bottom or a swift return to all-time highs. Markets remain sensitive to macro policy, liquidity and broader risk appetite. However, the pattern fits a familiar script: during periods of fear and consolidation, coins tend to migrate from short-term traders to holders with deeper conviction and longer horizons.
For observers trying to make sense of the current cycle, the lesson is straightforward: while price dominates the daily conversation, ownership tells the longer story. And right now, that story suggests that a growing block of well-capitalised investors is quietly positioning for Bitcoin's next chapter, even as the market continues to work through its latest correction.
Disclaimer: This article is for educational and analytical purposes only and does not constitute financial, investment, legal or tax advice. Digital assets are volatile and carry risk. Always conduct your own research and consult qualified professionals before making investment decisions.