Bitcoin’s Silent Cycle: What a Record Drop in Active Addresses Really Means
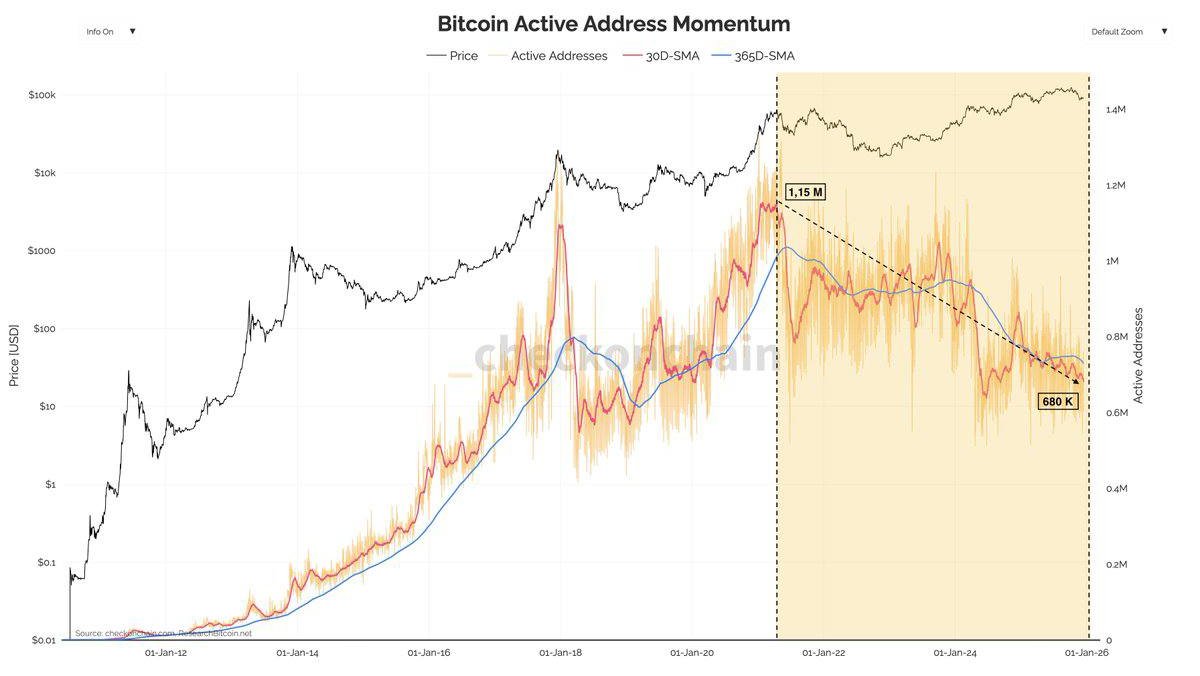
For most of Bitcoin’s history, a familiar pattern has played out each cycle: when price rises, on-chain activity surges. New users arrive, existing holders move coins between wallets and exchanges, and the number of active addresses climbs alongside price. That pattern has broken in the current cycle. Since April 2021, the count of active Bitcoin addresses has been trending lower, slipping from a peak near 1.15 million per day to roughly 680,000. The chart now shows a clear downtrend in activity even while price sits far above previous cycles.
At first glance, this looks like a contradiction. How can Bitcoin be worth more than ever while fewer addresses are actively sending and receiving coins on-chain? Is this a warning sign that network health is deteriorating, or evidence of something deeper about how the asset is held and used today? To answer those questions, we need to unpack what the active address metric really captures and how market structure has evolved over the past four years.
Understanding the Active Address Momentum Chart
The chart behind this discussion tracks three main elements: Bitcoin’s price, the raw number of active addresses per day, and two moving averages of that activity (commonly a 30 day and 365 day simple moving average). When the short term line sits above the long term line, it usually signals that network usage is accelerating. When it falls below, it suggests momentum is fading.
From 2016 through early 2021, the pattern was intuitive. During bull markets, address activity would spike as speculative interest and transactional demand both increased. In deep bear markets, activity would cool as excitement faded and many participants stepped to the sidelines. The high watermark around April 2021, close to 1.15 million active addresses, fit this historic script: it coincided with a period of intense attention, rapid price appreciation and frequent movement of coins.
What stands out in the latest data is not just that activity has declined, but that it has done so persistently while price remains elevated. The chart’s highlighted zone shows a steady glide path down to roughly 680,000 daily active addresses, a level that historically would have been associated with much lower prices. Rather than a brief cooling off, the network has experienced a multi year shift toward lower visible usage.
Why Activity Is Falling in an Uptrend
There is no single explanation for this divergence. Instead, several forces are working together to produce a quieter base layer even as Bitcoin’s market value and institutional footprint expand. The most important drivers can be grouped into four themes.
1. A rise in holding over spending
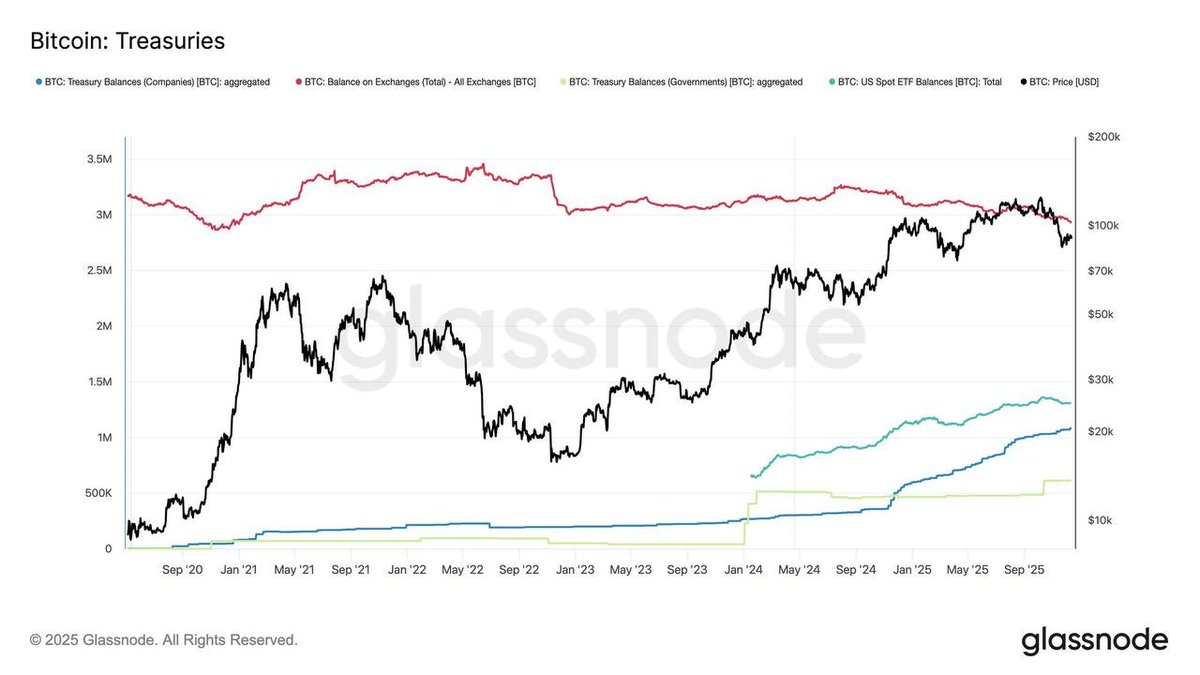
First, Bitcoin’s holder base has matured. Earlier cycles were dominated by participants who moved coins frequently between exchanges and personal wallets, often in response to short term price swings. Over time, however, a larger share of supply has migrated to entities whose strategy is to hold for years rather than months. These include corporate treasuries, long term funds, family offices and individual investors who treat Bitcoin as a strategic reserve asset.
When more coins sit in deep cold storage or professionally managed custody, they simply move less. Addresses associated with these holdings can lie dormant for long periods, dropping out of the active set. Paradoxically, a decline in activity can therefore be a sign of greater conviction, not waning interest. The network becomes quieter because participants are less reactive and more comfortable with long holding periods.
2. Internalisation inside exchanges and custodians
The second shift is structural. A growing portion of Bitcoin trading now occurs inside large exchanges, brokerages and exchange traded products. When users buy or sell on those platforms, most transfers happen off-chain as internal ledger adjustments. On-chain transactions are only required when coins enter or leave the platform as deposits or withdrawals.
As these platforms scale, a single on-chain movement can represent many underlying trades. For example, an exchange might batch hundreds of user withdrawals into a single transaction, or net incoming and outgoing flows before settling. From the on-chain perspective, this looks like a modest level of activity. From the user perspective, it can represent a very active market. In that sense, part of Bitcoin’s economic life has been hidden behind custodial walls, reducing the address count without necessarily reducing demand.
3. The gradual move to second layers and side systems
Third, payment and settlement activity is slowly migrating to systems built on top of Bitcoin or alongside it. The goal of these layers is to provide faster and cheaper transactions while using the base chain as a secure anchor. When payments are routed through such layers, the base chain may only see occasional net settlements rather than every individual transfer.
Although usage of these scaling solutions is still small compared with the broader network, it contributes to a trend where more activity happens per on-chain transaction. The result is that raw address counts become a less direct proxy for how many people are using Bitcoin for payments, savings or trading.
4. Improved efficiency and consolidation
Finally, efficiency improvements have changed user behaviour. Over the years, wallets and exchanges have adopted better practices such as transaction batching, output consolidation and more careful management of addresses. These techniques reduce fees and improve privacy, but they also mean fewer addresses need to be touched for the same economic value to move.
In earlier cycles, a typical user might have repeatedly reused a small number of addresses for everyday transfers, keeping them active almost continuously. Today, many wallets generate fresh addresses automatically and consolidate unspent outputs only when necessary, which can lower the count of addresses that fire on any given day.
What the Decline Says About Who Owns Bitcoin Now
Putting these forces together, the drop from 1.15 million to roughly 680,000 active addresses paints a picture of a network whose ownership has become more concentrated in patient, well capitalised hands and more mediated by large service providers.
This does not mean that a handful of entities control everything. The address metric itself has limits: a single person can control many addresses, and a single exchange address can represent thousands of customers. But directionally, the data aligns with other signs that Bitcoin has moved from a retail dominated frontier asset to a more institutionally held, professionally managed component of portfolios.
Long term holder metrics, realised capitalisation and age distribution analyses all suggest that coins are staying still for longer. The active address downtrend is essentially the mirror image of that trend. Fewer addresses move each day because a higher share of supply is parked, often in the hands of entities with multi year horizons.
Is Low On-Chain Activity a Bearish Signal?
The natural next question is whether this lower activity should be read as a negative for price. Historically, peaks in address activity have often coincided with late stage euphoria. Retail participants flood in, exchange deposits soar and even small wallets become hyper active. Seen through that lens, subdued activity can be a sign of a healthier, less overheated market.
However, it would be simplistic to call the current pattern outright bullish or bearish. Instead, it changes what investors should pay attention to. When on-chain usage explodes alongside price, the main risk is that enthusiasm has outrun fundamentals. When price rises while activity stays muted, the greater risk is that liquidity and ownership may be more fragile than they appear.
If a large share of supply sits with patient holders and custodial venues, price can be stable for long stretches. But if those holders ever decided to reduce exposure at the same time, or if custodial flows shifted in one direction, the resulting moves could be sharp, because there is less everyday trading activity to absorb large orders. In effect, the market may be quiet until it suddenly is not.
Risks and Signals to Monitor if Activity Keeps Sliding
For this reason, the direction of active address momentum still matters. A continued drift lower in the coming years would raise three key concerns that investors should monitor carefully.
First, liquidity concentration. If trading and holdings become increasingly concentrated in a small number of venues and large entities, the system may be more exposed to operational disruptions or policy changes affecting those venues. While the Bitcoin protocol itself remains decentralised, real world access to liquidity could become more centralised.
Second, price discovery quality. With more activity happening inside closed platforms, the on-chain record tells a smaller share of the story. That can make it harder for analysts to gauge sentiment through traditional on-chain tools, because large internal reallocations may never touch the base chain. Investors will need to combine on-chain data with order book information, derivatives positioning and flow reports from regulated products to get a full picture.
Third, behavioural feedback loops. If most visible activity comes from a small cohort of short term traders, while long term holders rarely move, price may swing more sharply in response to marginal changes in sentiment. Even modest flows out of exchange traded products or major funds could create outsized price reactions when everyday on-chain usage is muted.
How Long-Term Participants Can Use This Information
For long horizon investors, the key is not to panic about every dip in the address count but to integrate this signal into a broader framework. Several practical guidelines can help.
First, recognise that network usage metrics are evolving. Active addresses were once a straightforward proxy for adoption. Today they are one piece of a larger puzzle that includes custodian reserves, ETF flows, derivatives open interest and second layer statistics. Treat them as directional signals rather than precise gauges of demand.
Second, focus on who is likely selling or buying during major moves. When on-chain data shows coins moving out of long dormant wallets, that is a different signal from short term traders shuffling coins between exchanges. A quiet base layer with occasional bursts of large, old coins moving can indicate distribution from early holders. A steady pattern of small deposits from newer addresses might suggest the opposite.
Third, maintain risk management that does not depend on perfect timing. The long downward trend in active addresses since 2021 is a reminder that structural shifts can take years to play out and are hard to trade in a precise way. Strategies such as gradual accumulation, diversification and explicit position sizing rules can help investors stay engaged without needing to predict every inflection point.
Finally, keep an eye on policy and infrastructure developments. As regulators give more clarity to custodians, as banks explore digital asset services and as new layers build on top of Bitcoin, more activity will continue to move off the base chain. The headline number of daily active addresses may never again be the primary adoption story it once was. The more relevant question will be how deeply Bitcoin is embedded in payment flows, savings products and institutional portfolios, regardless of where settlement takes place.
A Quieter Chain, Not a Weaker Network
The record decline in Bitcoin active addresses can feel unsettling, especially for those who grew up with the simple rule that more activity equals a stronger network. The reality in 2025 is more nuanced. Lower visible activity on the base layer does not automatically mean that interest has faded or that the network is in trouble. It may instead reflect a transition toward more patient holders, more professional infrastructure and more layers of abstraction between end users and the underlying chain.
That transition brings both benefits and new risks. It can reduce day to day noise, support long term price stability and make Bitcoin more accessible through familiar financial interfaces. But it can also obscure the flow of funds, concentrate liquidity and make eruptions of volatility more dramatic when they do occur.
For educators and analysts, the task now is to move beyond one dimensional interpretations of on-chain metrics. For investors, the challenge is to stay calm during periods when the chart looks unusually quiet and to be prepared for the moments when that quiet suddenly breaks. In that sense, Bitcoin’s current cycle is not just about higher prices or new all time highs; it is about learning how to understand a network that has grown up, spread out and become more complex than any single metric can fully capture.
Disclaimer: This article is for educational and informational purposes only and does not constitute investment, legal or tax advice. Digital assets are volatile and involve risk. Always conduct your own research and consult a qualified professional before making financial decisions.