Bitcoin’s NVT Golden Cross Signals a Re-Pricing Phase, Not Just a Dip
Price charts alone can make any market look either euphoric or hopeless. Over the past weeks, Bitcoin has leant toward the second category: lower highs, persistent selling pressure and a community that is clearly tired after a long and volatile year. But when we move away from candles and look at on-chain activity, a different story appears. The NVT Golden Cross, one of the more nuanced valuation indicators for Bitcoin, has dropped into a zone that has historically aligned with long-term accumulation and later re-pricing higher.
The key idea is simple but powerful: Bitcoin is not just falling; it is being re-priced by investors. The market seems to be shifting from a phase where the asset was arguably undervalued relative to its network usage, toward a state that is closer to fair value. That process rarely happens in a straight line. It is usually messy, filled with doubt and, for those who look only at short-term charts, deeply uncomfortable.
This article unpacks what the NVT Golden Cross actually measures, why the current reading looks historically significant, and how to think about this phase if you are trying to understand Bitcoin from a long-term, data-driven perspective rather than a purely emotional one.
1. What Is NVT and Why Does the Golden Cross Matter?
NVT stands for Network Value to Transactions. In very rough terms, it compares Bitcoin’s total market capitalization to the dollar value of transactions happening on-chain. You can think of it as a kind of price-to-sales ratio for a payment and settlement network. When NVT is very high, the market value looks large compared with the economic activity taking place on the blockchain. When NVT is low, the asset may be cheap relative to how much value is moving across the network.
The NVT Golden Cross goes a step further. Instead of looking at raw NVT, it compares a shorter-term moving average with a longer-term one and turns the result into an oscillator. When this oscillator sinks deeply below zero, it suggests that the short-term valuation is depressed compared with the long-term trend of network activity. Historically, such periods have often coincided with the end of bear markets or with late-stage corrections inside broader bull cycles.
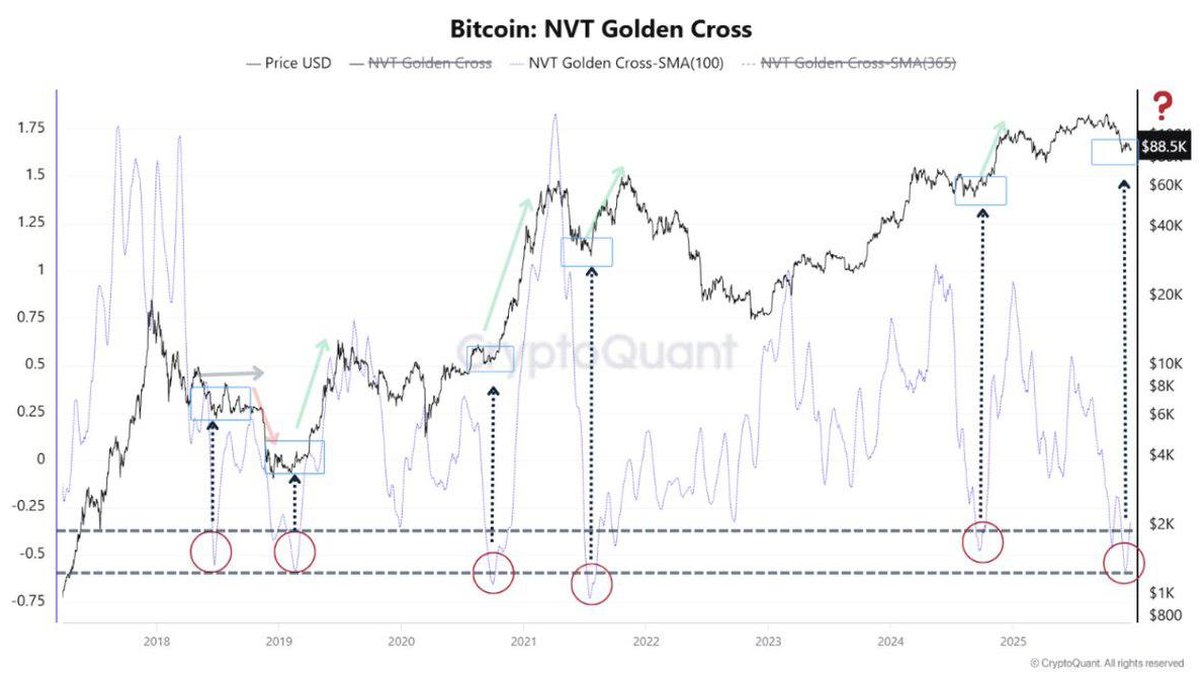
On the latest chart, the indicator has fallen toward the lower bound that, in past cycles, has only been reached a handful of times. Each of those instances aligned with a market that had already endured substantial downside and was quietly transitioning into a phase of accumulation and re-pricing.
2. From Undervalued to Fair Value: How Re-Pricing Actually Works
It is tempting to imagine that once an asset becomes cheap, rational investors immediately step in, price snaps back and the opportunity disappears overnight. In reality, markets are social systems, and social systems adjust more slowly. For Bitcoin, the path from undervaluation to fair value usually follows a three-step pattern.
2.1 Capitulation and forced selling
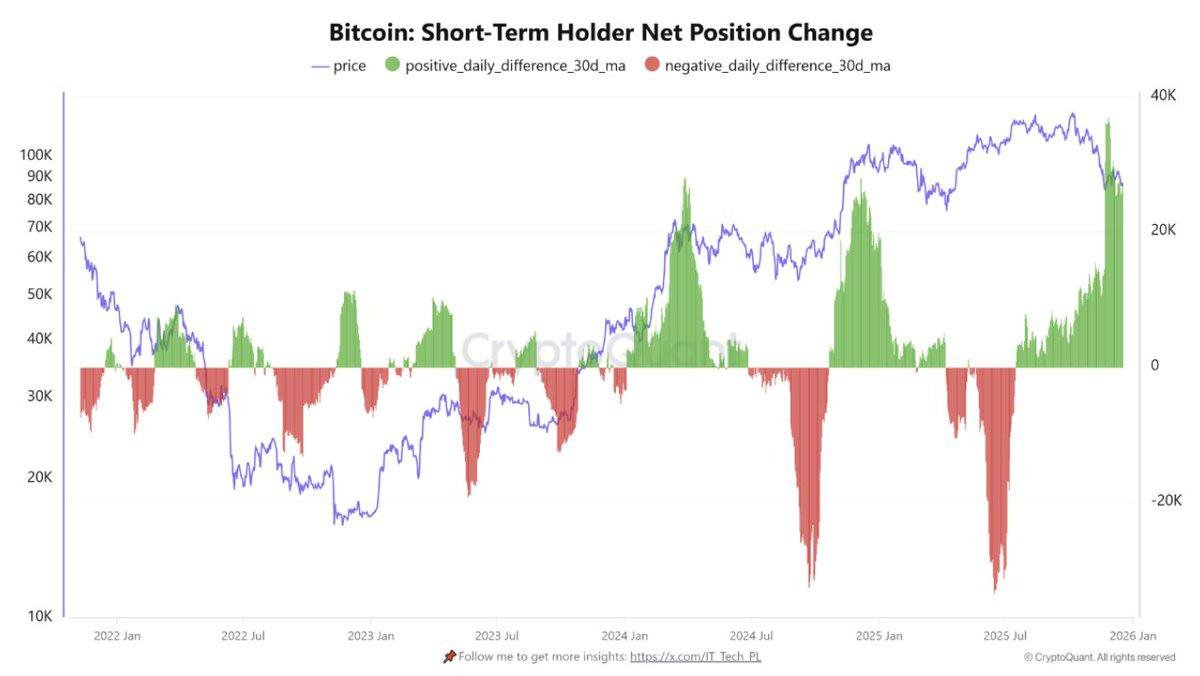
The first step is the obvious one. When prices fall sharply, leveraged traders are forced to exit, short-term holders realise losses and patience runs thin. This pushes on-chain valuation metrics like the NVT Golden Cross deep into negative territory. The chart shows several red circles in the past where the oscillator pierced the lower band: these were points where fear dominated and most participants were focused on survival rather than opportunity.
2.2 Quiet accumulation by stronger hands
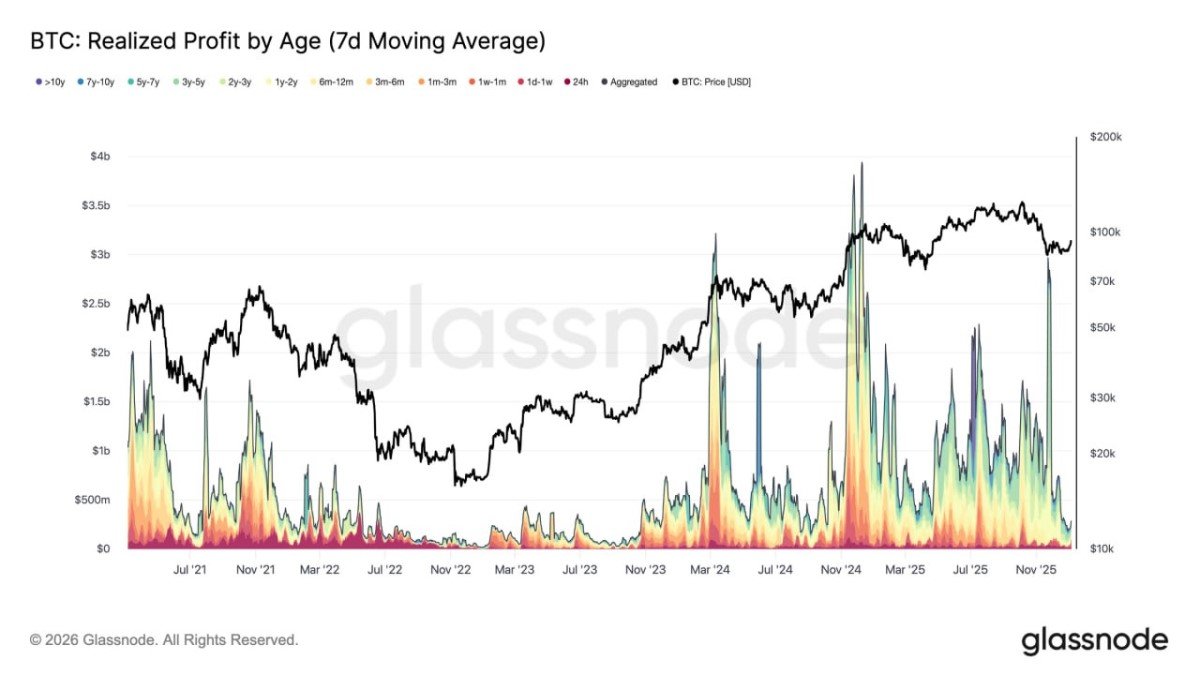
The second step is less visible but more important. Once forced selling slows down, a different cohort begins to take the other side of the trade. Long-term investors, treasury buyers and patient funds use the lower prices to build positions. Their activity often does not generate dramatic headlines, but it leaves fingerprints on-chain: coins move from younger to older hands, the share of supply held for many months rises, and exchange balances trend downward.
During this phase, the NVT Golden Cross tends to stay depressed for an extended period. That does not mean the indicator is broken. It simply reflects the fact that the market is still valuing Bitcoin cautiously even as meaningful capital is quietly entering. This is precisely the dynamic that defines a re-pricing phase.
2.3 Gradual recognition and re-rating
Finally, as macro conditions stabilise and selling pressure diminishes, the market slowly begins to recognise that the asset might have been priced too pessimistically. New narratives emerge, structural buyers such as investment funds or corporates become more visible, and the same on-chain activity that looked unimpressive at lower prices now supports a higher valuation.
In this third step, the NVT Golden Cross typically climbs back toward neutral or positive territory. By then, much of the easiest accumulation opportunity has passed, but the long-term trend can still have a lot of room to run.
3. What the Current Reading Tells Us
In the latest data, the NVT Golden Cross oscillator has slid close to the lower boundary that marked major inflection points in previous years. Unlike earlier crisis moments, however, the price of Bitcoin is not at cycle lows; it is consolidating after having reached new highs. This contrast is important.
It suggests that the network has grown and matured, while the market is still in the process of deciding how to value that growth. On-chain settlement volumes, institutional participation and long-term holder supply have all expanded compared with earlier cycles. Yet the indicator says that, relative to that activity, the recent price reset is pushing Bitcoin back toward levels that look more consistent with accumulation than with exuberance.
Stated differently, the community of investors appears to be moving from a phase of clear undervaluation into a more balanced zone where buyers and sellers are wrestling over what the new “fair value” range should be. This is exactly the kind of environment in which re-pricing takes place.
4. The Psychology of a Re-Pricing Market
Re-pricing is not just a statistical phenomenon; it is psychological. After a strong rally, many participants anchor their expectations to recent highs. When price falls, they view every bounce as a chance to get out at a smaller loss rather than as an opportunity to increase exposure. At the same time, new entrants are hesitant to step in because the recent memory of volatility is still fresh.
That tug of war produces the slow, choppy sideways ranges that often show up in the chart after the red circles marking deep NVT Golden Cross lows. Volatility compresses, volume drops and social media conversation quiets down. To those watching day by day, this can feel like a market that has lost its narrative. On-chain data, however, often tells a more nuanced story: coins are still migrating from weaker hands to stronger ones, and the network continues to process meaningful economic value.
Understanding this psychology is useful because it explains why re-pricing rarely feels comfortable in the moment. The data may suggest that Bitcoin is moving from undervalued toward fair value, but the lived experience is one of doubt, conflicting opinions and short rallies that fail to hold.
5. How On-Chain Valuation Differs from Price Targets
It is important to emphasise what the NVT Golden Cross does not do. It does not provide precise price targets or guaranteed turning points. On-chain valuation indicators are best understood as tools for framing where in the broader cycle the market might be, not as instruments for timing individual entries or exits.
When the oscillator is deeply negative, as it is now, it tells us that the market value of Bitcoin is low relative to recent transaction activity. Historically, that has often coincided with attractive long-term entry zones, but the indicator does not specify whether price might still move lower in the short term. Similarly, when it reaches elevated levels, it signals caution but does not automatically call the top.
For long-term participants, the educational takeaway is that on-chain metrics are most powerful when combined with risk management and a time horizon measured in years. They can help investors avoid treating every correction as a disaster or every breakout as a one-way bet by placing both in the context of valuation and network fundamentals.
6. Structural Forces Behind the Current Cycle
Beyond pure on-chain activity, several structural trends shape how this re-pricing phase may unfold.
• Institutional presence is larger than in past cycles. Exchange-traded products, corporate treasuries and specialised funds now hold a meaningful share of supply. Their flows can amplify both downside and upside, but they are generally guided by mandates and rebalancing rules rather than by intraday sentiment.
• Derivatives markets are deeper. Futures and options allow sophisticated participants to hedge or express views without moving coins on-chain. This can dampen some on-chain signals in the short term but also provides relief valves during periods of stress.
• Regulatory clarity is slowly improving in major jurisdictions. While rules are far from perfect, the direction of travel is toward more defined frameworks, which tends to support the long-term investment case even if it sometimes weighs on short-term enthusiasm.
All three forces tilt toward Bitcoin being treated less as a speculative curiosity and more as a macro asset whose valuation can be debated, modelled and, at times, re-rated. The NVT Golden Cross is one lens through which that evolving status becomes visible.
7. Practical Lessons for Different Types of Participants
How should different market participants interpret the current set-up?
7.1 Long-term investors
For those who view Bitcoin as a multi-year allocation, deeply negative readings on the NVT Golden Cross have historically aligned with phases where disciplined accumulation outperformed reactive trading. The indicator does not remove risk, but it suggests that the market is in a zone where the long-term balance between price and network activity is more favourable than it was near prior peaks.
7.2 Short-term traders
Shorter-term participants should treat the indicator more as a background weather map than as a day-to-day signal. A depressed NVT Golden Cross does not prevent further volatility, but it may caution against assuming that current weakness automatically implies a full structural breakdown. In a re-pricing phase, markets can surprise in both directions.
7.3 Builders and ecosystem projects
For developers, entrepreneurs and service providers, the key insight is that user engagement and real economic activity on the network matter just as much as headline price. When valuations reset but usage remains resilient, it often means that the foundations for the next expansion are being laid quietly. Metrics like NVT remind builders that sustainable value creation depends on helping people use the network in meaningful ways, not just on riding price momentum.
8. The Role of Patience in a Data-Driven Strategy
One of the most underrated skills in digital-asset investing is patience. Re-pricing phases test that skill relentlessly. On-chain data may show that value is gradually migrating to long-term holders and that valuation metrics are improving, yet price can remain frustrating for months.
Patience, however, is not the same as blind optimism. It means using indicators such as the NVT Golden Cross to assess whether the behaviour of other market participants is consistent with long-term accumulation or with mounting risk. When the data and the narrative diverge, disciplined investors resist the urge to chase every move and instead focus on position sizing, diversification and their own time horizon.
9. Looking Ahead: What Would Confirm the Re-Pricing Thesis?
No single metric can write the future in advance, but several developments would support the view that Bitcoin is indeed transitioning from undervalued to fairly valued in this cycle:
- A stabilisation and gradual recovery in the NVT Golden Cross toward neutral territory while price builds a base rather than making new lows.
- Continued evidence of coins moving from short-term holders to long-term holders, indicating that the accumulation theme remains intact.
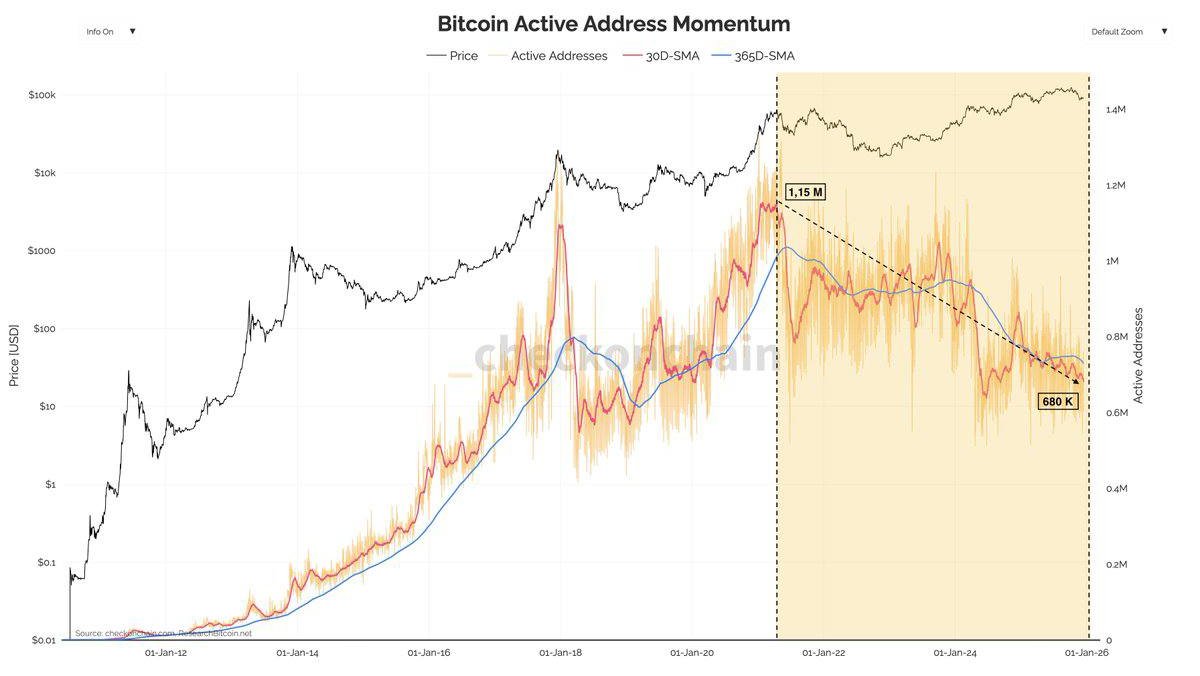
- Signs that network usage is growing or at least holding steady, confirming that the underlying utility of the system is not eroding even as the market reassesses valuation.
Conversely, a breakdown in on-chain activity or a sustained loss of long-term holder conviction would argue that the re-pricing is not yet complete. The value of the indicator lies not in predicting one outcome, but in helping observers update their views as new data arrives.
10. Final Thoughts
The latest plunge in Bitcoin’s NVT Golden Cross reading is not just another line on a chart. It is a snapshot of how the market is collectively re-evaluating the asset after a rapid ascent and a painful correction. History suggests that such moments often coincide with the quiet, unglamorous work of accumulation by investors who are able to look beyond the immediate noise.
Whether this cycle ultimately follows the same path as previous ones remains uncertain, and no indicator can remove that uncertainty. What it can do is reframe the conversation. Instead of asking only, 'Why is price down?' we can ask, 'How is the market re-pricing Bitcoin relative to its actual use and adoption?' That is a healthier question for a maturing asset class — and one that invites analysis rather than fear.
Disclaimer: This article is for educational and informational purposes only and does not constitute investment, legal or tax advice. Digital assets are volatile and involve risk. Always conduct your own research and consult a qualified professional before making financial decisions.