Short-Term Holders Add 100,000 BTC: What a Historic Accumulation Wave Really Means
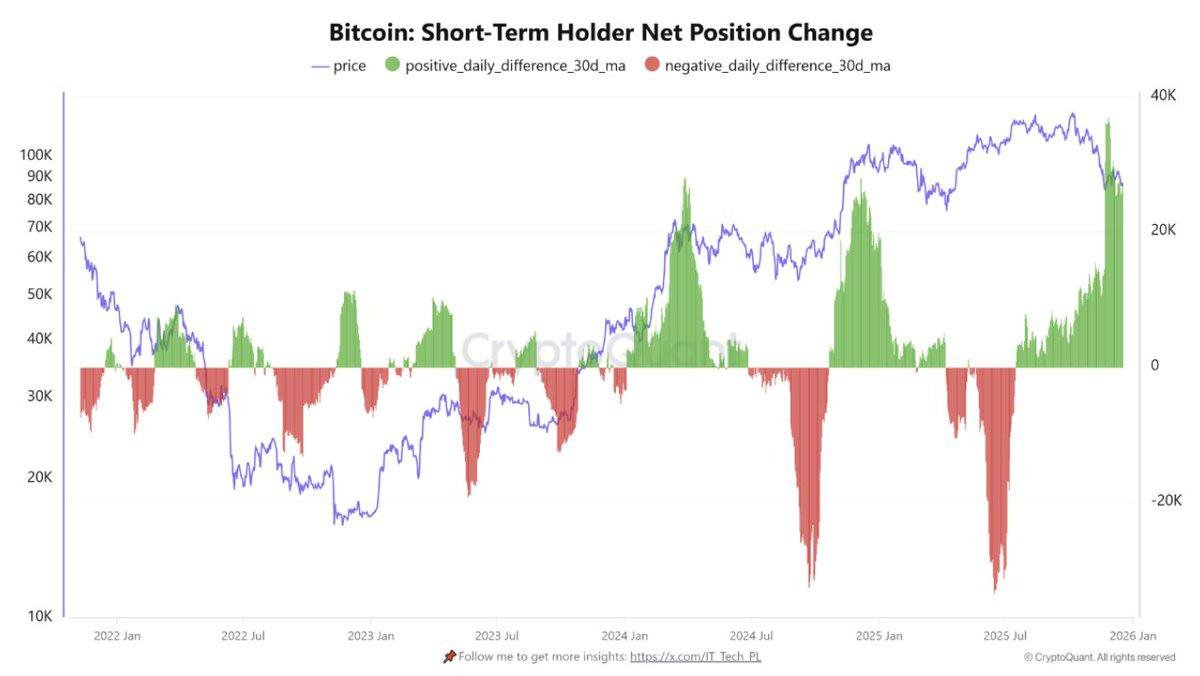
Markets often move fastest when the least patient investors change their minds. That is exactly what on-chain data indicates is happening in Bitcoin right now. The latest readings of the Short-Term Holder Net Position Change metric show a surge of more than +100,000 BTC in net holdings held by short-term investors. On the chart, this appears as a huge green block rising above the zero line, in stark contrast to the deep red distribution phases seen earlier in the year.
At first glance, it is tempting to translate this directly into a simple story: short-term traders are buying again, so price should move higher. The reality is more complex and more interesting. A move of this magnitude says something deeper about how different types of investors are repositioning, how risk appetite is shifting, and how the market is gradually rebuilding a foundation after a volatile period.
This article takes a closer look at what this indicator actually tracks, why a +100K BTC change is historically notable, and how to read this kind of data in a disciplined, educational way rather than as a one-line prediction.
1. What Is Short-Term Holder Net Position Change?
On-chain analytics divide Bitcoin owners into groups based on how long they have held their coins. While precise definitions vary by provider, a common split is:
- Short-Term Holders (STH): Addresses whose coins have moved on-chain within the last 155 days.
- Long-Term Holders (LTH): Addresses whose coins have remained unmoved for longer than that threshold.
This classification is not about identity; it is about behaviour. Coins that have not moved for months tend to belong to investors who think in years. Coins that move frequently tend to belong to more reactive participants: new entrants, active traders, funds managing shorter horizons, or entities rebalancing around macro events.
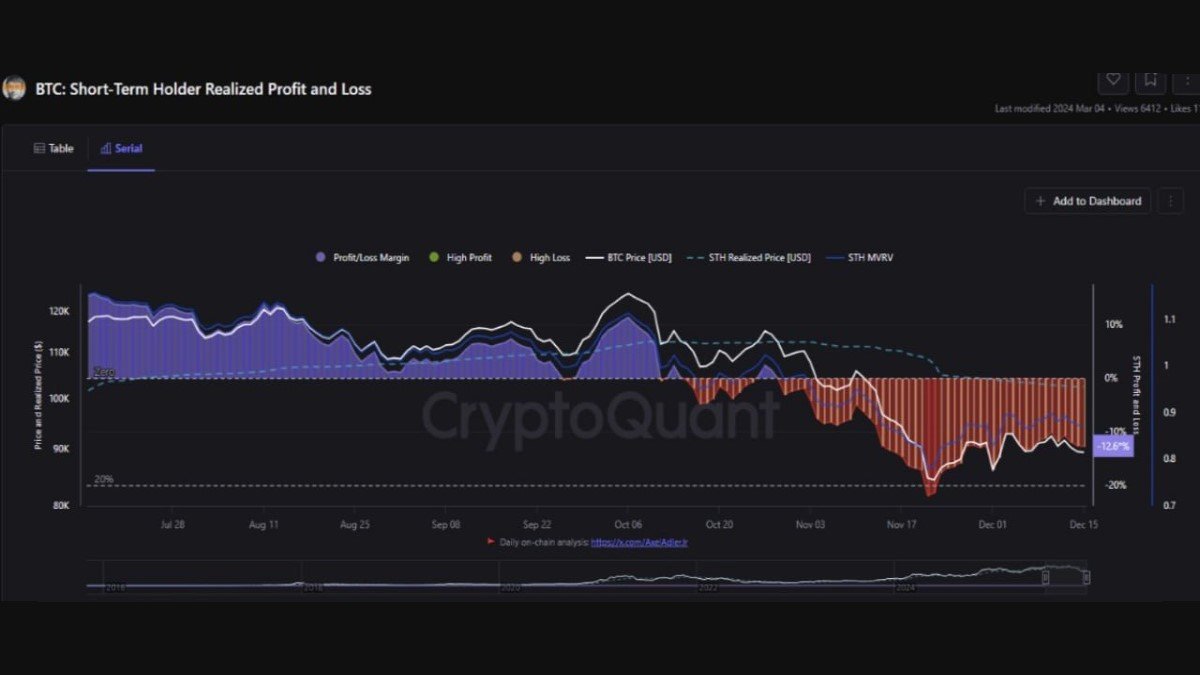
Short-Term Holder Net Position Change measures the daily change in the supply held by that short-term cohort, usually smoothed with a moving average such as 30 days. When the metric is above zero (green on the chart), STH holdings are increasing on net: they are collectively accumulating more BTC than they are distributing. When it is below zero (red), they are a net source of supply to the market.
Because short-term holders tend to react quickly to price moves and news flow, this metric is a useful window into how the “fast money” side of the ecosystem is behaving at any given moment.
2. Why a +100K BTC Shift Is Historically Significant
The latest observation is striking: the STH net position metric has climbed to levels corresponding to a net increase of more than 100,000 BTC over the smoothing window. To put this into perspective:
- At current price levels, that represents tens of billions of US dollars of Bitcoin moving into the hands of short-term investors.
- Historically, few periods have seen such a large and swift change. When they did occur, they tended to appear near key turning points in the cycle: either after deep corrections or at the beginning of new expansion phases.
- The jump comes after a sequence of strong red readings earlier in the year, during which the same cohort was consistently reducing exposure and realising losses.
In other words, the group that had been a persistent source of selling has suddenly flipped into aggressive accumulation mode. That does not guarantee a particular price outcome, but it is a clear sign that the emotional and strategic posture of a large part of the market has changed.
3. What Drives Short-Term Holders to Accumulate at This Scale?
Why would short-term investors, who are often portrayed as cautious and reactive, decide to add such a large amount of BTC in a relatively tight window? Several forces likely interact:
3.1 Perceived value after a drawdown
Periods of heavy red bars on the chart usually correspond to deep corrections, during which short-term participants sell into weakness either voluntarily or because they are forced to de-leverage. As the selling pressure exhausts itself and prices start to stabilise, the same cohort can perceive better value and begin to rebuild positions. The transition from distribution to accumulation is often abrupt because many investors are watching similar price levels and volatility signals.
3.2 Improving macro expectations
Short-term holders are particularly sensitive to changes in macro narrative: expectations about interest rates, employment, fiscal policy and liquidity. When incoming data and policy signals hint at a friendlier environment for risk assets over the coming months, tactical investors may see an opportunity to position ahead of a potential rebound.
In that sense, the +100K BTC surge is not just about charts; it is a reflection of how this cohort interprets the broader economic backdrop and Bitcoin’s role within it.
3.3 Structural demand channels
Another factor is the gradual maturation of channels through which capital enters the Bitcoin ecosystem. Exchange-traded products, institutional mandates, integrated wallet experiences and on-ramp partnerships can all create bursts of inflows when sentiment improves. Even if the ultimate capital owners are long-term oriented, their initial purchases often pass through entities that look like short-term holders on-chain, contributing to the metric’s rise.
4. High-Velocity Accumulation as a Market Engine
Describing the current environment as a phase of “high-velocity accumulation” is more than a colourful phrase. It captures the idea that the rate of change in STH holdings can itself act as a fundamental engine for the market.
Here is why:
- When short-term holders are net sellers, they add liquid supply that must be absorbed by long-term investors or new entrants. This can cap rallies or deepen declines.
- When they switch to strong net buyers, they instead compete with long-term participants for a finite pool of available coins, tightening supply conditions.
- The faster this switch happens, the more abrupt the change in the supply-demand balance, and the more likely it is to influence price over the medium term.
The current +100K BTC increase suggests that the market is going through such a regime shift. For weeks, short-term investors were primarily a source of coins. Now they are a key source of demand. If that behaviour persists, it can underpin a sustained re-rating of Bitcoin’s trading range rather than just a brief bounce.
5. The Double-Edged Nature of Short-Term Holder Strength
It is important, however, not to romanticise this cohort. Short-term holders have a track record of both supporting and pressuring the market. Their defining trait is flexibility, not unwavering conviction.
A high level of STH accumulation today naturally implies that there is a larger pool of potentially reactive supply tomorrow. If conditions change abruptly—due to macro surprises, regulatory news or simply a sharp price drop—these coins can return to the market just as quickly as they left, leading to volatility spikes.
From an educational standpoint, the key lesson is that who holds coins matters almost as much as how many are held. Supply concentrated in long-term holders is historically associated with more resilient price floors. Supply concentrated in newer, shorter-horizon hands can fuel both rallies and corrections.
Therefore, the +100K BTC increase should be viewed as a powerful short- to medium-term force, but not as a guarantee of one-way price action. It tells us that risk appetite among fast-moving participants has recovered, not that risk has disappeared.
6. How This Fits with Other On-Chain Signals of Accumulation
The most informative way to use Short-Term Holder Net Position Change is to place it alongside other on-chain metrics rather than in isolation. When those indicators converge, the message becomes clearer.
Recent data has shown:
• Long-term holder supply near all-time highs. Coins that have not moved for many months still account for a large share of total supply. This suggests that, while short-term investors are very active, the structural conviction base remains intact.
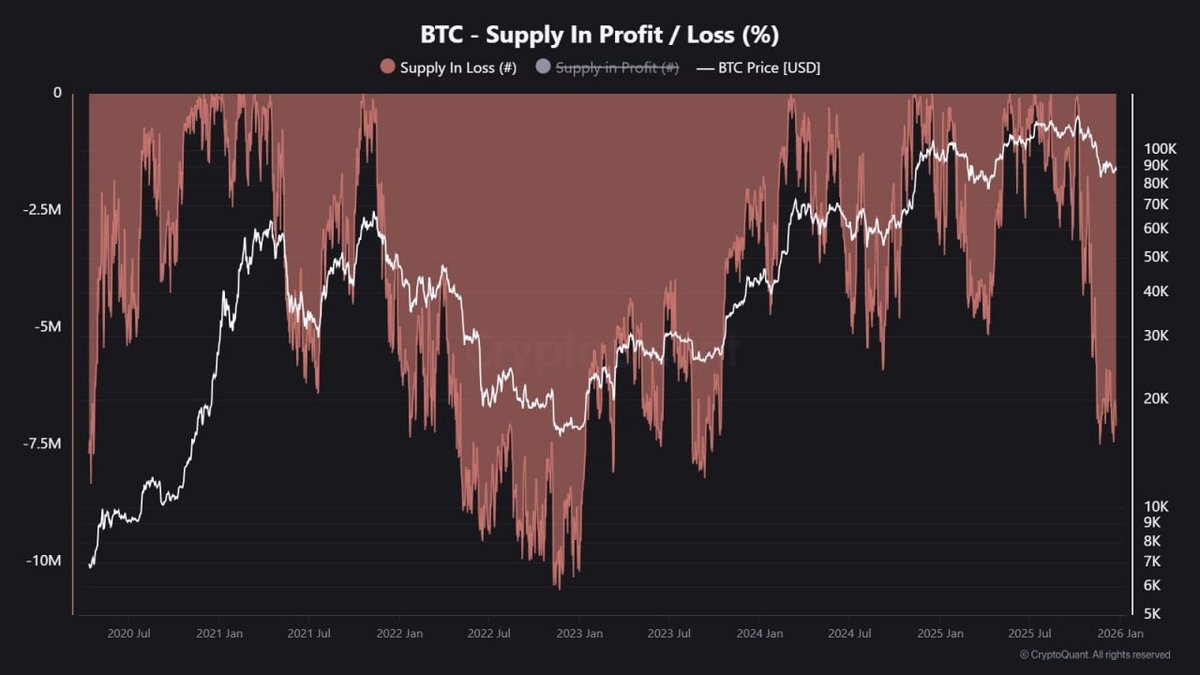
• Exchange balances trending sideways or lower. When both long-term and short-term cohorts are removing coins from exchanges or keeping them off-market, the freely tradable float shrinks.
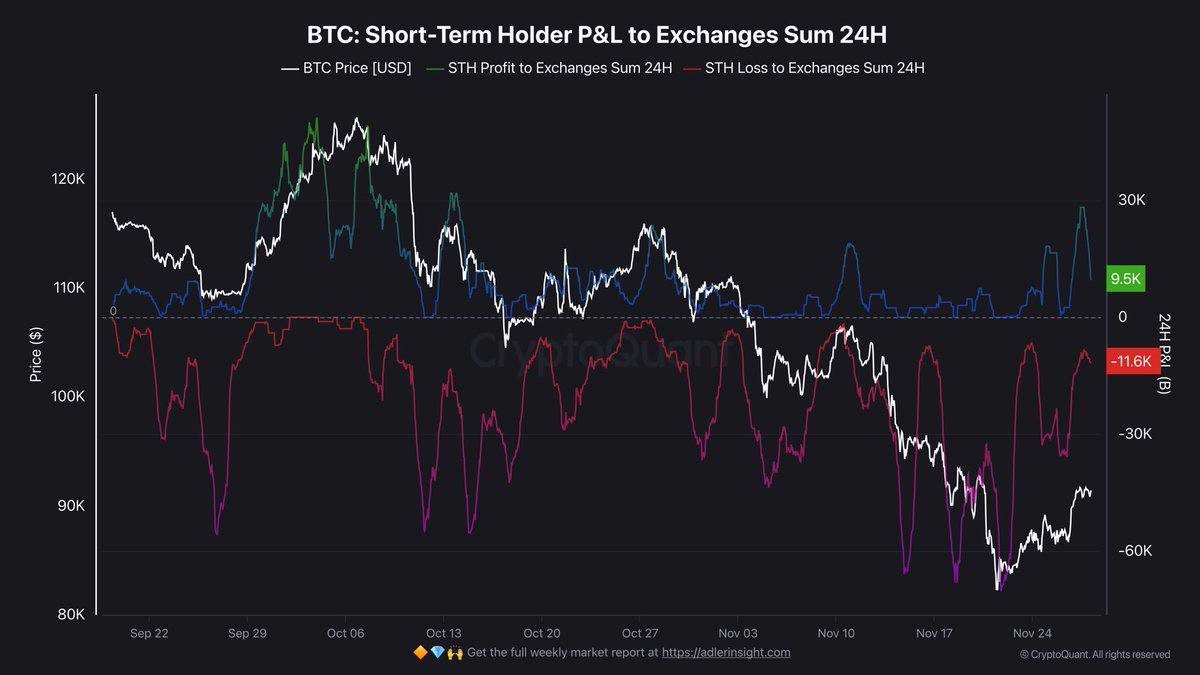
• Realised profit and loss normalising. After a period of heavy realised losses, the market appears to be shifting toward a more balanced regime, with fewer panic-driven exits and more orderly reallocation.
Seen together, these patterns reinforce the idea that the market is in an accumulation-heavy stage with a wide variety of participants gradually building or rebuilding exposure.
7. Implications for Market Structure and Liquidity
Another way to read the +100K BTC STH accumulation is through the lens of liquidity. Liquidity is not just about trading volume; it is about the willingness of holders to part with their coins at current prices.
When short-term holders were strongly negative on the net position metric, they provided ample liquidity to buyers. That was comforting for those accumulating but painful for those forced to sell. As the metric flips positive, the immediate availability of inexpensive coins decreases. New demand, whether from funds, individuals or corporates, must either persuade existing holders to sell at higher prices or accept a smaller position.
This dynamic can contribute to a phenomenon often seen in Bitcoin cycles: long stretches of sideways price action followed by sudden repricing when a relatively small incremental bid meets a constrained float. While on-chain data cannot predict the exact timing of such moves, it helps explain why they occur after seemingly quiet periods.
8. How Long Can High-Velocity Accumulation Last?
Historically, surges in STH net position have not lasted forever. They tend to be clusters rather than single spikes, often spanning several weeks or a few months, until one of two things happens:
- Price rallies enough to tempt profit-taking. Once short-term holders see sufficient unrealised gain, some of them naturally lock in results, pulling the net position metric back toward neutral or into negative territory.
- Macro or market conditions shift. A negative surprise can quickly transform accumulation into de-risking, especially among entities that rely on strict risk limits.
The current reading is still relatively fresh, which means the path forward is open. If macro conditions remain supportive and Bitcoin avoids sharp downside shocks, the positive accumulation trend could persist long enough to provide a durable foundation for a new trading range. If the environment worsens, the accumulated coins could instead become fuel for a new wave of volatility.
9. Educational Takeaways for Different Participants
For readers who are trying to understand what this all means in practical terms, a few high-level lessons stand out.
9.1 For long-term allocators
Short-Term Holder Net Position Change is a useful contextual tool rather than a timing mechanism. A historic +100K BTC increase suggests that the market may be transitioning from a defensive stance to a more constructive one, but it should be weighed alongside personal objectives, risk tolerance and diversification needs. The metric is most valuable when it confirms a broader view that the network’s fundamentals remain intact.
9.2 For active participants
Those who operate on shorter horizons can treat the indicator as a measure of crowd positioning. When short-term holders are aggressively accumulating, it can be a sign that the dominant positioning regime has flipped. However, relying on a single metric can be misleading; combining it with volume profiles, derivatives data and macro news flow generally leads to better-informed decisions.
9.3 For builders and observers
For developers, service providers and analysts, the metric underscores how important user behaviour is to the health of the ecosystem. A market where short-term participants are willing to step back in after volatility is a market with renewed confidence in the asset’s long-term relevance. That confidence can support continued innovation and infrastructure investment.
10. Final Thoughts
The recent surge of more than 100,000 BTC in the net holdings of short-term investors is one of the clearest signs yet that the Bitcoin market is not simply drifting lower; it is actively repositioning. Coins are moving into new hands at a rapid pace, and the group that had been distributing supply is now, at least for the moment, helping to absorb it.
As always, on-chain data should be treated as a map, not a prophecy. It cannot tell us exactly where price will be next week or next month. What it can do is reveal how different cohorts are behaving beneath the surface, offering a richer understanding of the forces shaping the current cycle.
Right now, that understanding points to a market in high-velocity accumulation mode, with short-term holders playing a surprisingly constructive role. Whether this becomes the foundation for the next sustained advance or simply another chapter in Bitcoin’s famously volatile history will depend on how those same holders react to whatever comes next.
Disclaimer: This article is for educational and informational purposes only and does not constitute investment, legal or tax advice. Digital assets are volatile and involve risk. Always conduct your own research and consult a qualified professional before making financial decisions.