6.7 Million BTC in Unrealized Loss: Reading the Stress Behind the 100K Battleground
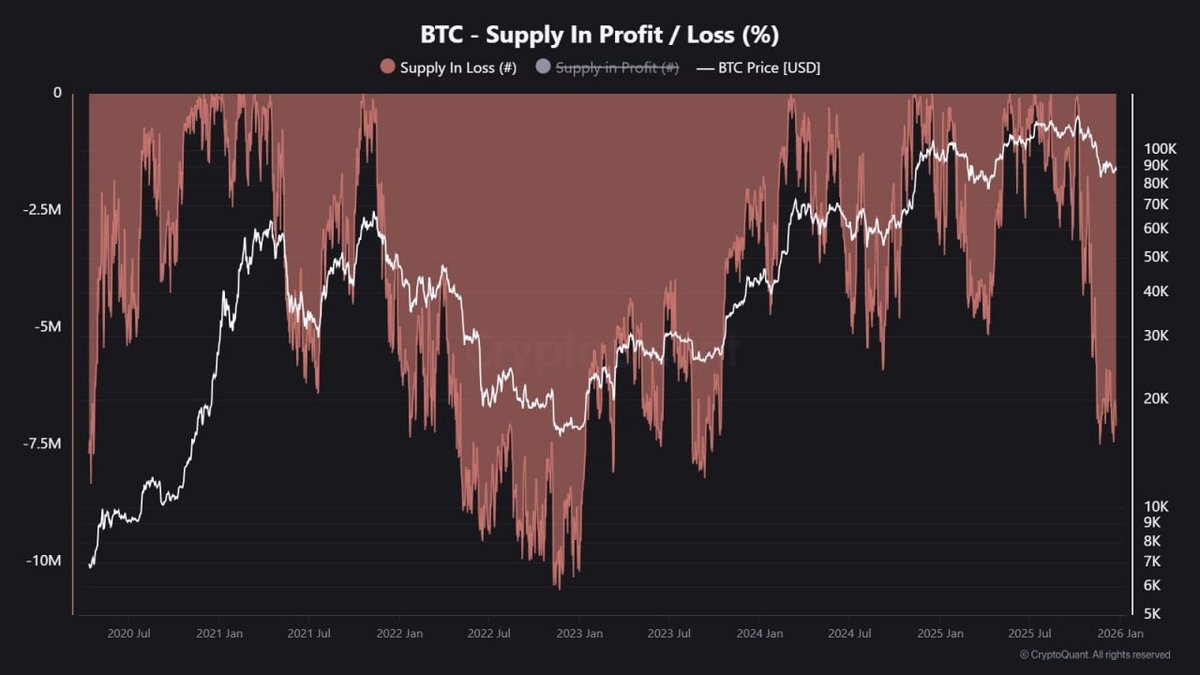
Bitcoin’s price action in this phase of the cycle looks deceptively calm from the outside. The chart moves between wide bands, headlines focus on round numbers like 100,000 USD, and social media swings between cautious optimism and fatigue. But on-chain data tells a much more nuanced story: around 6.7 million BTC are currently sitting at an unrealized loss, meaning they were acquired at prices higher than today’s level.
That is not a trivial number. With circulating supply slightly below 20 million BTC, we are talking about a substantial portion of all available coins being held under water. Even more importantly, a large share of these coins belongs to short-term holders (STH) – recent buyers who historically have a lower tolerance for drawdowns and are more likely to sell when price fails to recover quickly.
In this context, the 100K region becomes more than just a round milestone. It is a fault line in the current wave of the cycle, where unrealized losses, investor psychology and macro narratives intersect. Understanding how we arrived here – and what this on-chain picture implies – can help investors frame risk in a more realistic, less emotional way.
1. What the “Supply in Loss” Chart Is Really Showing
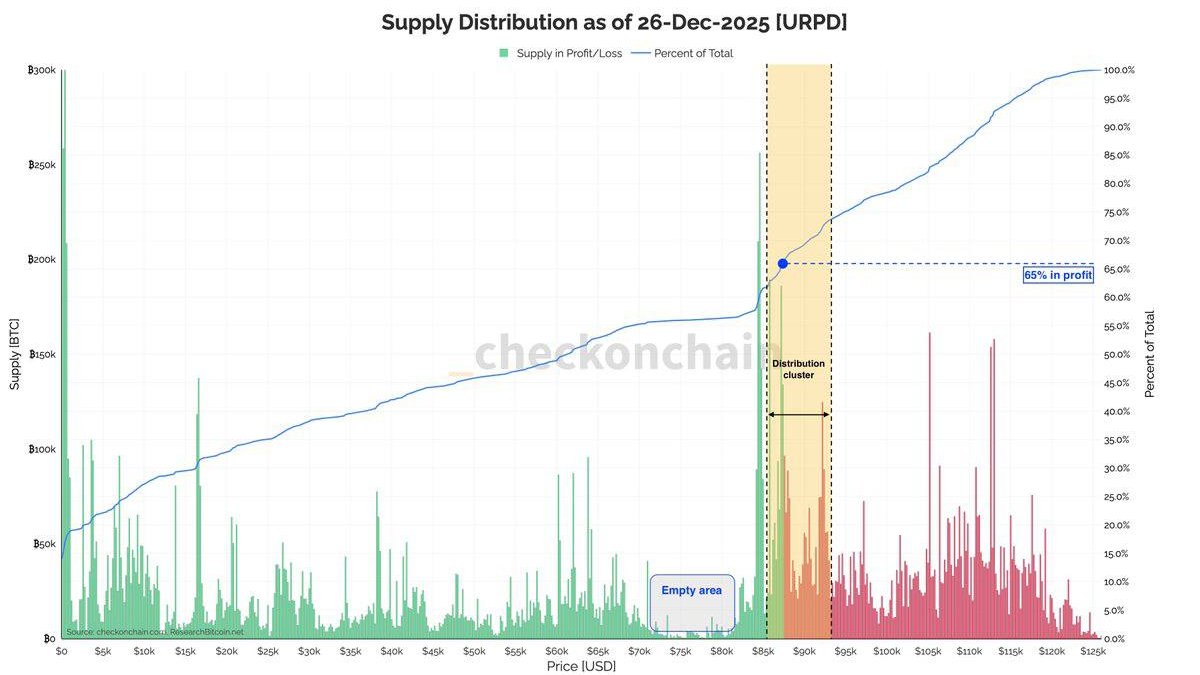
The chart in focus plots Bitcoin’s price (white line) against the amount of supply currently at a loss (red area). Each coin is tagged based on the price at which it last moved on-chain. If the current market price is below that level, the coin is counted as "in loss"; if above, it is "in profit". This does not mean holders are about to sell; it simply tracks the theoretical profit or loss if they did.
Over the past several years, the chart has followed a familiar rhythm:
- Late bear markets see a huge red overhang: many coins in loss, price depressed, sentiment weak.
- Strong uptrends gradually flip supply into profit as price pushes above old cost bases.
- Sharp corrections create local spikes in supply in loss, especially among investors who bought near the top of the preceding rally.
Today, we are somewhere between euphoria and despair. Price is far above the lows of previous bear markets, yet supply in loss has expanded again towards multi-million-coin territory. That combination – high absolute price but large unrealized losses – is a sign that a lot of capital arrived late to the party and is now being tested.
2. Who Owns the 6.7 Million BTC in Unrealized Loss?
Not all losses are created equal. To interpret the 6.7 million BTC figure, we need to separate two very different groups: long-term holders (LTH) and short-term holders (STH).
2.1 Long-term holders: slow to move, slow to panic
Long-term holders are addresses that have held their coins for a long period without moving them. Historically, this group tends to behave more like a savings cohort than an active trading cohort. They often accumulate during deep drawdowns, ignore short-term volatility and only realize gains gradually.
When a part of LTH supply moves into unrealized loss, it does not automatically translate into immediate sell pressure. Many of these investors acquired BTC at much lower prices years ago. Even if a recent top-up allocation is now under water, their overall position can still be positive. For them, a drawdown is uncomfortable but not existential.
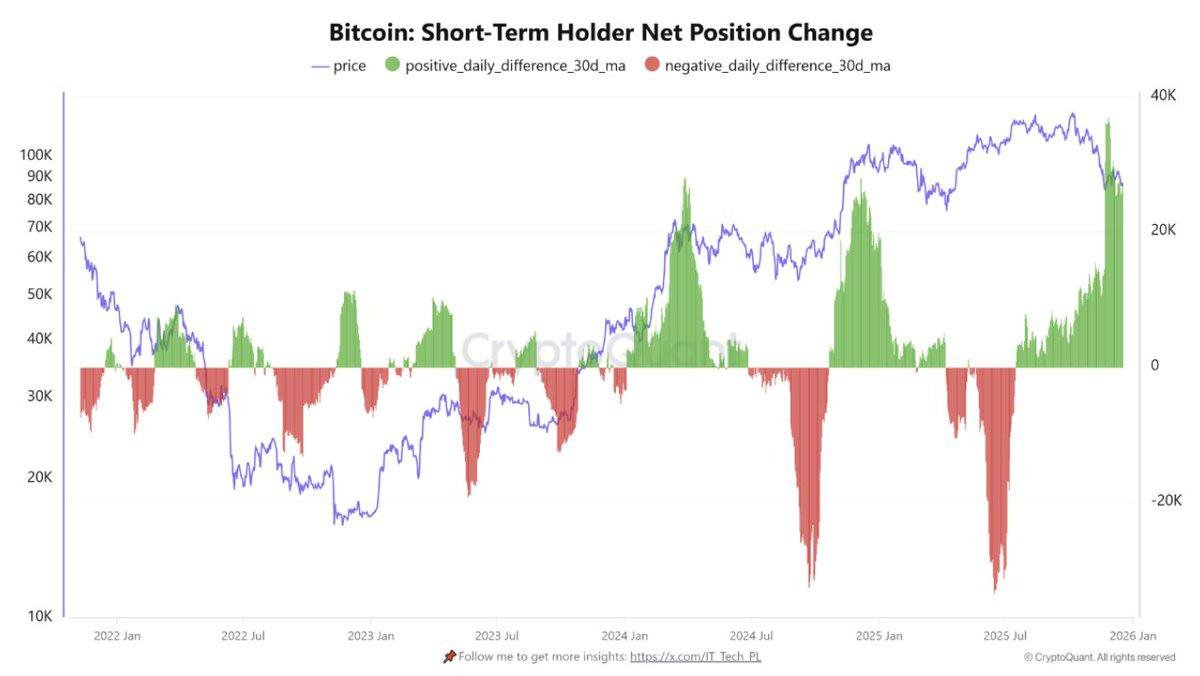
2.2 Short-term holders: the fragile edge of the cohort
Short-term holders, by contrast, are addresses whose coins have moved recently. This group tends to include late-cycle buyers, momentum chasers and speculative capital. Because their cost basis is closer to the current price, and their conviction often depends on recent performance, they are more sensitive to drawdowns.
On-chain segmentation suggests that a large fraction of the 6.7 million BTC in current unrealized loss sits in STH hands. Many of these coins were acquired near or above the 100K region and have not had time to "age" into the long-term cohort. That makes them a potential source of reactive supply: coins that could be pushed onto the market if holders lose confidence or are forced to de-risk.
This is why analysts often describe STH supply in loss as a kind of "fragility index". The more recent buyers are under water, the lower the collective pain threshold tends to be.
3. Why the 100K Region Matters So Much in This Wave
The current cycle has turned the 100,000 USD level into a symbolic anchor. It is not just a neat, round number; it also coincides with a dense cluster of realized prices where many STH entries are concentrated.
In practice, that means:
- When price trades above 100K, a large share of recent buyers are in profit. Sentiment tends to feel "validated", and selling pressure can ease as holders shift from fear to patience.
- When price trades below 100K, those same buyers flip into loss. Their conviction is tested; social feeds shift from celebration to doubt; and each further dip increases the temptation to exit and "wait for clarity".
On-chain, this shows up as a swelling red band of supply in loss whenever price slips under that zone. The more time we spend below 100K, the more these unrealized losses become emotionally salient. Some holders will endure, but others will prefer to realize a smaller setback now rather than risk a deeper one later.
That is why 100K is often described as a battleground level for this wave. It is not purely technical; it is where cost basis, expectation and narrative blend into one focal point.
4. What 6.7 Million BTC in Loss Implies for Market Structure
Having so many coins under water does not automatically mean a crash is coming. In fact, history shows that elevated unrealized loss can coexist with long consolidation periods, not just climactic capitulation. The key is how different cohorts respond.
4.1 Potential for forced selling and "overhead supply"
When recent buyers are in loss, there are two main risk channels:
- Discretionary selling. Individuals or funds might choose to de-risk voluntarily, whether to protect capital, meet redemptions, or simply reduce stress.
- Mechanical selling. If positions are leveraged or used as collateral, a continued drawdown can trigger margin reductions, redemptions from structured products, or automatic risk reduction at the platform level.
The result is a layer of overhead supply: coins that are likely to be sold on any sustained rally back toward their cost basis. This can create a "saw-tooth" pattern where each bounce off support is met by profit-taking from newly break-even holders, slowing the speed of recovery.
4.2 The slow transfer from weak hands to strong hands
The flip side is that these same unrealized losses can set the stage for healthier ownership over time. Historically, deep drawdowns lead to a gradual transfer of coins from short-term, emotionally driven holders to long-term, price-insensitive cohorts. Each time a discouraged buyer sells to a patient accumulator, the market’s structural resilience improves a little.
On-chain metrics often show this as a rise in the share of supply held for longer than six or twelve months after prolonged periods of volatility. Even if price action feels frustrating, the underlying ownership is quietly upgrading. From that perspective, the 6.7 million BTC currently in unrealized loss are not just a source of risk; they are also potential fuel for the next phase if they migrate into stronger hands rather than being shaken out at the worst possible moment.
5. Three Broad Scenarios Around the 100K Level
No one – human or algorithm – can predict which exact path Bitcoin will take around 100K. But on-chain data allows us to outline a few broad, conditional scenarios and the psychology that goes with them.
Scenario A: Swift reclaim of 100K
In this optimistic case, macro conditions stabilize, new capital flows in, and price pushes back above 100K relatively quickly. The effect on the 6.7 million BTC in loss is immediate:
- Many STH positions flip back into profit or at least near break-even.
- Some holders may use this relief to reduce exposure, but a meaningful subset will interpret the recovery as confirmation that the uptrend remains intact.
- Supply in loss shrinks, while supply in profit broadens across cohorts.
Here, on-chain data would likely show a sharp drop in unrealized loss alongside moderate realized gains – a sign that some holders captured relief exits but did not fully abandon the asset. For longer-term investors, such a move would support the thesis that the current drawdown was a mid-cycle stress test rather than the start of a structural reversal.
Scenario B: Extended sideways range below 100K
In a more neutral scenario, price oscillates below 100K for months. Volatility compresses, but the market never fully breaks down nor fully recovers. This is where psychological endurance becomes the main driver.
- Short-term holders gradually lose patience; some capitulate slowly, converting unrealized loss into modest realized loss.
- Long-term accumulators quietly absorb supply, lowering their cost basis and increasing their share of total holdings.
- Supply in loss remains elevated but starts to age, with more coins crossing the threshold into long-term cohorts.
From the outside, this period may look dull, even meaningless. From an on-chain perspective, however, it can be a powerful redistribution phase where the ownership structure becomes more robust while price takes its time.
Scenario C: Deeper correction and structural reset
In the more severe scenario, a combination of macro shock and internal de-risking pushes price significantly below current levels. Unrealized losses deepen; some holders are forced out; supply in loss spikes even higher before eventually collapsing as capitulation completes.
While uncomfortable, these phases have historically preceded some of Bitcoin’s strongest long-term rallies. The key difference between this and previous cycles is that macro sensitivity is now higher. Bitcoin behaves less like an isolated niche asset and more like a global macro asset that reacts to policy expectations and liquidity conditions. That means a deeper reset would likely be driven not just by crypto-specific events but by broader shifts in risk appetite.
6. What Individual Investors Can Take From This
For everyday participants, the main value of on-chain metrics like supply in loss is not to predict exact price targets, but to put their own situation into context.
6.1 You are not the only one under water
Seeing 6.7 million BTC in unrealized loss is a reminder that many others are in a similar position. Feeling "alone" in a drawdown can lead to rushed decisions. Realising that a large share of the market is experiencing similar stress can help normalize the experience and reduce the urge to react impulsively.
6.2 Time horizon and sizing matter more than entry perfection
If your time horizon is measured in weeks, then levels like 100K loom large because they control short-term mark-to-market results. If your horizon is measured in years, the key questions shift:
- Is your allocation sized so that a multi-year drawdown does not threaten your financial stability?
- Do you have a written plan for how you respond to volatility, rather than deciding in the heat of the moment?
- Are you comfortable with the idea that any high-growth asset can spend long periods below prior peaks?
On-chain data does not answer these questions for you, but it does highlight how common large unrealized swings are across the network.
6.3 On-chain metrics are lenses, not oracles
It is tempting to look at a chart where previous peaks in supply in loss lined up with major bottoms and assume that the pattern will repeat exactly. Reality is messier. Macro conditions, regulatory developments and market structure all change from cycle to cycle.
The healthiest way to use on-chain analytics is as a lens – a way to see where stress is building, where ownership is shifting, and how current conditions compare to prior episodes. It should complement, not replace, fundamentals, macro analysis and personal risk management.
7. Conclusion: Stress Today, Optionality Tomorrow
The fact that around 6.7 million BTC are currently sitting in unrealized loss tells us that this phase of the cycle is far from risk-free. Many recent buyers are under pressure; some will capitulate; and the 100K region acts as a psychological dividing line between validation and doubt.
At the same time, the data also shows a familiar pattern: stress builds, coins migrate from reactive owners to patient ones, and over time the network’s ownership base becomes more resilient. The future path of price will depend not just on Bitcoin’s internal dynamics but on interest rates, liquidity, and the broader appetite for risk across global markets.
For investors, the most constructive takeaway is not to fixate on a single level – whether 100K or any other – but to understand how their own behaviour interacts with these on-chain realities. Volatility is a feature of Bitcoin, not a bug. Whether that volatility becomes destructive or constructive depends largely on preparation, position sizing and the ability to stay anchored when numbers on the screen fluctuate.
In other words: the 6.7 million BTC in loss represent both today’s discomfort and tomorrow’s potential. How much of that potential each participant captures will be shaped less by perfect predictions and more by the quiet, unglamorous work of managing risk and expectations through the entire wave of the cycle.
Disclaimer: This article is for educational and analytical purposes only and does not constitute financial, investment or legal advice. Digital assets are volatile and may not be suitable for every investor. Always conduct your own research and consider consulting a qualified professional before making financial decisions.