Short-Term Holders Under Record Stress: Reading Bitcoin’s Latest On-Chain Signal
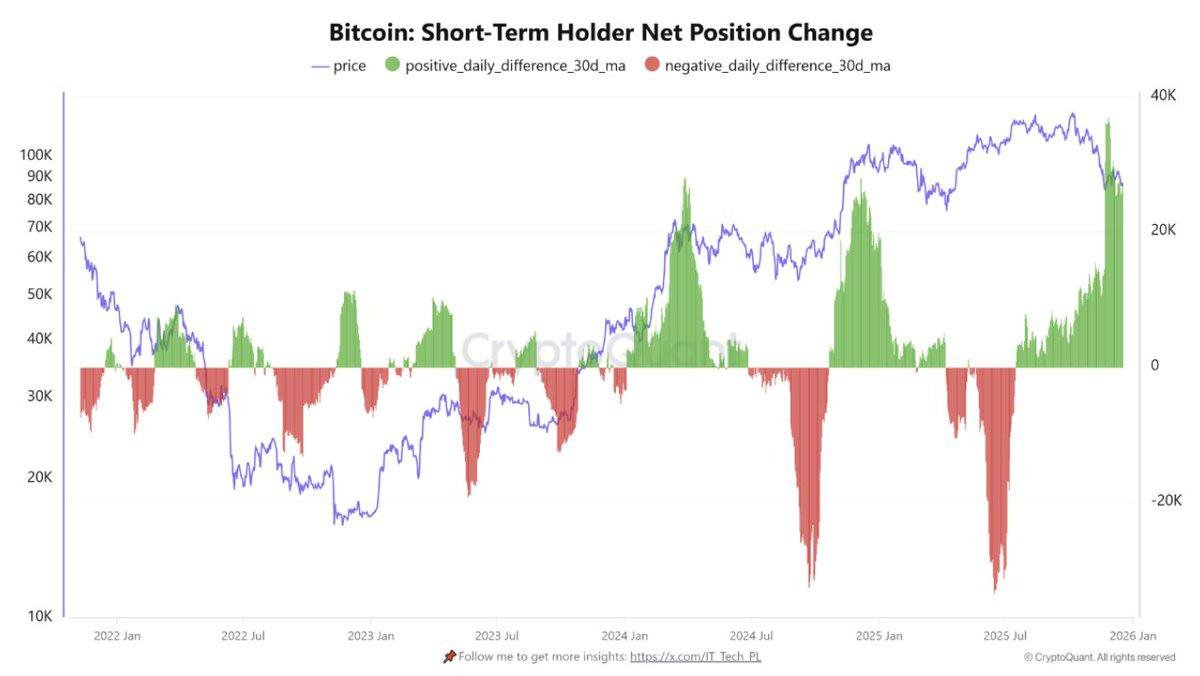
Short-term holders of Bitcoin are under intense pressure. On-chain data from CryptoQuant shows that the Short-Term Holder (STH) Realized Profit & Loss metric has plunged to some of the deepest negative levels ever recorded. In simple terms, a large share of coins held by recent buyers are now being sold at a loss, and that loss margin is wide.
At first glance, this looks purely bearish: if recent market entrants are realizing losses, does it mean the cycle is broken? History suggests a more nuanced story. Periods when STHs are firmly in the red and actively realizing those losses often coincide with phases of transfer — coins leaving the hands of short-term participants and migrating to investors with a longer time horizon and stronger conviction.
In this article we will break down what the STH cohort is, how the Realized Profit & Loss framework works, why the current readings are so extreme, and what that might mean for Bitcoin’s medium-term outlook. As always, this is not a price prediction, but an attempt to translate complex on-chain signals into an understandable narrative about risk, positioning and market structure.
1. Who Are Short-Term Holders And Why Do They Matter?
In most on-chain frameworks, Bitcoin holders are divided into two broad groups:
- Short-Term Holders (STH): coins that last moved on-chain within roughly the last 155 days.
- Long-Term Holders (LTH): coins that have not moved for longer than that threshold.
This split is not arbitrary. Historically, coins that survive more than five months without moving tend to become less sensitive to market noise. They are often held by investors with a thesis measured in years rather than weeks. By contrast, STHs as a group are more reactive: they include new buyers, short-horizon traders and participants who respond quickly to changes in sentiment.
Because of that composition, STH behavior often acts as the emotional barometer of the market. When prices rally strongly, STHs are typically the first to realize profits. When prices fall, they are the first to face stress, especially if they bought near recent highs. Their realized gains or losses therefore provide a window into which side of the emotional cycle the market is currently in — euphoria, complacency, anxiety or outright capitulation.
2. Realized Profit and Loss: From Price Chart To Behavior Chart
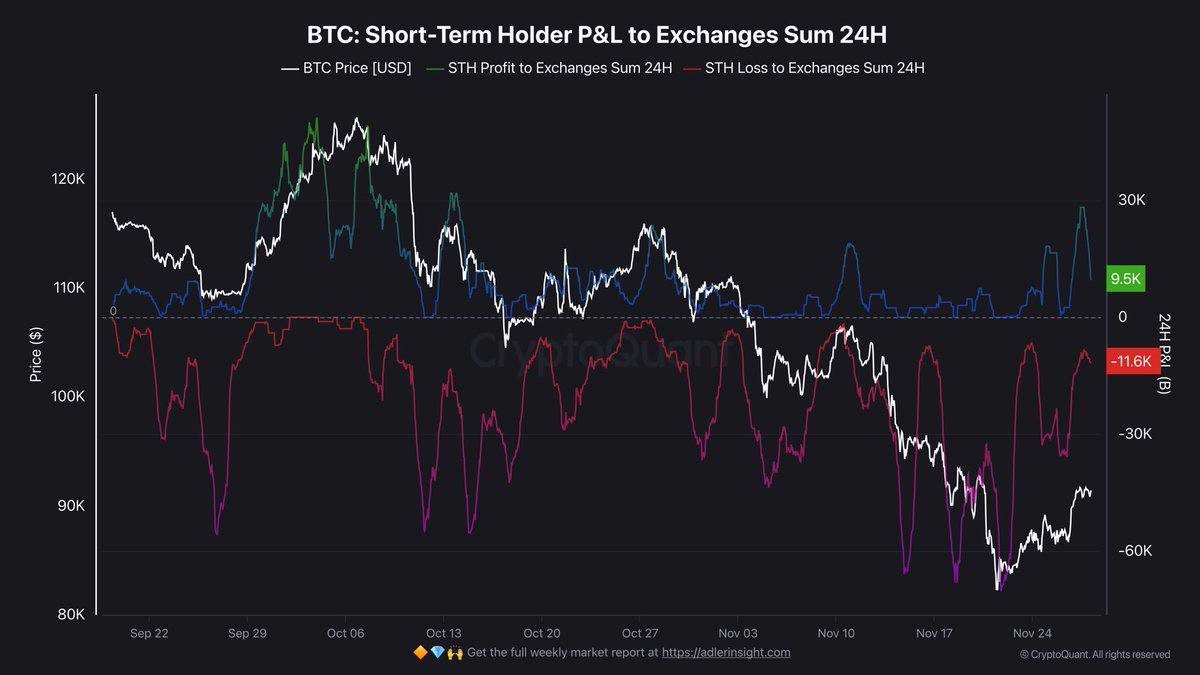
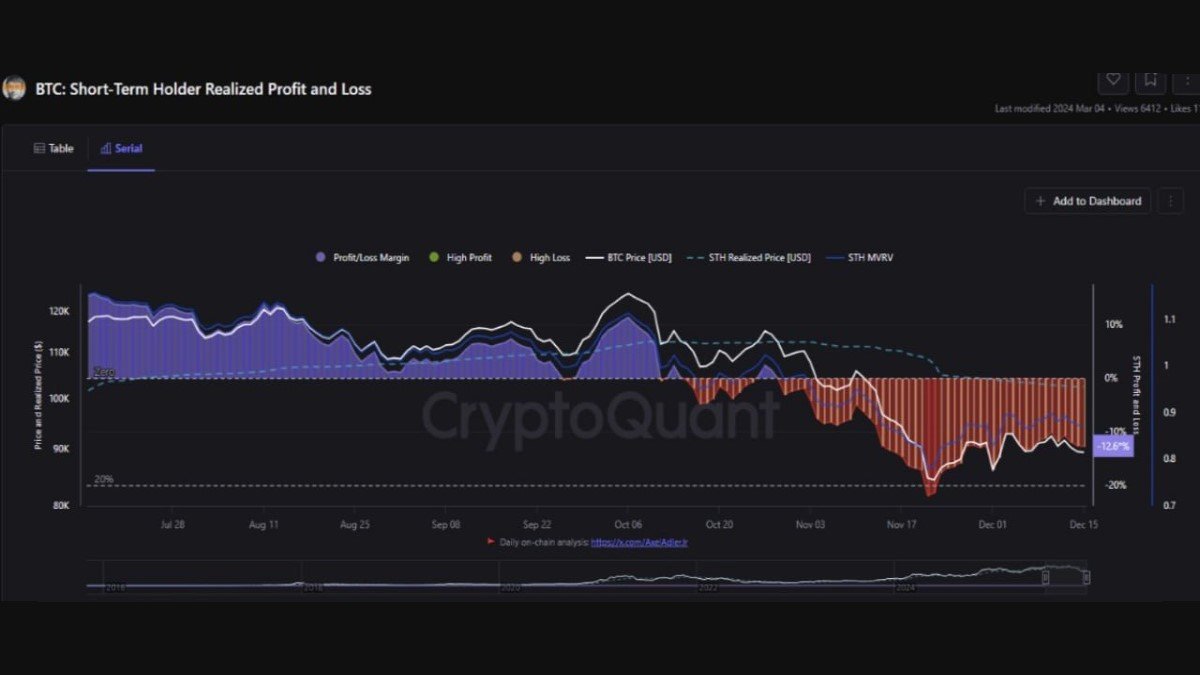
The chart you provided does not just show the spot price of Bitcoin. It overlays several on-chain metrics that track how STHs are actually realizing outcomes:
• BTC Price (black line): the familiar market price.
• STH Realized Price (dashed line): the average on-chain cost basis of short-term holders. When spot trades below this line, the cohort is, on average, sitting on unrealized losses.
• Profit/Loss Margin (colored bands): the difference between the price at which STH coins were acquired and the price at which they are being spent or sold now. Positive bars indicate realized gains; negative bars indicate realized losses.
• STH MVRV: a ratio comparing market price to STH cost basis, another way to estimate whether this cohort is in aggregate profit or loss.
Recently, the STH Profit/Loss Margin has been deeply negative, approaching levels around −10% to −15% on average. That means that when short-term holders move their coins, they are, in aggregate, locking in double-digit percentage losses relative to their recent entry price. The chart effectively visualizes a picture of pervasive stress among newer market participants.
3. Why Current STH Losses Are Historically Extreme
There are several reasons why analysts are paying attention to the latest reading:
1. Depth of realized loss: The magnitude of negative STH profit margin is near or at the worst levels for the current cycle. While past bear-market capitulations have seen even deeper losses, for this phase of the market it is unusually severe.
2. Duration of stress: STHs have been underwater for an extended period rather than just a brief spike. This suggests that attempts to “buy the dip” over recent months have not been rewarded yet.
3. Context of prior rally: Before entering this zone of stress, Bitcoin had delivered a strong advance, pulling many new participants in near higher prices. As the market retraced, those late entries quickly flipped into loss, creating a reservoir of uneasy supply.
When you combine these elements, you get a picture of a cohort that has been repeatedly tested. Many STHs now face a psychological choice: cut exposure and accept the realized loss, or hold on and hope for a recovery. On-chain, we can see that a meaningful share is indeed choosing to sell, crystallizing those losses.
4. Capitulation Or Just Routine Volatility?
A key analytical question is whether this episode represents a true capitulation event or simply another swing in an ongoing consolidation. To approach that question, it helps to look at how similar patterns unfolded in previous cycles.
Historically, deep negative STH realized profit margins often appear in late-stage bear markets or at the tail end of sharp corrections within larger bull trends. In both cases, they tend to line up with phases of distribution from STHs to LTHs:
- Short-term participants sell into weakness, either due to forced liquidations, stop-loss triggers or fatigue.
- Long-term participants, or new investors with a longer horizon, step in to absorb this supply, moving coins into wallets that historically show much slower turnover.
In other words, capitulation is less about a price level and more about a rotation of ownership. The coins themselves do not disappear; they simply change hands from those who are uncomfortable with volatility to those who are more prepared to tolerate it.
The current data fits that pattern reasonably well. While STHs are realizing losses at elevated levels, long-term supply metrics show relatively modest spending from older cohorts. Many LTHs are either holding steady or even adding during dips. That divergence is what analysts mean when they say that “STH stress is often the prelude to a healthier market structure.”
5. The Cleansing Mechanism: From Weak Hands To Stronger Hands
The phrase “cleansing” is sometimes used to describe what is happening in phases like this, but it is important to define it carefully. It does not mean that short-term participants are unimportant or that they always lose. Instead, it refers to a recurrent dynamic:
- Rising prices attract new capital and short-term positioning.
- As the move ages, leverage and expectations become elevated.
- A correction tests that positioning. Those with less conviction or tighter risk limits are the first to exit.
- Coins leave reactive hands and move to buyers who see value in lower prices and can tolerate longer holding periods.
This process can be painful for participants experiencing the losses, but it often leaves the market in a more resilient state. When a large share of the supply sits with holders who are already in profit and are comfortable with their thesis, there is less urgency to sell on modest volatility, which in turn can reduce downside reflexivity.
The latest STH readings suggest we are in the middle of exactly this type of structural rotation. The question for investors is not merely whether the price has bottomed, but whether ownership is transitioning in a way that sets the stage for a more sustainable next leg when macro conditions and liquidity align.
6. What This Means For Short-Term And Long-Term Narratives
From a short-horizon trading perspective, extreme STH loss realization can cut both ways. On the one hand, it signals acute selling pressure that may still need time to exhaust itself. On the other, once the bulk of forced or emotional selling is complete, markets sometimes experience sharp relief rallies as the imbalance of supply and demand flips.
For longer-term participants, the signal is more straightforward: coins are transitioning from weaker hands to stronger ones. If that transition continues and is accompanied by improving macro conditions, the groundwork is laid for a more durable uptrend later. However, there is no set rule that says such a transition must complete at any specific price level or date. Historical analogies are guides, not guarantees.
Several additional considerations are worth keeping in mind:
• Macro backdrop: Real interest rates, liquidity conditions and risk sentiment across broader markets still matter. On-chain strength cannot fully offset an environment where global investors are de-risking across the board.
• Derivatives positioning: Funding rates, open interest and options skew can amplify or dampen the effect of STH selling. For example, if many short-dated options are clustered around the current price, hedging activity may create additional volatility.
• Spot demand: Flows into spot exchange-traded products, corporate treasuries or other long-term vehicles can accelerate the rotation from STH to LTH by providing a consistent source of demand.
7. How Individual Investors Can Interpret The Data
For individual participants, the STH Realized Profit & Loss chart is best used as a contextual tool rather than a timing device. It can help answer questions such as:
- Is the market currently dominated by profit-taking or by loss realization?
- Are recent buyers in a comfortable position, or are they under stress?
- Is ownership rotating toward investors with longer time horizons?
However, the chart cannot tell you where the exact bottom is or how quickly a recovery might unfold. Trying to use it to pick a perfect entry often leads back to the kind of all-or-nothing decisions that long-term planning is meant to avoid. A more constructive use is to align it with your own strategy:
- If you are a long-horizon participant, deep STH losses may indicate that the market is in a phase where systematic accumulation, with proper risk management, could be more attractive than during euphoric rallies.
- If you operate on shorter time frames, the same data can act as a reminder that volatility tends to be higher around stress points, and position sizing should reflect that reality.
In both cases, the central takeaway is that market structure matters. Who holds the coins, at what price, and with what emotional profile can be as important as any single macro headline.
8. The Human Side Of On-Chain Metrics
It is easy to view on-chain charts as cold, mechanical indicators. In reality, every bar in the STH Profit/Loss metric represents a human decision somewhere in the world: someone choosing to accept a loss, to lock in a gain or to move their coins for a particular reason. When we see a wall of red bars, we are looking at a crowd of participants deciding, one by one, that they no longer wish to hold at their previous cost basis.
For the ecosystem, this kind of capitulation can be healthy. It reminds participants that markets move in cycles, that drawdowns are part of those cycles, and that risk management is not optional. For the individuals experiencing the losses, it can be a lesson that shapes how they approach the next cycle: more gradual position sizing, clearer time horizons, and a focus on fundamentals rather than only on price momentum.
9. Conclusion: Stress Today, Foundation For Tomorrow?
The current state of Bitcoin’s Short-Term Holder Realized Profit & Loss tells a clear story: recent buyers are under heavy stress and many are crystallizing losses. By historical standards, the pressure is intense, and it has persisted long enough to qualify as a genuine cleansing phase rather than a minor shake-out.
At the same time, long-term holders appear comparatively resilient, and there are signs that supply is migrating from more reactive wallets to those with a longer time preference. If that process continues, it can leave the market with a sturdier ownership base, better prepared for a future uptrend when macro conditions and liquidity turn more favorable.
No indicator can forecast the exact path of prices, and this analysis is not a prediction that a bottom is already in place. Instead, the message from the data is structural: the distribution of pain, the direction of coin flows and the gradual reshaping of who holds Bitcoin today. For thoughtful investors, those elements are just as important as any short-term price movement.
Disclaimer: This article is for educational and analytical purposes only and does not constitute financial, investment, legal or tax advice. Digital assets are volatile and involve risk. Always conduct your own research and consult with qualified professionals before making investment decisions.