Hash Ribbons Just Flashed a Buy: What Miner Capitulation Really Tells Us About Bitcoin Cycles
Every market cycle develops its own set of reference points. For Bitcoin, one of the more widely watched on-chain tools is the Hash Ribbons indicator—a way of reading the health of the mining network through the interaction of short- and long-term hash rate trends. When the indicator’s conditions are met, it is said to have triggered a “buy” label. That label has just appeared again.
The narrative that usually follows is simple: smaller miners are struggling, hash rate is contracting, and the weakest participants are forced to unplug machines or sell reserves. Once that process runs its course and hash rate begins to recover, previous cycles suggest that the worst of the downturn may be behind us. For long-term observers, this is often framed as a potential accumulation window rather than a moment for short-term speculation.
But what does this really mean in economic terms? Why should the troubles of mining businesses tell us anything reliable about the broader market? And how confident can we be that the next few years will rhyme with the past?
To answer those questions, we need to look beyond the indicator itself and understand the mechanics underneath it.
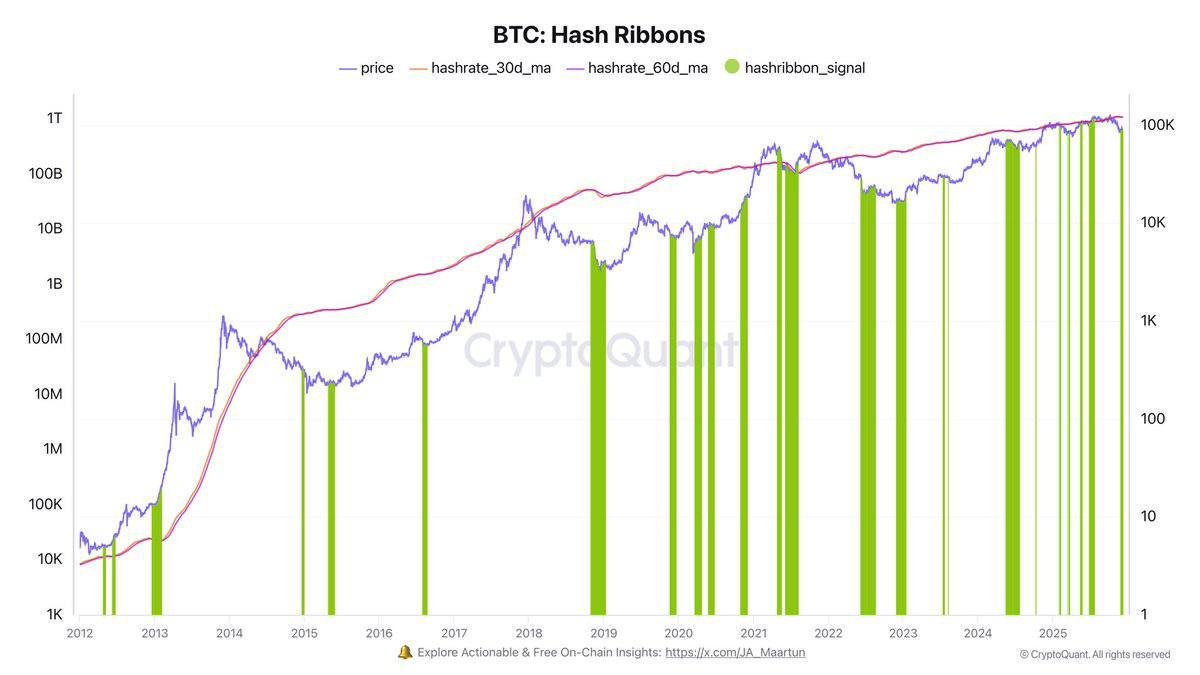
1. How Hash Ribbons Work – And What They Are Actually Measuring
Hash Ribbons are built from two simple components:
- A short-term moving average of Bitcoin’s hash rate, often calculated over 30 days.
- A longer-term moving average, commonly around 60 days.
When the short-term line falls below the longer-term line, it indicates that network computing power is contracting. If this persists, it is usually interpreted as a sign that miners are under economic pressure, with less efficient operations switching off because their revenue can no longer cover costs such as electricity, cooling, staff and hardware financing.
After a period of sustained decline, two things can happen:
- The price recovers, making mining profitable again at existing difficulty levels.
- Enough miners disconnect that network difficulty adjusts downward, allowing the remaining miners to earn more BTC per unit of hash rate.
When hash rate stabilises and the short-term moving average moves back above the long-term average, the Hash Ribbons logic considers the capitulation phase “over”. At that moment, the indicator prints its well-known buy label.
In essence, Hash Ribbons is not magic. It is a visual summary of the following story:
“Mining became unprofitable for a meaningful number of participants. They switched off or sold coins. After that wash-out, the network began to heal. Historically, the end of that healing process has often coincided with attractive long-term entry points.”
2. Miner Economics: Why Capitulation Can Mark Exhaustion
To understand why this pattern might connect with market lows, it helps to look briefly at the business model of a mid-sized miner.
A typical operation finances hardware and infrastructure upfront, then faces largely fixed monthly costs: electricity contracts, hosting fees, maintenance, salaries and debt service. Revenue, by contrast, is variable and depends on three moving parts:
- The Bitcoin price.
- The network difficulty, which determines how many coins a given hash rate earns.
- The block subsidy and transaction fees.
When price falls sharply or difficulty rises quickly, revenue can drop below all-in costs. Large, well-capitalised miners may choose to ride out the downturn, using cash reserves or hedging programs. Smaller miners—especially those using older hardware or paying high electricity rates—have fewer options. They are often forced to sell a significant portion of their BTC inventory just to meet bills. If conditions stay poor, they eventually switch off machines entirely.
This combination of forced selling and network contraction is what analysts refer to as miner capitulation. It is a painful process for the operators involved, but it has two important side effects for the market:
- It increases short-term sell pressure as struggling miners liquidate reserves.
- It gradually removes structurally weak supply from the network, because only the most efficient and well-managed operations remain.
Once this adjustment is complete, any improvement in demand—whether from spot buyers, ETFs or long-term allocators—acts on a supply base that is leaner and less prone to distress sales. That is why periods following miner capitulation have often seen strong performance over multi-month horizons.
3. Historical Context: How Reliable Has the Indicator Been?
Looking back through previous cycles, Hash Ribbons buy labels have appeared near several key turning points:
- During the 2015 bear-market bottom, following a prolonged decline that drove many early miners offline.
- In late 2018 and early 2019, when a rapid price drop compressed margins and led to a visible hash-rate contraction.
- In mid-2020, after the halving event and pandemic-driven volatility, when weaker miners again exited and difficulty adjusted.
- After the 2022 downturn, when a combination of falling prices and rising energy costs pushed marginal operators into distress.
In each of these cases, the indicator flashed its buy label after the worst of the drawdown but before the major portion of the subsequent multi-year advance. That track record is why many long-term investors pay attention when Hash Ribbons turns constructive again.
However, it is important to acknowledge two points:
- The indicator has also produced false or early positives—periods when the market rallied for a time before revisiting lower prices later in the cycle.
- Bitcoin’s mining landscape is evolving. The presence of industrial-scale facilities, access to sophisticated hedging tools, and geographic shifts in energy sourcing all mean that future capitulation patterns may not look exactly like past ones.
In other words, Hash Ribbons offer a useful lens on the state of miners, but they do not provide a guarantee. They are best treated as one piece of a broader mosaic that includes macro conditions, liquidity, derivatives positioning and adoption trends.
4. Why the Latest Buy Label Matters – And What It Doesn’t Tell Us
With that context, what does the latest Hash Ribbons trigger actually signal?
4.1 Evidence of a Completed Stress Phase in Mining
The first and most direct interpretation is that the network has just passed through a period in which a meaningful group of miners were under pressure. Operating at breakeven or worse, some of them sold reserves or shut down machines. Hash rate fell enough for the short-term moving average to break below the long-term trend, then recently recovered to the point that the short-term line is now crossing back above.
This pattern suggests three things:
- The most fragile operations are likely already gone—or significantly downsized.
- Those remaining on the network tend to be better capitalised and more efficient, having survived the stressful period.
- The intensity of miner-driven sell pressure may be easing, because operators no longer need to liquidate as much inventory just to cover costs.
From a structural standpoint, that is a healthier foundation for any future recovery than a market where many miners are still one price move away from distress.
4.2 No Precise Timing For Short-Term Price Moves
What the indicator does not provide is a precise timing tool for short-term trading. Even after past buy labels, Bitcoin has often experienced weeks or months of sideways movement and occasional retests of prior lows. Market participants who assumed that Hash Ribbons marked an immediate, straight-line advance frequently found themselves tested by volatility.
The reason is simple: miners are only one group in a much larger ecosystem. ETF flows, macro data, central-bank decisions, derivatives positioning and broader risk sentiment can all overshadow the incremental effects of miner behaviour in the short run. Hash Ribbons can tell us that a specific source of structural sell pressure is likely subsiding; it cannot forecast every macro shock or liquidity squeeze that might affect price.
4.3 The Role of Expectations and Narrative
Another subtle point is that the popularity of the indicator can influence behaviour. When enough participants expect a certain pattern to hold, some may act in anticipation, buying earlier, selling later or adjusting hedges based on the historical template. That can change how future episodes play out.
For example, large miners and professional investors who are aware of Hash Ribbons may choose to adjust treasury management policies proactively, smoothing out the extremes of capitulation. Over time, such adaptation can reduce the sharpness of the signals, making them less dramatic but possibly more stable.
5. An Educational Framework: How To Use Miner Metrics Responsibly
Given both the strengths and the limitations of Hash Ribbons, how might a thoughtful observer incorporate this information into their understanding of Bitcoin’s cycle?
5.1 Start With the Economic Story, Not the Chart
Rather than focusing only on the indicator’s coloured bands, begin with the underlying narrative:
- Are energy prices high or low in major mining regions?
- Has the network recently passed through a halving or a rapid difficulty rise?
- Are miners publicly reporting financial stress or, conversely, expansion plans?
Answering these questions makes it easier to see whether the latest buy label is capturing a real economic shift or simply a brief fluctuation in hash rate.
5.2 Combine With Multiple Time Horizons
Hash Ribbons are inherently a slow indicator, built on moving averages. They align best with long-term strategies that focus on multi-year horizons. Observers who work on shorter timeframes may want to combine miner metrics with:
- Liquidity data, such as exchange order books and derivatives funding rates.
- Macro indicators, including real interest rates, credit spreads and equity-market volatility.
- Adoption metrics, like active addresses, transaction volumes and institutional product flows.
When several of these dimensions converge—for instance, when miner stress is easing, ETFs are seeing steady inflows and macro conditions are supportive—the case for a durable cycle bottom becomes stronger than when Hash Ribbons alone are flashing green.
5.3 Maintain Risk Management and Diversification
Perhaps the most important educational takeaway is that no indicator, however well-known, should replace basic risk management. Historical performance of Hash Ribbons can inform expectations, but it cannot eliminate uncertainty. Allocations to Bitcoin or any other asset should consider overall portfolio construction, time horizon, and personal risk tolerance.
In practical terms, that means:
- Avoiding decisions based solely on a single on-chain metric.
- Recognising that even if a long-term bottom is forming, shorter-term drawdowns and volatility are still possible.
- Understanding that Bitcoin remains a relatively young, evolving asset whose behaviour may change as regulation, technology and adoption progress.
6. Looking Ahead: What This Episode Reveals About Bitcoin’s Maturation
One of the most interesting aspects of the current Hash Ribbons buy label is the environment in which it is occurring. Unlike earlier cycles, today’s market includes:
- Spot ETFs that hold large pools of BTC on behalf of both retail and institutional investors.
- Industrial-scale miners operating in diverse jurisdictions, some with access to structured financing and power agreements that did not exist a few years ago.
- More sophisticated treasury policies at listed mining firms, which may include hedging, pre-funded expansion and flexible sell programs.
These changes mean that miner capitulation is no longer just a story about small operators with a handful of machines. It is also about how large, professionally managed organisations navigate energy markets, regulation and capital markets. The fact that Hash Ribbons can still detect meaningful stress and recovery in this more complex environment suggests that the indicator is capturing something fundamental about the link between price, difficulty and economic incentives.
At the same time, the presence of institutional participants on both the mining and investment sides adds layers of feedback that earlier cycles did not have. For instance, if ETFs and long-term funds step in to accumulate during periods of miner selling, market bottoms may become less extreme but more prolonged. Conversely, if macro conditions remain challenging and institutional flows soften, a completed miner capitulation may be necessary but not sufficient for a strong recovery.
Conclusion
The latest Hash Ribbons buy label is a meaningful data point: it suggests that Bitcoin’s mining network has just passed through a phase where weaker operators were forced to retrench, and that the remaining set of miners is operating on a healthier footing. Historically, similar episodes have often aligned with attractive long-term entry zones.
However, the indicator is not a crystal ball. It does not promise an immediate price surge or protect against further volatility. Instead, it serves as one lens among many—highlighting the economic reality that underpins Bitcoin’s security model and reminding us that behind every block are businesses balancing revenue, costs and risk.
For thoughtful observers, the right reaction is neither blind enthusiasm nor complete dismissal. It is to note that a key measure of miner stress has begun to improve, to place that observation alongside macro and market data, and to continue approaching Bitcoin as a complex, evolving system rather than a simple line on a chart.
Disclaimer
This article is for educational and analytical purposes only and does not constitute financial, investment, legal or tax advice. The discussion of indicators such as Hash Ribbons is intended to explain how some market participants interpret on-chain data, not to recommend any specific strategy or timing. Digital assets can be volatile and may not be suitable for every investor. Readers should conduct their own research, consider their financial circumstances and risk tolerance, and consult qualified professionals before making any financial decisions.