Bitcoin at the Supply Cost Basis Crossroads: Bounce or Breakdown?
Markets often look calmest just before they make their biggest decisions. Over the last two weeks, Bitcoin has dropped hard, then settled into a narrow range above a valuation level known as the True Market Mean – a blended estimate of what actively traded coins were paid for, excluding miner reserves. On the surface, price action now appears to be stabilising, but under the hood a cluster of on-chain indicators is flashing that the market is standing at a genuinely important crossroads.
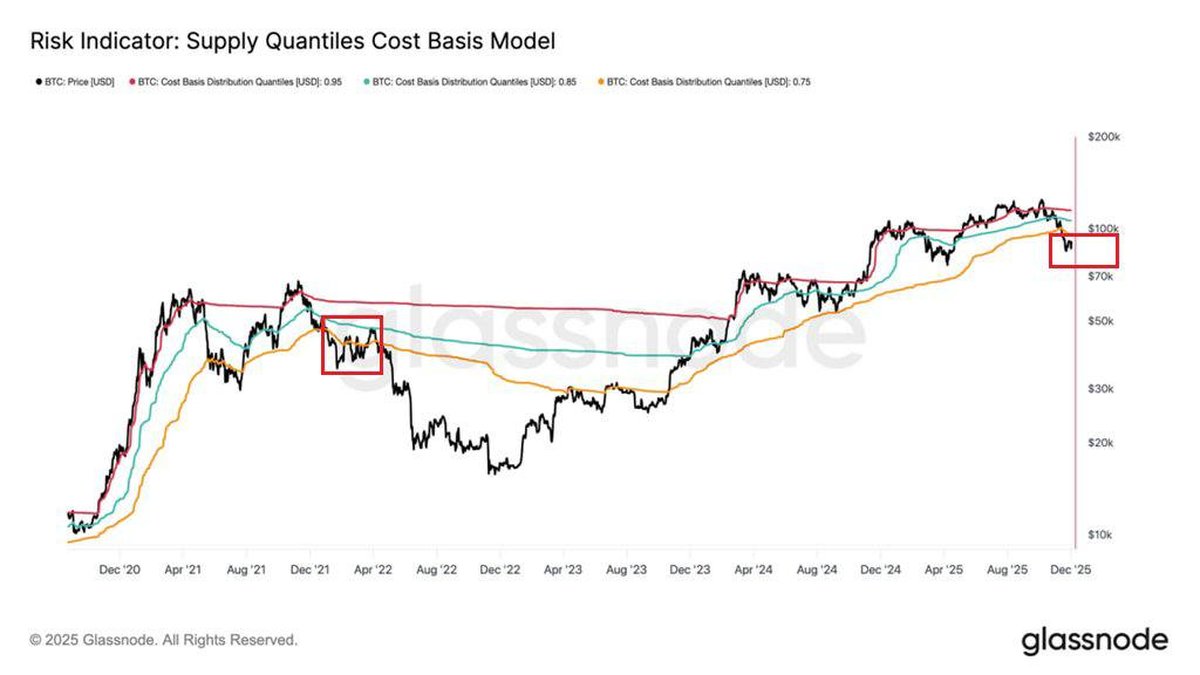
The latest readings from the Supply Quantiles Cost Basis Model put spot BTC in a tight corridor between two key bands. Since mid-November, price has slipped below the 0.85 quantile and is now hovering just over the 0.75 band, around 93,600 USD. In practical terms, this means more than 25% of circulating supply is currently held at an unrealised loss. The last time this pattern appeared with this configuration was in early 2022, shortly before a sharp shift from a choppy range into a full downtrend.
Does that automatically mean a repeat of 2022 is locked in? Not necessarily. But it does mean we are in one of those rare windows where structural positioning, investor psychology and macro events are tightly intertwined. In this piece we unpack how the cost-basis bands work, why the 0.75 and 0.85 levels are so important, and what different paths the market could take from here.
1. True Market Mean and Cost Basis Bands – A Quick Primer
Before diving into the current setup, it is worth clarifying the terminology.
On-chain data providers often talk about realised price – the average on-chain acquisition cost of the entire Bitcoin supply. The True Market Mean used in this model is more granular. Rather than treating all coins as equal, it aims to focus on the subset of BTC that is actively circulating, excluding miners and very old coins that rarely move. This produces a cost-basis estimate that is more closely aligned with the behaviour of traders and investors who actually set price day to day.
The Supply Quantiles Cost Basis Model then takes this one step further. Instead of giving a single average, it divides circulating supply into quantiles based on cost basis – essentially ranking all coins from cheapest to most expensive and drawing boundaries at points like 25%, 50%, 75% and 85%. Each band can be thought of as a 'layer' of investor cohorts:
- The lower bands represent long-standing holders who accumulated at much lower prices.
- The 0.75 quantile marks the cost basis below which about 75% of supply sits in profit; above it, 25% is at risk of being underwater.
- The 0.85 quantile marks a higher threshold: if price trades above this line, only the top 15% of costliest coins are in pain; below it, a much larger share begins to feel stress.
On the chart you can see these bands as smooth coloured curves under the black price line. When Bitcoin is advancing strongly, price tends to sit comfortably above the upper bands. During major corrections, it slices back down through them, turning once-comfortable holders into stressed ones in a matter of days.
2. The Recent Drawdown: Testing the True Market Mean
The last fortnight has delivered exactly that kind of slicing move. From its local highs, BTC sold off rapidly, eventually finding support around the True Market Mean – the point at which the average active participant was more or less flat on their position. Historically, this line has acted as a key decision zone:
- In resilient bull phases, dips toward the True Market Mean are bought aggressively. Price may wick below intraday, but buyers step in quickly, treating the level as a fair-value anchor.
- In transition phases, the line is tested repeatedly as the market debates whether previous valuations were too optimistic. Volatility expands, and these tests can drag on for weeks.
- In full downtrends, price eventually breaks and stays below, signalling that the average active cost basis is now above current market value.
Right now, BTC sits in the middle category. The first test of the True Market Mean has held, but the rebound has been modest and fragile. That by itself would already justify caution. When we overlay the quantile bands, the picture becomes even sharper.
3. A Quarter of Supply in the Red: Why the 0.75 Band Matters
Since mid-November, spot BTC has repositioned below the 0.85 cost-basis band and is currently fluctuating just above the 0.75 band, near 93,600 USD. This has two important consequences.
First, it means that roughly one quarter of circulating supply is now held at an unrealised loss. These are mostly coins acquired in recent months, often by participants who entered during the optimistic phase when BTC traded well above six figures. When their cost basis sits above spot, they face a classic dilemma: accept a realised loss now, or hold and hope for a recovery.
Second, as that share of underwater supply grows, the market’s sensitivity to shocks increases. Several feedback loops can emerge:
- Stop-losses and risk limits. Shorter-horizon traders may have strict drawdown thresholds. When these are breached, they reduce risk mechanically, adding to sell pressure.
- Portfolio rebalancing. Institutional allocators often target fixed percentage weights. If BTC underperforms other assets, their rules may instruct them to trim positions to rebalance.
- Sentiment shifts. The emotional impact of being underwater tends to magnify reactions to news. Negative headlines can trigger outsized responses when a large cohort is already on edge.
The net result is a structure that may appear stable for several sessions, yet can react quickly if a strong external impulse arrives.
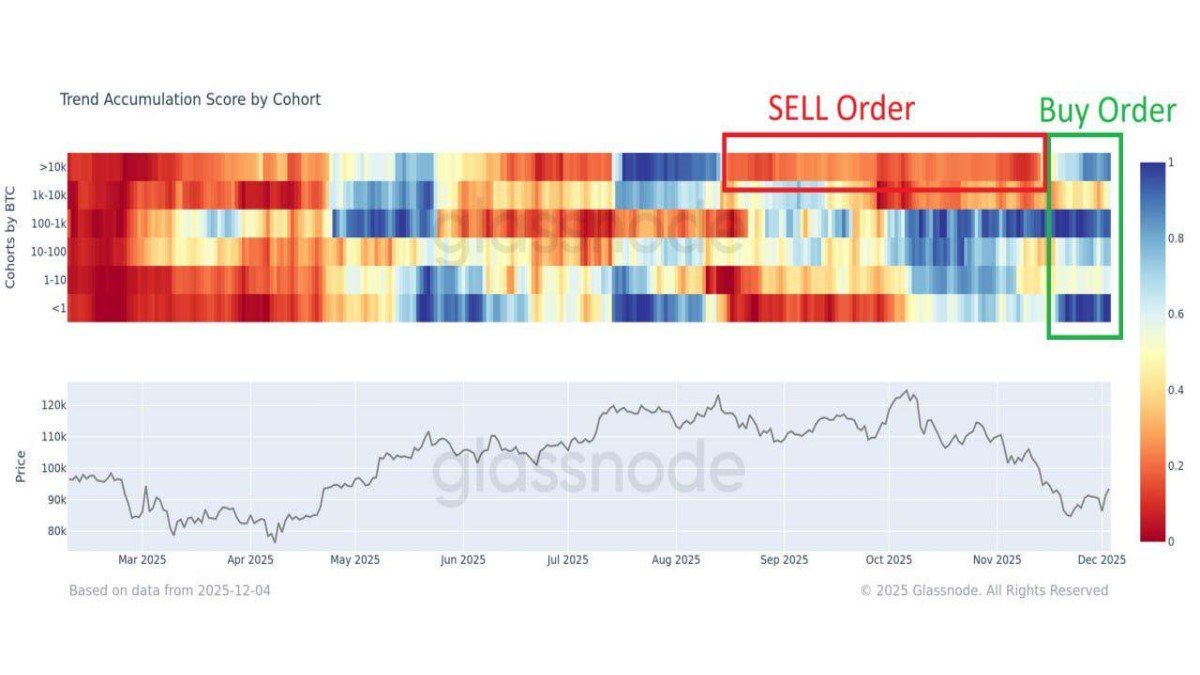
4. Echoes of Q1 2022 – Similar, but Not Identical
On the left side of the Glassnode chart, a red box highlights the period from late 2021 into the first quarter of 2022. The resemblance to today is striking. In that earlier episode:
- Bitcoin had already topped and was chopping sideways after a strong advance.
- Price oscillated around the upper cost-basis bands, occasionally reclaiming the 0.85 line but failing to hold it for long.
- Each failure pulled more of the supply into an unrealised loss, until a decisive breakdown dragged BTC well below the True Market Mean and into a prolonged bear market.
The current highlighted region on the right shows a similar dance. Price is again interacting with the upper bands from above, with a noticeable inability—so far—to climb back into a clean, high-profit regime. Positioning is becoming more fragile, not less.
However, it would be overly simplistic to assume that history must repeat point-for-point. There are several key differences relative to 2022:
- Institutional vehicles are more mature. Spot ETFs, listed trusts and regulated custody have grown significantly. This can both stabilise demand and, at times, concentrate risk.
- Macro policy is in a different phase. Back then the market was adjusting to a rapid sequence of rate hikes and the start of balance-sheet reduction. Today the discussion is more about when and how quickly to ease conditions after a long tightening cycle.
- The investor base has broadened. A larger share of supply now sits with long-term holders, companies and funds whose decision horizons can span multiple years.
These factors do not eliminate the risk of a deeper drawdown, but they can change its shape and speed. The most useful takeaway from the Q1 2022 comparison is not that 'a crash is guaranteed,' but that markets can spend months in a fragile equilibrium before finally choosing a direction. Cost-basis bands help make that fragility visible.
5. Why the 0.85 Band Around 106,200 USD Is the Key Battleground
If the 0.75 band tells us how many coins are under water, the 0.85 band – currently near 106,200 USD – tells us where the market would need to trade to put the majority of stressed supply back into profit. Reclaiming this level would have several positive implications:
- Underwater supply would shrink. A move above the 0.85 line would lift a large share of recent buyers back into at least marginal profit territory, reducing the urge to exit at any price.
- Market confidence would improve. Traders often view these bands as dynamic support and resistance. Turning a lost band back into support is a strong technical and psychological signal.
- Volatility could compress. With fewer participants in distress, price swings driven by forced selling or panic would likely moderate.
Conversely, if BTC continues to trade below the 0.85 band—or if repeated attempts to reclaim it are rejected—then the market is effectively confirming that current valuations are still too heavy for the existing demand. In that scenario, the True Market Mean can morph from a temporary foothold into a trapdoor.
6. Macro Sensitivity: The FOMC Wildcard
The timing of this on-chain configuration matters because it coincides with a crucial macro backdrop. The Federal Reserve has recently ended its balance-sheet tightening program, easing one important headwind for risk assets. Liquidity is no longer being withdrawn at the same pace, and many investors interpret this as an early sign that the most restrictive phase of policy may be over.
However, the market is still highly sensitive to the exact path of future rates. The upcoming FOMC meeting will update projections, guidance and tone. In a world where one quarter of Bitcoin’s supply is in unrealised loss and spot price is hovering just above the True Market Mean, even subtle changes in language can have outsized effects:
- A more supportive stance – emphasising patience and the possibility of easing next year – could encourage value-oriented buyers to add exposure, helping BTC attempt a move back toward the 0.85 band.
- A more cautious stance – hinting at persistent inflation risks or the need for higher-for-longer rates – could reignite risk aversion, pressuring both equities and crypto simultaneously.
This is what analysts mean when they say the current setup is 'macro-sensitive.' The on-chain structure does not dictate the direction of the next big move, but it tells us the starting conditions: a market with elevated unrealised losses is more reactive, whichever way the macro wind blows.
7. The Liquidation Risk: How Derivatives Interact With Cost Basis
On-chain cost-basis models focus on spot supply, but the broader Bitcoin ecosystem also includes a large derivatives market. When spot price hovers near major valuation bands, derivatives positioning can act as an accelerant:
- If many traders are using leverage with entry points near the 0.75 band, a break below can trigger forced position closures.
- These closures feed back into spot markets, pushing price further away from the band and potentially setting off additional rounds of deleveraging.
- Conversely, if derivatives exposure has already been cut back after earlier volatility, the same band may hold more easily because there are fewer leveraged positions at risk.
Cost-basis models cannot see leverage directly, but they help us identify zones where optionality and risk management rules cluster. The fact that current price is pressed between the True Market Mean and the 0.75 quantile, with a large share of supply under water, suggests that another strong macro or sentiment shock could trigger a fresh wave of liquidations if support fails.
8. Using Cost-Basis Quantiles as Context, Not Prediction
For readers trying to make sense of this complex picture, it is essential to treat cost-basis bands as contextual tools rather than crystal balls. A few practical guidelines can help:
1. Focus on regimes, not single prints. One intraday wick below the 0.75 band is less important than a multi-week pattern of closing prices below it. Similarly, a single spike above the 0.85 level only becomes meaningful if it is sustained.
2. Combine on-chain signals with macro and sentiment data. Cost-basis metrics tell you how investors are positioned, but not why. Pairing them with information about central-bank policy, liquidity conditions and ETF flows provides a more complete view.
3. Match the indicator to your time horizon. These models are best suited for medium- to long-term analysis. They can help frame the risk of a broader trend change but are not designed to guide short-term trade entries or exits.
4. Remember survivorship bias. Past recoveries from similar setups do not guarantee future outcomes. Each cycle has its own combination of catalysts, participants and policy responses.
Used thoughtfully, the Supply Quantiles Cost Basis Model is a powerful way to connect price action with the underlying behaviour of holders. Used carelessly, it can encourage overconfidence – exactly the opposite of what risk management calls for in an inflection zone.
9. Conclusion: A Market Balanced on Its Own Cost Basis
Bitcoin is once again testing a familiar boundary: the line between a painful but temporary shake-out and the start of something more prolonged. Price is hovering near the True Market Mean, with the 0.75 cost-basis band acting as nearby support and the 0.85 band overhead marking the level that would put most recent buyers back into comfort.
The resemblance to Q1 2022 is real, but the surrounding conditions are more complex. Institutional vehicles, macro policy and the composition of holders have all evolved. What has not changed is the basic logic of risk: when a growing share of supply sits at an unrealised loss, the market becomes more reactive to new information, and valuation bands turn into critical fault lines.
If BTC can reclaim and hold above the 0.85 quantile near 106,200 USD, the current episode may be remembered as a sharp but ultimately healthy reset that pushed out weak hands and allowed the cycle to continue. If it fails, especially around a major macro event such as the FOMC meeting, the probability of a deeper deleveraging phase rises.
For now, the most balanced stance is to recognise both possibilities. The cost-basis curves tell us where stress is concentrated and which levels matter most. They do not remove uncertainty—but they can help investors and observers navigate it with clearer eyes and a stronger emphasis on disciplined risk management.
Disclaimer: This article is for informational and educational purposes only. It does not constitute financial, investment, legal or tax advice and should not be treated as a recommendation to buy, sell or hold Bitcoin or any other asset. Digital-asset markets are volatile and can involve significant risk, including the possibility of total loss. Readers should conduct their own research and, where appropriate, consult qualified professionals before making any financial decisions.