Extreme Fear Returns to Bitcoin: What a 10 Reading on the Sentiment Gauge Really Means
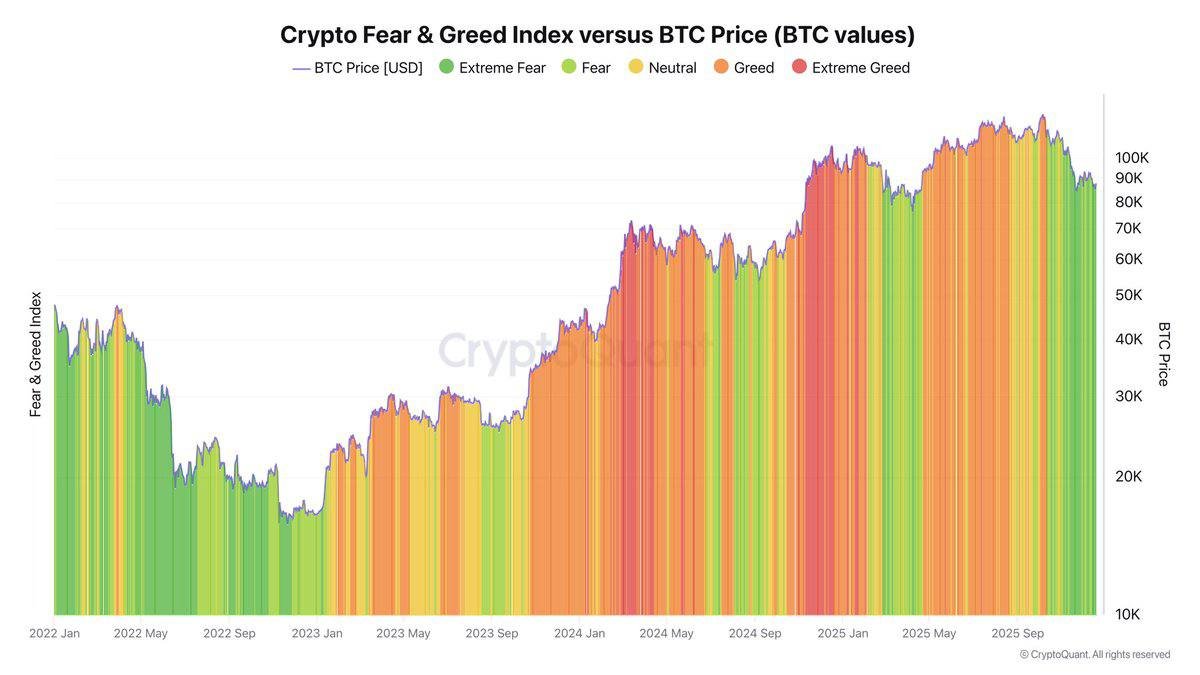
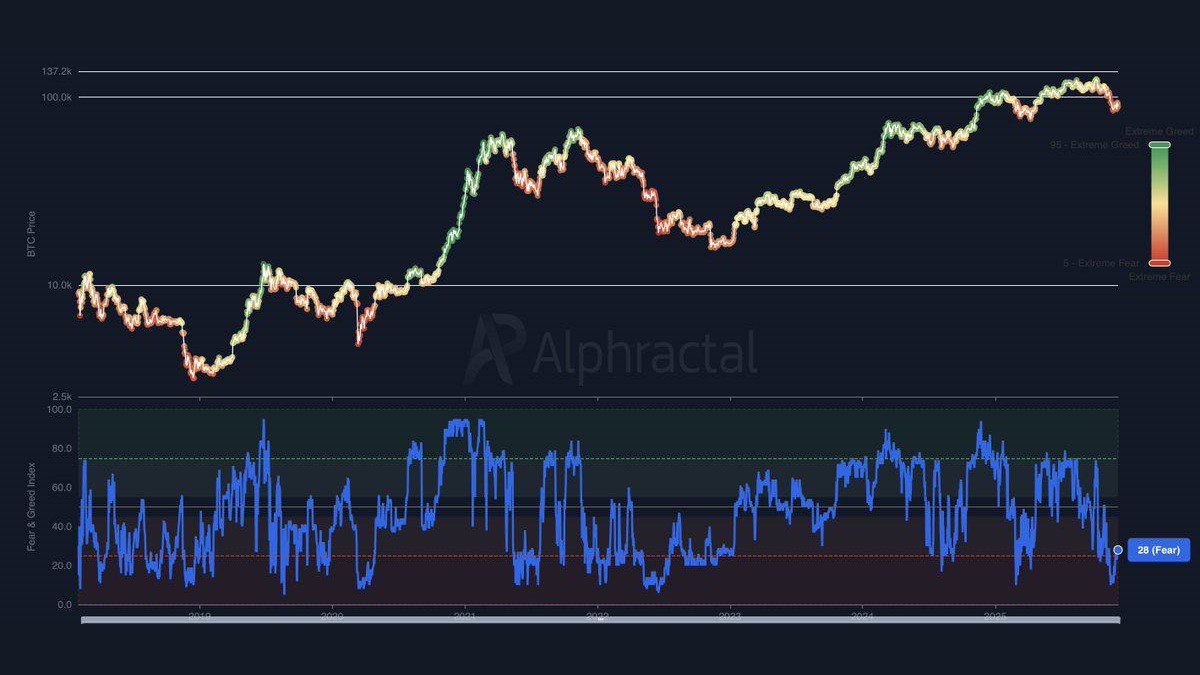
It has been a bruising couple of weeks for digital assets. A cascade of forced position unwinds pushed Bitcoin sharply lower, liquidity thinned out across major venues and, almost on cue, the widely watched Fear and Greed Index crashed to a reading of 10 out of 100. By the methodology behind this indicator, that qualifies as extreme fear and marks the lowest sentiment score of the current cycle.
Since that low, the gauge has crept back toward the high 20s, still firmly in the fear zone but no longer at panic levels. Yet the psychological damage is visible. Social media commentary leans heavily toward bearish narratives, many analysts are now framing the price action as the start of a prolonged downtrend and public interest in crypto has faded enough that Google search activity for core terms has fallen back to levels last seen long before the recent peak.
In this environment, it is very easy to either give up entirely or to lean too hard into contrarian slogans like 'be greedy when others are fearful'. A more constructive approach is to first understand what these indicators are really measuring, then examine how they have behaved in past cycles and finally translate that knowledge into practical, risk-aware decisions.
1. What the Fear and Greed Index Actually Measures
The Fear and Greed Index is often treated as a simple mood barometer, but under the hood it combines several different inputs. The exact formula varies depending on the provider, yet most versions draw from five broad categories:
• Price momentum and trend. How far and how fast Bitcoin has moved relative to recent history. Sharp drawdowns over short windows push the score toward fear.
• Volatility. Large daily swings and elevated implied volatility from options markets are interpreted as signs of stress.
• Trading activity. Changes in spot volume, derivatives usage and order-book behaviour all feed into the gauge.
• Market breadth and dominance. Whether capital is concentrating in Bitcoin or rotating into smaller assets; sudden surges in Bitcoin dominance during sell-offs are usually linked with caution.
• Search and social data. Metrics like Twitter mentions, Google search interest or engagement with crypto-related content provide a rough proxy for enthusiasm or anxiety.
Each component is normalised and combined to produce a single figure between 0 and 100. Scores under around 25 are labelled fear or extreme fear, mid-range values represent more neutral conditions and readings above 75 tend to be associated with optimism or euphoria.
Because the index blends both price-based and attention-based inputs, it tends to move very quickly at turning points. When longs are being liquidated, volatility surges, social media fills with gloomy commentary and search interest often spikes briefly as people check prices, pushing the indicator deep into fear territory. As the immediate shock fades, activity and volatility calm down, social conversation dries up and the gauge drifts back toward the middle.
2. What Just Happened: From Liquidation Wave to Apathy
The recent slide to a reading of 10 followed a familiar pattern. A period of relatively calm conditions lulled traders into increasing the amount of leverage in the system. When price finally broke lower, forced unwinds triggered a chain reaction: margin calls, liquidation of highly leveraged positions and a rapid widening of spreads. That combination translated into a steep, almost mechanical drop in the Fear and Greed Index.
Once the worst of the forced selling passed, the indicator started to rebound. But instead of snapping back into neutral territory, it stalled around the high 20s. At that point, the damage had already been done to sentiment. Many short-term participants who had entered late in the trend realised painful losses or saw their positions closed automatically. Others simply lost confidence and chose to step away, reducing spot volume and online discussion.
Google Trends adds another layer to this picture. Search volumes for Bitcoin and broader crypto terms have fallen noticeably, echoing previous phases where the public gradually tuned out after a period of excitement. Unlike liquidation spikes, which are violent but brief, this slow fade in curiosity can persist for months. It reflects not just fear but also fatigue.
3. Looking Back: How Extreme Fear Has Behaved in Previous Cycles
Historical data shows that extreme fear readings typically cluster around three types of events:
• Capitulation during a major downtrend. After a long slide, the final phase often features intense, emotionally driven selling and very low confidence, pushing the indicator toward single digits. These moments can mark or precede long-term lows, but they can also be followed by extended sideways ranges.
• Sharp corrections inside an overall uptrend. Even within bull phases, Bitcoin sometimes experiences 20–40 percent declines over a short period. If those moves are accompanied by high leverage and negative headlines, the Fear and Greed Index can briefly flash extreme fear before the longer-term trend resumes.
• Macro shocks. Events such as sudden changes in central bank policy, political instability or major corporate headlines can cause rapid repricing across all asset classes, with crypto often moving fastest. Sentiment gauges respond accordingly.
In other words, hitting 10 does not automatically mean that the market has found an unbreakable floor. It simply marks a moment when the prevailing narrative has swung to pessimism, positioning is skewed toward caution and many participants have reduced or closed their exposure. In past cycles, some of the best long-term opportunities did emerge from such climates—but often only for those who were prepared to endure continued volatility and who sized their allocations conservatively.
It is also worth noting that the index can linger in low ranges for longer than many expect. Following large peaks, it is not unusual to see alternating waves of relief and renewed worry as price forms a base. Sentiment tends to heal more slowly than price itself.
4. The Contrarian Temptation: When the Crowd Is Bearish
One of the most popular interpretations of extreme fear readings is the contrarian view: if everyone is anxious, perhaps the worst is already behind us. There is some logic to this. Markets move when marginal buyers or sellers change their behaviour, and once many potential sellers have already acted, the remaining supply overhang can be smaller.
However, contrarian thinking is not a simple mirror image of crowd behaviour. Acting against consensus works best when there is clear evidence that positioning is one-sided and that fundamental conditions are stabilising or improving. In contrast, blindly buying every time sentiment looks weak—without regard for macro trends, liquidity or personal risk tolerance—can lead to repeated drawdowns.
Behavioural finance provides some vocabulary for this tension:
- Loss aversion means that investors often react more strongly to losses than to equivalent gains, which can cause overreactions to negative news.
- Herding describes the tendency to follow the crowd when uncertainty is high, reinforcing trends and overshooting fair value in both directions.
- Recency bias leads people to project the most recent price moves indefinitely into the future, amplifying pessimism after declines and optimism after rallies.
An informed contrarian approach acknowledges these biases but does not assume that every episode of extreme fear is automatically wrong. Instead, it combines sentiment data with independent research into network fundamentals, macro conditions and personal strategy.
5. The Role of Attention: What Falling Google Trends Really Tells Us
Alongside the Fear and Greed Index, the collapse in Google search interest offers a complementary perspective. Search volumes tend to rise during periods of fast price appreciation as new participants rush to learn about Bitcoin or specific altcoins, and they gradually fall when markets move sideways or downward.
Lower search activity can mean several things at once:
- Fewer new entrants. When headlines are muted and prices come off their highs, the flow of first-time buyers tends to slow. That can reduce the marginal demand that previously supported rapid advances.
- Fatigue among existing holders. Long-term participants may still be present but spend less time refreshing prices or reading news when nothing exciting seems to be happening.
- A shift in focus. Attention may move temporarily to other themes—artificial intelligence, traditional equities, or macro stories—until a fresh catalyst brings digital assets back into the spotlight.
Paradoxically, these quieter periods are often when some of the most important building work gets done. Developers continue to ship upgrades, new infrastructure is deployed and institutional frameworks evolve. Because this activity attracts less speculative attention, it can lay foundations that only become visible in prices much later.
6. Are We at the Start of a Bear Market or Mid-Cycle Shake-Out?
The central question for many readers is whether the recent sentiment collapse marks the beginning of a longer downturn or a sharp but ultimately contained reset within a broader uptrend. No indicator can answer this with certainty, but we can outline the factors that matter.
Macro liquidity. Monetary policy remains a major driver of risk appetite. If central banks move decisively toward lower interest rates and expanded liquidity over the coming year, it would historically be supportive for assets with longer-duration growth narratives, including Bitcoin and leading layer-1 ecosystems. Conversely, if inflation surprises to the upside and policy remains tight, speculative activity may stay muted.
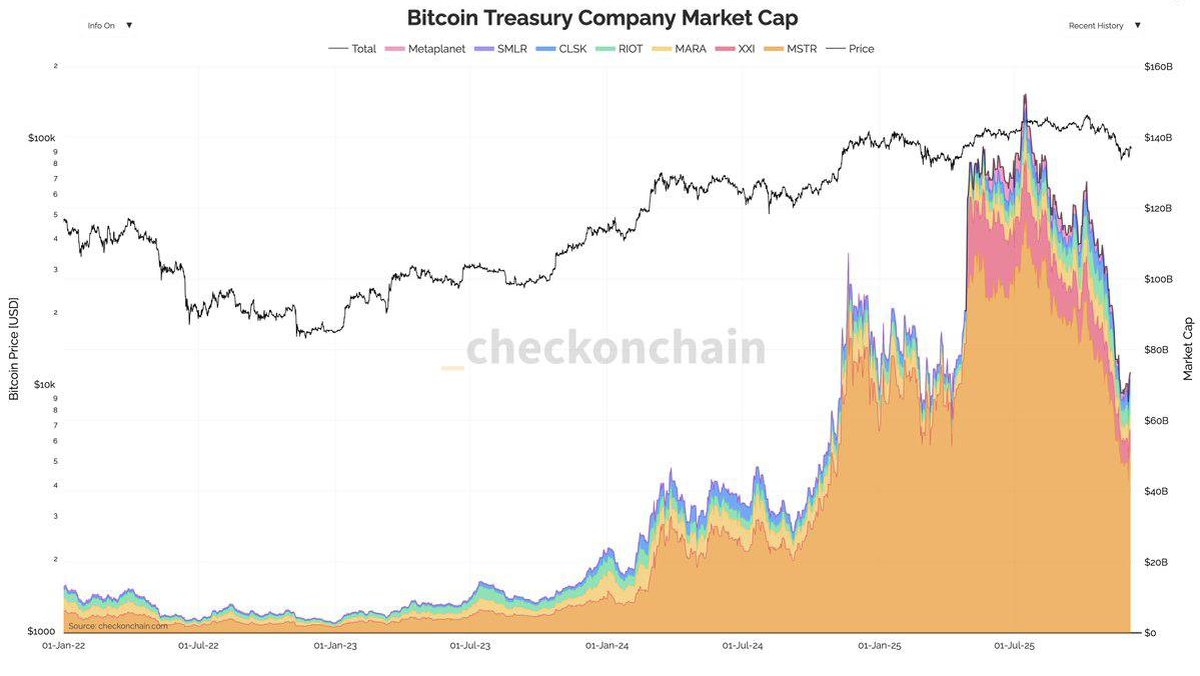
Institutional flows. The growth of regulated investment vehicles such as spot exchange-traded funds has introduced new types of demand, from pension funds to corporate treasuries. Monitoring whether these channels continue to see net inflows, even during downturns, can help determine whether the structural adoption story remains intact.
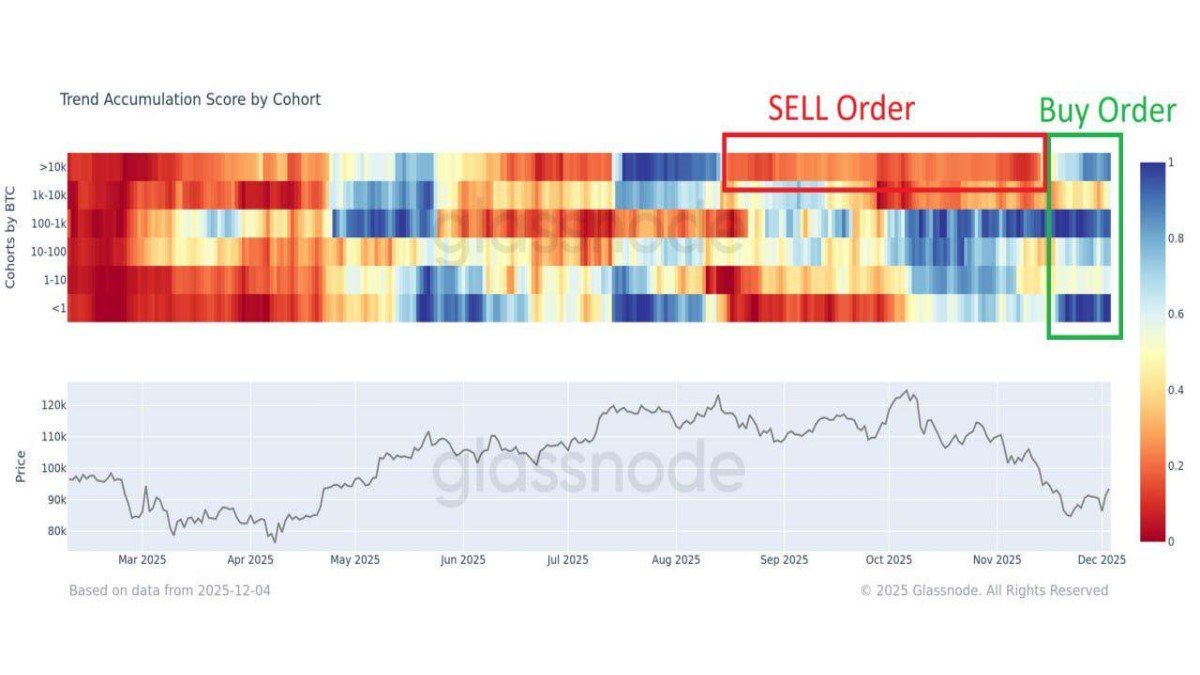
On-chain behaviour. Metrics related to long-term holder supply, realised profits and losses, and the age distribution of coins provide clues about whether seasoned participants are still accumulating or have begun distributing in size. Periods where short-term holders capitulate while long-term cohorts remain relatively steady have historically been healthier than episodes where veteran wallets steadily reduce exposure.
The combination of extreme fear readings, shrinking search interest and heavy liquidations is consistent with what on-chain analysts often call a 'flush-out' phase. Whether that phase transitions into a deeper bear market or sets the stage for a later advance will depend on how these macro, flow and on-chain variables evolve.
7. How Different Market Participants Might Respond
The impact of the current environment varies widely depending on who you are.
Short-term traders face the most direct pressure. Elevated volatility and thin liquidity can be both a source of opportunity and a risk amplifier. For those using leverage, risk controls such as strict position limits and pre-defined exit plans are more important than ever.
Long-term investors may experience discomfort but not necessarily disruption. If their thesis is built on multi-year adoption trends, institutional participation and the evolution of crypto as a monetary or technological asset, short-term sentiment gauges can serve as context rather than as primary inputs. That does not mean ignoring price entirely, but it does mean aligning allocation decisions with a pre-planned strategy instead of day-to-day mood swings.
Newcomers who entered near recent highs are in perhaps the most challenging position. They are simultaneously dealing with financial losses and with the emotional whiplash of seeing narratives reverse almost overnight. For this group, education matters enormously: understanding that volatility is structural to this asset class, that drawdowns are common even in successful long-term trends and that position sizing should always reflect the possibility of large swings.
8. Practical, Brand-Safe Takeaways
So what should readers actually do with the knowledge that the Fear and Greed Index has moved from 10 to 28 and that interest metrics are low?
1. Treat sentiment as a secondary tool, not a primary compass. Indicators of fear and enthusiasm are most useful when they confirm or challenge a thesis built on fundamentals, macro and personal goals. They should not be the sole basis for decisions.
2. Revisit time horizons. If your plan was originally based on a multi-year view of Bitcoin and the crypto economy, check whether that thesis has really changed or whether only short-term conditions have shifted.
3. Focus on resilience. Volatility is less intimidating when positions are sized modestly relative to overall net worth and when essential expenses are segregated from speculative capital.
4. Use quiet periods for research. Lower public attention can create space to study protocols, read documentation, understand regulatory developments and refine risk management frameworks without the distraction of constant price excitement.
5. Beware of extremes on both sides. Just as euphoria can tempt people to overextend themselves, deep pessimism can push them to exit solid long-term positions at unattractive levels. Recognising emotional extremes is valuable precisely because it encourages moderation.
9. Conclusion: Fear, Forgetfulness and the Building Phase
The recent plunge of the Fear and Greed Index to a score of 10, followed by a modest recovery to 28, encapsulates where the crypto market stands at the end of a volatile year. Forced unwinds and rapid price swings have shaken confidence, casual interest has faded and many participants are reassessing their strategies. Yet beneath the surface, infrastructure continues to mature, regulatory frameworks evolve and new use cases—from payments and remittances to on-chain finance and tokenized assets—keep developing.
For thoughtful investors, extreme fear readings should not be a cue for automatic action. Instead, they are a prompt to slow down, assess how much risk is truly appropriate, and distinguish between noise and signal in the broader sense of the word. Markets have a long history of surprising both optimists and pessimists; the only constant is that cycles of excitement and apathy repeat.
Whether the next chapter brings an extended consolidation, a deeper downturn or the foundations of a new advance, those who approach the space with humility, education and robust risk management will be better equipped to navigate it than those who simply oscillate between euphoria and despair.
Disclaimer: This article is for informational and educational purposes only. It does not constitute financial, investment, legal or tax advice and should not be treated as a recommendation to buy, sell or hold any digital asset. Digital asset markets are volatile and carry significant risk, including the possible loss of principal. Readers should conduct their own research and, where appropriate, consult qualified professionals before making financial decisions.