Extreme Fear Returns: What Crypto's Sentiment Reset Really Tells Us
Across social media, derivatives dashboards and on-chain charts, one message has dominated recent weeks: crypto markets are scared again. The Fear & Greed Index, which compresses a wide set of data into a single sentiment score, has sat in the extreme fear zone for an unusually long stretch. In parallel, many traders now talk as if a prolonged downtrend is the default outcome.
Yet when we overlay this mood with the long-term chart of Bitcoin, a more nuanced picture emerges. Deep pessimism is arriving after a powerful multi-year recovery, not at the end of a collapse. Historically, that combination often coincides with phases of accumulation rather than the start of fresh capitulation. The challenge for investors is to distinguish between fear that reflects genuine structural damage and fear that simply marks emotional exhaustion.
1. How the Fear & Greed Index Works
Before drawing conclusions, it is worth revisiting what the index actually measures. Different providers use slightly different formulas, but most versions of the crypto Fear & Greed Index blend several components:
- Price momentum and volatility – sharp drops in price, or a prolonged lack of positive momentum, tend to push readings toward fear.
- Trading volumes and order-book data – falling volumes and sell-side dominance signal caution.
- Market dominance – when capital retreats from smaller assets toward Bitcoin or stablecoins, the index usually tilts bearish.
- Search trends and survey data – a decline in online interest and more pessimistic polls reinforce the fear reading.
The result is a single number that feels simple but compresses many moving parts. High values mean participants are chasing upside; low values mean they are prioritising capital preservation and waiting on the sidelines.
2. What Makes the Current Episode Unusual
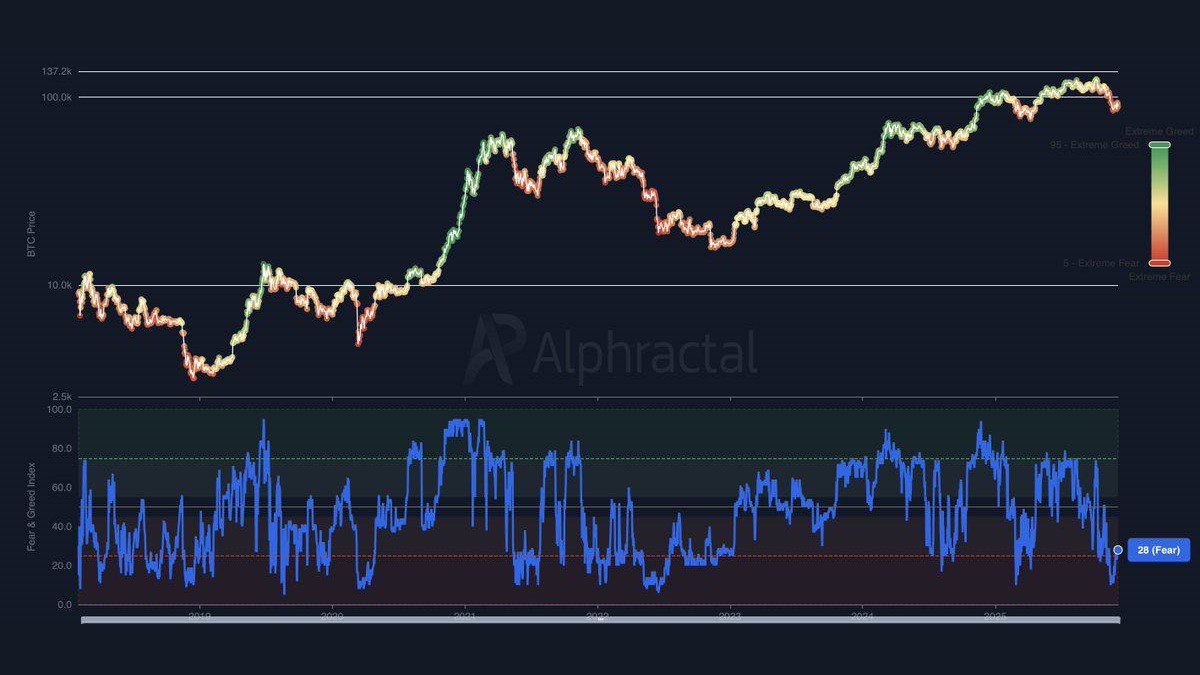
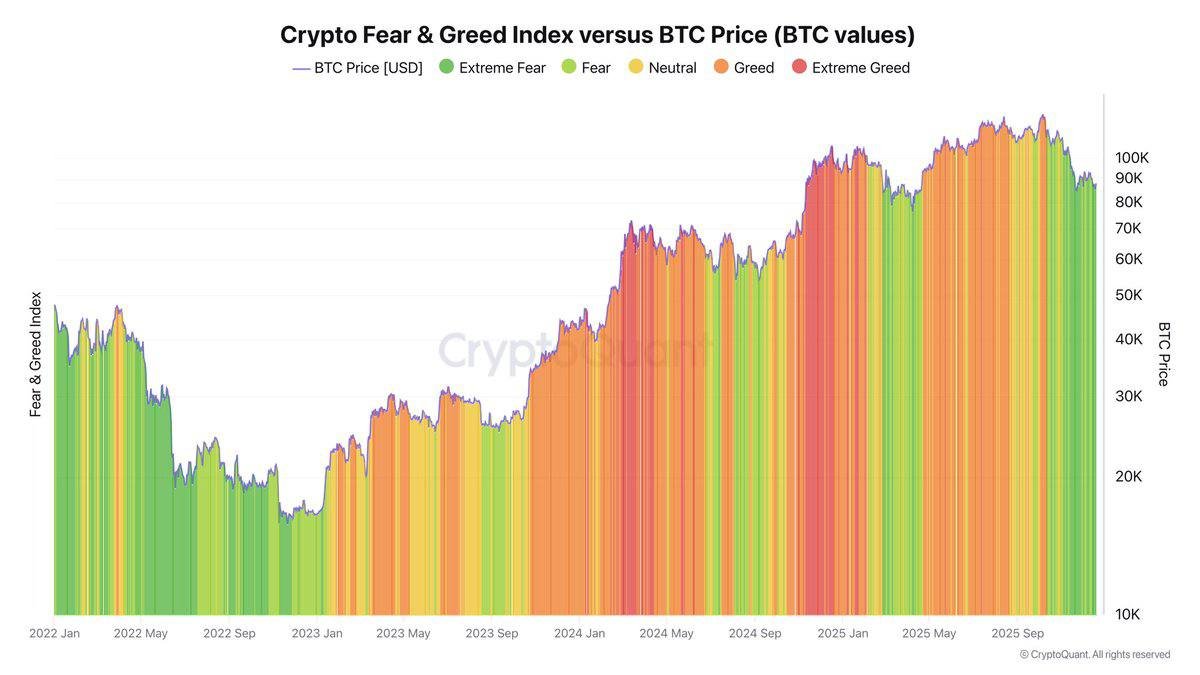
Looking at the chart of Bitcoin versus the Fear & Greed Index, two things stand out about the recent move back into deep fear:
- Price is far above previous bear-market lows. Unlike the 2022 capitulation, today's fear is occurring after a strong recovery, with Bitcoin still trading many multiples above its last major bottom.
- The fearful phase has been persistent. Instead of a short shock around a single event, the index has stayed depressed for several weeks, signalling a broad shift in expectations rather than a one-day panic.
In other words, the market is not terrified because Bitcoin is at rock-bottom prices; it is worried that the previous surge was over-extended and that a long plateau or grinding correction may follow. That distinction matters for how we interpret the signal.
3. Crowd Psychology: From Euphoria to Capitulation to Apathy
To understand why sentiment can swing so far, it helps to frame the emotional cycle that many participants experience:
1. Hope and disbelief. Early in a recovery, investors doubt every rally, anchored by fresh memories of losses.
2. Acceptance and enthusiasm. As price trends upward for months, more people buy in, convinced that a new paradigm is underway.
3. Euphoria and leverage. At extremes, participants extrapolate recent gains indefinitely and increase risk, often using borrowed funds.
4. Disappointment and blame. When the trend stalls, narratives fracture. Investors look for culprits, from macro data to regulation.
5. Capitulation and apathy. Eventually, many decide the asset is "finished" and disengage, creating the conditions for the next accumulation phase.
The Fear & Greed Index essentially quantifies where we are along this curve. Today's deep fear readings suggest that we are closer to the latter stages than the middle: many market participants have moved from enthusiasm to a kind of fatigued resignation.
4. Historical Patterns: When Extreme Fear Has Mattered
History does not repeat perfectly, but it offers useful reference points. In previous cycles, clusters of extreme fear have tended to coincide with one of three situations:
- Late-stage bear markets where forced sellers have almost finished unwinding, and long-term holders quietly add to positions.
- Mid-cycle resets following rapid rallies, where leverage is flushed out and prices consolidate before resuming an upward drift.
- Macro shock events such as sudden policy changes, where sentiment overreacts to new information and later normalises.
In each case, extreme fear on its own was not a precise timing tool. Markets could remain volatile or even revisit lows. However, for investors who were focused on multi-year horizons rather than daily swings, these periods tended to offer more attractive entry points than periods of extreme optimism.
The key lesson: sentiment extremes often tell us more about the balance of risks than about exact turning points. When almost everyone is worried, a lot of bad news is already reflected in prices.
5. Why Contrarian Signals Are Powerful But Imperfect
The idea of doing the opposite of the crowd is appealing: buy when others are fearful, sell when they are overly confident. But in practice, contrarian investing is hard for several reasons.
- Trends can persist. Markets can stay pessimistic for months, especially when macro conditions are deteriorating or liquidity is shrinking.
- Not all fear is irrational. Sometimes negative sentiment reflects real structural issues, such as unsustainable yields, over-reliance on short-term funding or regulatory uncertainty.
- Individual risk tolerance varies. A portfolio that can handle another 50% drawdown is very different from one that cannot. A signal that looks attractive on paper may still be inappropriate for a given investor.
For these reasons, sentiment indicators are best viewed as context, not commands. They can prompt useful questions: Has the market already priced in a recession? Are most leveraged positions already unwound? Are long-term holders still distributing, or have they started to accumulate again? But they do not remove uncertainty.
6. Where Bitcoin Stands in the Current Macro Backdrop
Today's extreme fear is occurring against a complex macro background. Central banks are navigating between inflation control and growth concerns, real yields in major economies remain positive, and currencies like the Japanese yen are adjusting after years of ultra-low rates. At the same time, institutional interest in on-chain assets has grown, with more regulated products, custody solutions and tokenization pilots.
For Bitcoin, that mix creates a paradox. On one side, higher yields and economic uncertainty can pressure so-called risk assets in the short run. On the other, long-term narratives around digital scarcity, transparent settlement and portfolio diversification remain intact. Deep fear readings hint that, for now, investors are focusing more on the first set of forces than the second.
7. Dollar-Cost Averaging: Why Some Long-Term Investors Look Past Sentiment
When sentiment is this negative, a common community question appears: is it time to resume or increase dollar-cost averaging (DCA) into Bitcoin? DCA is a simple approach in which an investor allocates a fixed amount of capital at regular intervals, regardless of price or mood. The goal is to reduce the emotional burden of trying to time the market.
From an educational perspective, DCA has several potential advantages in environments dominated by fear:
- Removes all-in decisions. Instead of guessing where the bottom lies, contributions are spread over months or years.
- Aligns with accumulation phases. Historically, long stretches of depressed sentiment have overlapped with periods where disciplined, gradual buying eventually proved rewarding for believers in the asset's long-term case.
- Encourages risk budgeting. Because the schedule and amounts are predefined, it is easier to keep overall exposure aligned with personal financial plans.
However, it is crucial to emphasise that DCA is not magic. If the thesis for an asset changes or if an investor's circumstances shift, continuing to allocate automatically may no longer make sense. Moreover, using borrowed funds or highly leveraged products alongside DCA can undermine its stabilising effect.
In short, some long-term participants view extreme fear as an opportunity to re-evaluate, not to blindly increase risk. For others, remaining entirely in cash is the strategy that aligns best with their goals. The Fear & Greed Index cannot decide between these paths; it can only highlight that the majority currently leans toward caution.
8. A Practical Framework for Using Sentiment Indicators
To make constructive use of the current fear regime, it helps to embed the index in a broader checklist. One possible framework looks like this:
- Sentiment – Are indicators such as Fear & Greed, funding rates and options skews showing capitulation or merely discomfort?
- Positioning – Has open interest declined, and are liquidations flushing out crowded trades, or is leverage still elevated?
- On-chain behaviour – Are long-term holders reducing exposure, or are they largely steady while short-term traders react?
- Macro signals – Are interest rates, growth data and policy expectations stabilising, or are they still deteriorating?
- Personal constraints – Can your own budget, time horizon and stress tolerance handle more volatility?
Extreme fear only becomes a useful input when combined with this kind of structured thinking. Without it, there is a risk of treating the index as a green light simply because it matches a popular quote about being greedy when others are fearful.
9. Key Takeaways From Today's Extreme Fear
Putting everything together, several conclusions emerge:
- The market has shifted into a regime of crowded pessimism after a strong multi-year recovery in Bitcoin.
- Historically, similar clusters of fear have often overlapped with late bear-market or mid-cycle accumulation zones, though timing has been messy.
- Contrarian strategies can benefit from such conditions but only when combined with realistic assumptions about drawdowns, liquidity and macro uncertainty.
- For long-term investors, tools like DCA are less about predicting exact bottoms and more about maintaining discipline when emotions are strongest.
Perhaps the most important insight is psychological rather than statistical: when almost everyone agrees that the outlook is negative, the balance of surprise often tilts in the opposite direction. That does not guarantee immediate upside, but it does suggest that the distribution of future outcomes is wider than day-to-day commentary might imply.
Whatever approach you choose, treating the Fear & Greed Index as a conversation starter rather than a trading signal can lead to healthier decisions. Ask what the current reading says about crowd behaviour, how it fits into your own thesis, and whether your risk exposure still matches your financial reality.
Disclaimer: This article is for educational and informational purposes only and does not constitute investment, legal or tax advice. Digital assets are volatile and involve risk. Always conduct your own research and consult a qualified professional before making financial decisions.