When Whales Use the Front Door: Interpreting Binance’s Rising Average Bitcoin Deposit Size
Crypto traders have a reflex: exchange inflows = someone is about to sell. The reflex exists for a reason—exchanges are where selling can happen quickly. But a reflex is not the same as a framework. And when a single indicator starts trending in a dramatic way, the bigger risk is not missing a move—it’s misreading what the move actually means.
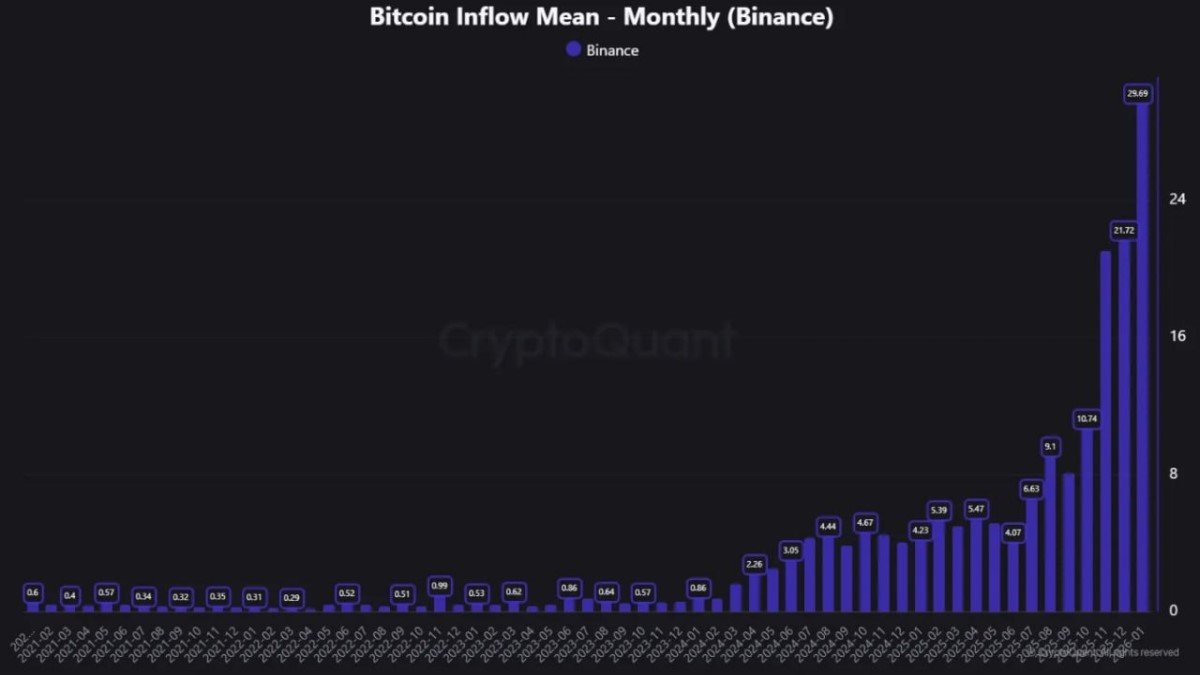
The chart you shared tracks Bitcoin inflow mean on Binance, a metric often described as the average amount of BTC per deposit transaction. The headline claim—average deposit size up ~34x—is attention-grabbing because it implies the market’s “typical depositor” is no longer a small participant. It implies bigger hands are moving more often, and they are moving in fewer, heavier packets.
1) What “inflow mean” really measures (and why it can mislead)
Think of inflow mean as a behavioral average, not a “total flow” statistic. It does not tell you how much BTC entered Binance in aggregate. It tells you how large the typical deposit transaction is on average. That difference matters. Total inflow can rise because many small users deposit at once. Inflow mean rises when deposit activity becomes more concentrated in bigger transfers.
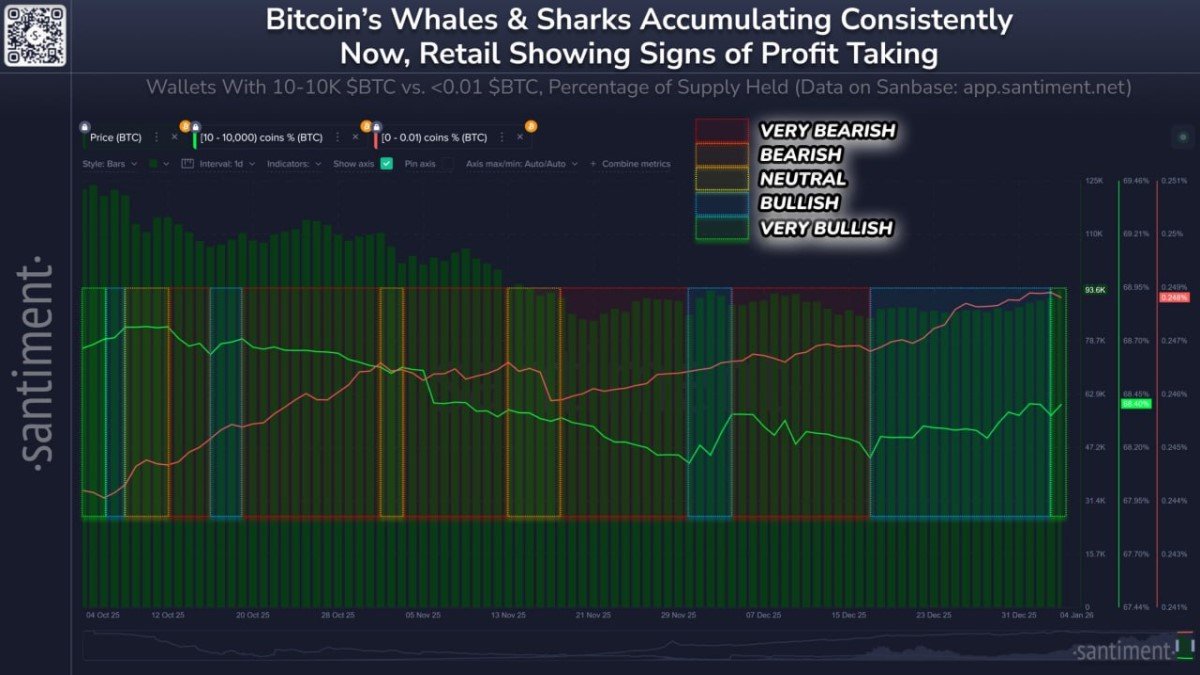
This is why the metric can feel like a “whale radar.” If the average deposit grows meaningfully over time, it suggests that either (1) large holders are depositing more frequently, (2) deposit transactions are being bundled into fewer, larger transfers, or (3) the mix of depositors is shifting away from retail toward institutions, desks, or custodians.
The trap is obvious: a bigger average deposit is not the same as “whales are selling.” It’s closer to: whales are showing up at the venue. What they do after they arrive depends on conditions inside the venue.
2) Why the average deposit size can jump ~34x without implying panic
There are several market-structure reasons why average deposit size can rise dramatically, even in a neutral or constructive environment. When markets mature, the plumbing changes: execution becomes more professional, capital becomes more consolidated, and behavior becomes more “batch-like.” This can inflate averages without any urgent intent to sell.
Here are a few common drivers that can push inflow mean higher:
• Consolidation of holdings into fewer entities: As ETFs, funds, treasuries, and large desks grow, more BTC sits in fewer hands. Fewer hands means fewer deposit transactions—so each deposit tends to be larger.
• Operational batching: Custodians and desks often batch transactions to reduce operational overhead. Instead of 20 medium deposits, you see 2 very large deposits. The mean jumps, even if the economic intent is unchanged.
• Rotation between custody and trading venues: Large holders may keep BTC in cold storage most of the time and move it onto an exchange only when they plan to execute something specific—hedge, roll, arbitrage, or rebalance. In that world, deposits are rarer but heavier.
If you want a simple analogy: the inflow mean rising doesn’t necessarily mean “people are dumping.” It can mean fewer trucks are entering the market, but each truck is carrying more cargo.
3) “Deposit” doesn’t automatically mean “sell”: three non-selling motives
It’s healthy to be suspicious of exchange deposits, but it’s more useful to be specific about why someone would deposit. Binance, in particular, is not just a spot exchange. It’s a major derivatives and liquidity hub. That expands the range of rational reasons to move BTC onto the platform.
Here are three non-selling motives that often explain large inflows—especially when market structure is active:
1) Collateral for derivatives and hedging. Large BTC deposits can be posted as margin to open or maintain futures positions. The intention may be risk-reducing (hedging) rather than risk-increasing (selling spot). A desk can deposit BTC and simultaneously add a hedge, effectively staying market-neutral.
2) Liquidity provisioning and execution efficiency. Market makers and liquidity providers need inventory where the action is. Depositing BTC can be about tight spreads and deeper books, not liquidation. If volatility rises, pros often bring inventory closer to execution venues.
3) Arbitrage and cross-venue rebalancing. When price differences open between venues, capital moves to capture the spread. Deposits can spike when there’s a persistent premium/discount somewhere—or when options/futures basis makes a carry trade attractive.
This is why the statement “Not every deposit is a sell” is not just a comforting slogan. It’s structurally true. The market has evolved from a single-purpose casino into a multi-venue financial system where deposits can serve multiple roles.
4) When inflow mean becomes a genuine warning signal
Even though deposits are not always sells, the metric still matters—because selling is easiest after deposit. The right approach is conditional: inflow mean is more bearish when it aligns with other signs of distribution and fragile liquidity.
Here are contexts where a rising inflow mean deserves more caution:
• Weak spot demand while deposits accelerate. If BTC price struggles to rally on good news, or repeatedly fails at key levels while large deposits rise, that’s often a sign of supply meeting insufficient demand.
• Derivatives positioning looks crowded. If open interest is elevated and funding dynamics suggest one-sided positioning, large deposits can become “ammo” for forced moves—either to defend positions or to press them.
• Net flows turn strongly positive. Mean inflow rising matters more when total inflow rises and outflows don’t keep up. A high mean + high net inflow is a different animal than high mean in an otherwise balanced flow environment.
In practice, you don’t want to treat inflow mean as a standalone “sell signal.” You want to treat it as a spotlight: it tells you where to look next.
5) Why Binance is a special case for this indicator
Binance is often where global liquidity concentrates—particularly for derivatives. That creates a pattern where sophisticated participants route activity there even if their final objective is not simply spot selling. If your venue is the deepest pool, you become the default venue for “serious size.”
So a rising inflow mean on Binance can reflect the exchange’s role as a liquidity junction. Large players may deposit because they want optionality: the ability to sell, hedge, lend, arbitrage, or rotate quickly depending on how the market opens and where volatility appears.
Another subtle point: as the market professionalizes, the same entity might use Binance operationally while executing across multiple venues. The deposit is not the final act. It’s the staging move.
6) What to monitor next (so this becomes a framework, not a headline)
If you want an “update mindset,” focus on confirmation signals rather than assumptions. Inflow mean is the clue. Confirmation comes from how price, liquidity, and positioning respond after the clue appears.
• Net exchange flows (inflows minus outflows). Are coins sticking on the exchange, or leaving quickly after execution? Coins that arrive and linger can imply readiness to sell; coins that rotate fast can imply operational movement.
• Spot vs. derivatives dominance. If derivatives volume and open interest rise alongside mean inflow, deposits may be collateral-driven. If spot sell pressure rises while derivatives look flat, deposits may be supply-driven.
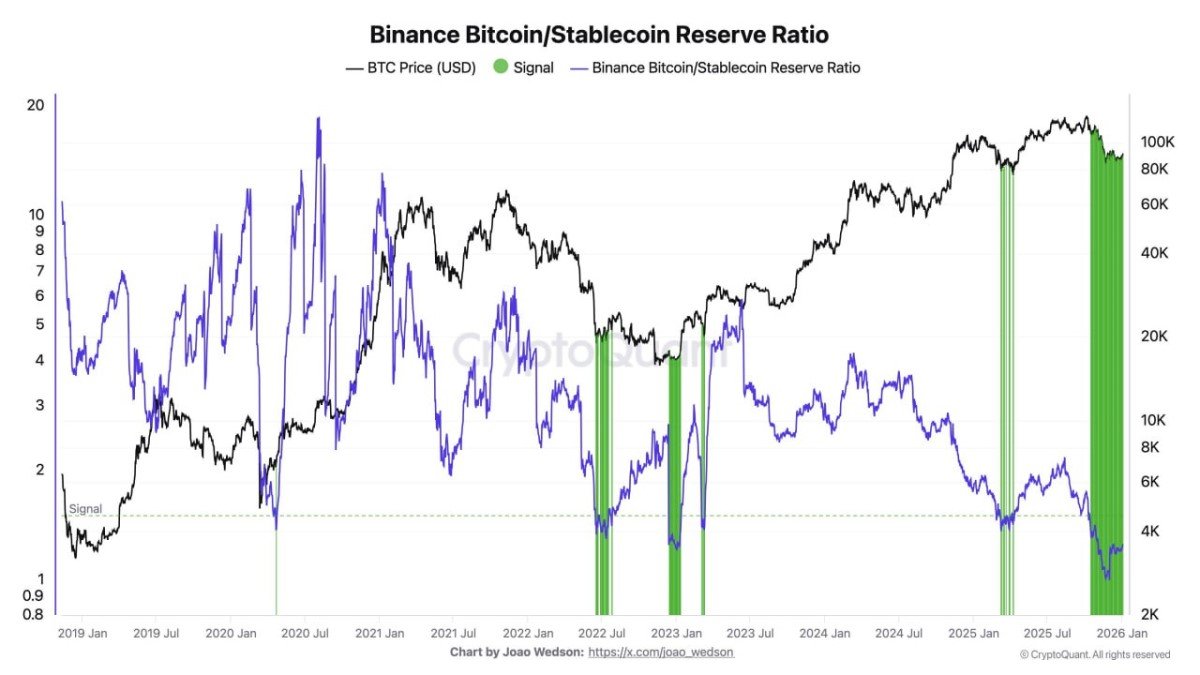
• Stablecoin activity. BTC deposits paired with stablecoin inflows can signal active trading and liquidity building. BTC deposits with no corresponding liquidity increase can be more concerning in thin conditions.
• Volatility and order book depth. If depth weakens and volatility rises, the market becomes more sensitive to large sell programs. In that environment, “whales on exchange” matters more.
• Price reaction to large-flow days. Watch how BTC behaves after suspected inflow spikes. Does it absorb supply and bounce (demand strong), or does it drift lower (demand weak)? The reaction is often more informative than the deposit itself.
The goal isn’t to predict with certainty. The goal is to avoid the classic mistake: interpreting a precondition (deposit) as the action (sell).
7) A simple mental model: ports, ships, and intent
Here’s a mental model that tends to keep people honest. Think of Binance as a port. A ship arriving at a port can be bringing goods to sell—but it can also be refueling, repairing, transferring cargo, or waiting out weather. The arrival is visible. The intent is not.
Inflow mean rising says: bigger ships are docking more often. That’s all. It doesn’t tell you whether the ships are unloading goods onto the market or simply preparing for the next voyage. To infer intent, you need to watch what happens after docking: inventory changes, net flows, and price response.
That’s the difference between a market reader and a headline reader.
Conclusion
A 34x jump in Binance’s average BTC deposit size is meaningful because it suggests the participant mix is skewing larger—whale-scale entities are more active, or their operational behavior is becoming more consolidated. But the mature take is not “they’re dumping.” The mature take is: liquidity is reorganizing.
Sometimes that reorganization precedes distribution. Sometimes it precedes volatility-driven positioning. And sometimes it’s simply the market becoming more institutional and efficient—fewer moves, bigger moves, and better execution. If you pair inflow mean with net flows, liquidity conditions, and price reaction, this indicator stops being fear fuel and becomes a real tool.
Frequently Asked Questions
Is inflow mean the same as total inflow?
No. Inflow mean focuses on the average BTC size per deposit transaction. Total inflow measures the aggregate amount deposited. Mean can rise even if total inflow is flat, as long as deposits become fewer and larger.
If whales deposit to Binance, does that mean they will sell?
Not automatically. Deposits can be used for hedging collateral, market-making inventory, arbitrage, or operational rebalancing. Selling is one possible use, but not the only one.
What confirms a bearish interpretation?
Rising mean combined with strong net inflows, weakening spot demand, fragile order book depth, and negative price reaction tends to be more concerning than mean inflow alone.
Disclaimer: This article is for educational purposes only and does not constitute financial, investment, legal, or tax advice. On-chain and exchange-flow metrics can be methodology-dependent and may not reflect complete activity across venues. Crypto assets are volatile and involve significant risk. Always verify information using multiple sources and consider your own risk tolerance.