When Altcoin Volume Goes Quiet: Reading the DCA Signal From Stablecoin Pairs
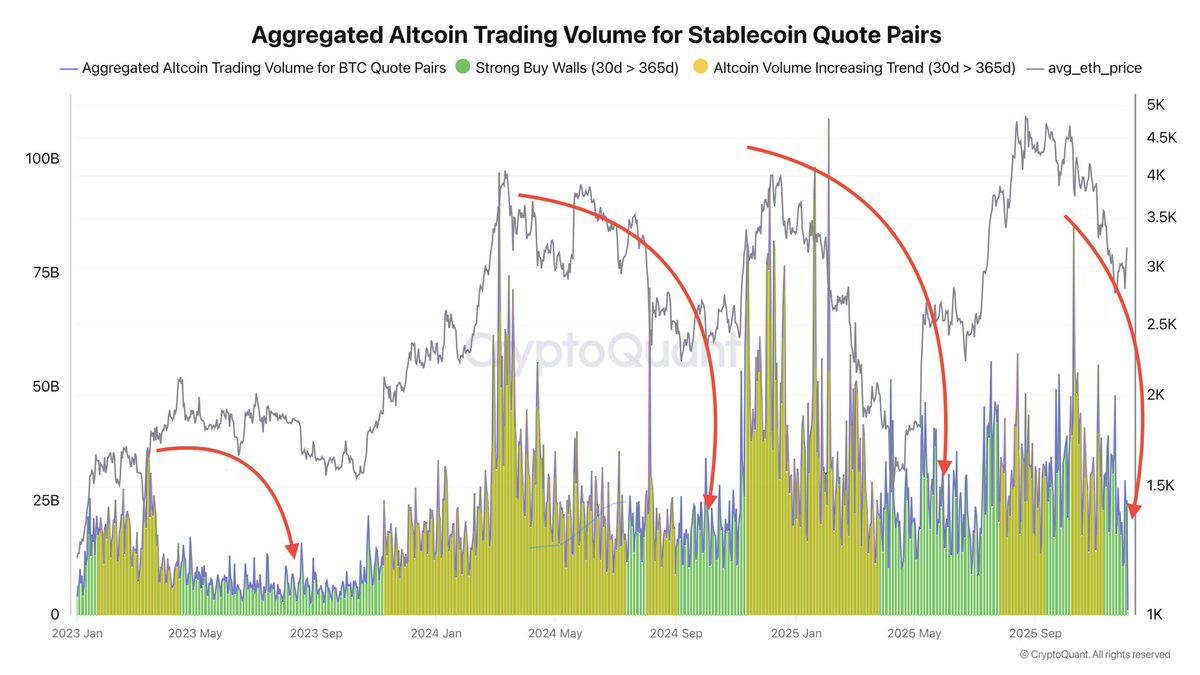
At first glance, the latest volume chart for altcoins looks uninspiring. After a year of dramatic spikes in trading activity, the coloured bars representing aggregated volume on stablecoin pairs have sagged back toward the bottom of the screen. Ethereum’s price, drawn as a grey line in the background, has cooled from its highs. Social media feels quieter, new token launches are less frequent and many portfolios are stuck somewhere between mild drawdown and sideways drift.
For traders who thrive on constant excitement, this can feel like the boring part of the cycle. For systematic investors, however, these conditions often mark the beginning of something important: a window in which dollar-cost averaging (DCA) into carefully selected altcoins may offer attractive long-term risk–reward.
The key observation behind that thesis is simple. When the 30-day aggregated trading volume of altcoins (quoted in stablecoins) drops below its own 365-day average, it indicates that short-term participation has faded relative to the past year. Historically, these are the periods highlighted on the chart with red arcs and low bars — stretches of time when few people want to talk about altcoins, even though the long-term narratives behind major networks have not fundamentally changed.
1. What This Chart Is Actually Showing
The graphic aggregates trading activity across a wide range of altcoin–stablecoin pairs (for example, ETH/USDT, SOL/USDC and so on). It excludes Bitcoin pairs to focus on how capital rotates between alternative networks and dollar-linked assets.
- The vertical bars represent daily trading volume, colour-coded to indicate whether the 30-day trend is rising strongly or simply hovering near the baseline.
- The grey line traces the average Ethereum price over the same period, acting as a rough proxy for the broader altcoin market.
- The red arrows and arcs mark episodes where the 30-day volume has fallen beneath the yearly average, signalling a contraction in activity and attention.
In early 2023, again in late 2024 and more recently in the final quarter of 2025, we see the same pattern: after feverish trading bursts that coincide with narrative peaks or sharp rallies, volume gradually subsides. Eventually, it drops below the long-term mean. That is the environment we have just entered once more.
2. Why a Drop in Altcoin Volume Is Not Automatically Bearish
It is tempting to equate lower trading volume with a lack of conviction. If fewer tokens are changing hands, maybe interest has evaporated, the story goes. Yet in practice, quieter order books often reflect a shift in the type of participants who remain active.
When altcoin markets are hot, a significant share of volume comes from short-term activity: speculative rotations, momentum strategies and rapid listing cycles. These flows can push prices far above or below what long-term fundamentals would justify. Once the excitement fades, that segment of the market tends to shrink. Positions are closed, leverage is reduced and many traders move back to Bitcoin, stablecoins or traditional assets.
What is left behind is a thinner but often more patient base of holders: developers, ecosystem funds, long-horizon investors and users who rely on specific networks for applications. Their activity does not generate the same headline-grabbing volume, but it does provide a foundation for gradual rebuilding. In that sense, low volume is a sign that emotional excess has been flushed out, not necessarily that the long-term story is broken.
3. The Logic Behind a “DCA Buy Zone”
The DCA framework does not aim to pick exact tops or bottoms. Instead, it spreads purchases across time, reducing the impact of short-term volatility on an investor’s average entry price. The question, then, is not “Where is the precise bottom?” but rather “Is the current environment broadly favourable for accumulating exposure at a measured pace?”
That is where the volume-based signal becomes useful. When 30-day altcoin volume drops below the yearly average for stablecoin pairs, three things tend to be true at once:
- Excessive enthusiasm has faded. The participants who were most sensitive to headlines and rapid price moves have already cycled out of the market.
- Valuations are often closer to underlying cash-flow or usage metrics. Not every token becomes “cheap”, but the gap between price and on-chain activity is usually narrower than during peak periods.
- New narratives can develop without overwhelming speculation. Builders and long-term capital have room to experiment without competing with short-lived trading frenzies.
For an investor who believes that certain altcoin ecosystems will still matter three to five years from now, those are attractive conditions for gradual entry. The chart does not suggest rushing in with maximum size on a single day; instead, it indicates that the next stretch of weeks or months may be a reasonable window to deploy a pre-planned DCA schedule.
4. How Previous Volume Troughs Played Out
Looking back, the earlier red-circled areas on the chart tell a consistent story. After each major rally in Ethereum and the broader altcoin complex, there was a cooling-off period. Trading volume on stablecoin pairs fell, often coinciding with sharp corrections or multi-month sideways ranges.
Investors who accumulated during those low-volume stretches did not enjoy immediate gratification; prices frequently remained choppy or even drifted lower for a while. However, when the next phase of broader market strength arrived—driven by new applications, upgrades or macro tailwinds—those gradual entries tended to sit on significantly better cost bases than purchases made during the prior euphoria.
Of course, history does not guarantee that the future will unfold the same way. Some projects that looked promising in earlier troughs have since faded, while others have grown into critical pieces of the infrastructure stack. The volume signal is about timing the market environment, not about choosing specific winners. Asset selection remains a separate—and equally important—challenge.
5. Designing a Brand-Safe Altcoin DCA Plan
If the current volume contraction marks another potential accumulation window, how might a thoughtful investor respond? Below is a framework that keeps risk management and education at the centre.
5.1 Clarify time horizon and allocation
Altcoins are inherently more volatile than large-capitalisation assets such as Bitcoin or major equity indices. A common approach is to treat them as a small satellite allocation within a broader portfolio—perhaps a single-digit percentage of total investable assets—rather than as a core holding. The longer the time horizon (for example, three to seven years), the more sense DCA makes as a strategy.
5.2 Focus on quality and role in the ecosystem
Instead of chasing every new ticker, investors can concentrate on networks and protocols with clear roles: base layers that secure large ecosystems, critical infrastructure such as data oracles and cross-chain messaging, and platforms with proven user traction. Evaluating documentation, governance transparency and security track records is as important as price history.
5.3 Choose a schedule and stick to it
A classic DCA plan might involve allocating a fixed dollar amount each week or month across a basket of selected assets. The goal is to keep behaviour consistent through both minor rallies and temporary setbacks. Trying to “pause” the plan every time the market dips further can quickly turn a systematic approach into emotional market timing.
5.4 Keep liquidity and safety in mind
Trading through reputable venues, using stablecoins with robust transparency practices and storing assets in secure wallets are all part of responsible participation. During low-volume periods, spreads can widen on smaller tokens, so it may be safer to focus on pairs with deep order books and strong infrastructure support.
6. Limitations of the Volume-Based Signal
While the drop in 30-day altcoin volume below its yearly average provides a useful lens, it is important to recognise what this indicator does not tell us.
- It does not predict exact price levels. Markets can always move lower after volume has already contracted.
- It does not distinguish between healthy and unhealthy projects. Some altcoins may never recover prior valuations even if the broader market rebounds.
- It does not capture off-chain activity. As more trading and structured products migrate to institutional platforms and ETFs, on-chain or exchange-reported volume may understate the true level of interest.
For these reasons, many analysts treat volume-based DCA signals as context rather than as standalone instructions. Combining them with other data—such as developer activity, protocol revenue, liquidity in decentralised exchanges and macro indicators—produces a more rounded view.
7. What Could Break the Pattern?
There are scenarios in which the “low volume equals accumulation opportunity” pattern might not hold. A prolonged global downturn, significant regulatory restrictions or major technical issues in key protocols could keep capital sidelined for longer than in past cycles. In such an environment, volume could remain depressed while prices continue to grind lower or move sideways for years.
This is why position sizing and diversification are critical. A DCA plan should be resilient to the possibility that markets take longer to recover than expected, and it should never rely on a single asset or narrative. Maintaining an emergency cash buffer and avoiding excessive leverage are simple but powerful safeguards.
8. Key Takeaways
The altcoin volume chart currently tells a quiet but important story:
- Aggregated trading activity on stablecoin pairs has fallen below its yearly average, mirroring previous post-hype phases.
- This environment often aligns with constructive conditions for dollar-cost averaging into fundamentally sound projects, as speculative excess has faded and long-term participants gradually rebuild positions.
- The signal is probabilistic, not deterministic; it should be combined with careful asset selection, reasonable allocation sizes and a clear understanding of personal risk tolerance.
For investors who believe that the broader digital-asset ecosystem will keep evolving—from layer-1 networks and rollups to decentralised finance and tokenized real-world assets—periods of low volume are not just moments of silence. They are opportunities to build exposure methodically while the spotlight is elsewhere.
Disclaimer: This article is for informational and educational purposes only. It does not constitute financial, investment, legal or tax advice and should not be treated as a recommendation to buy, sell or hold any digital asset or to follow any specific investment strategy. Digital asset markets are volatile and involve risk, including the possible loss of principal. Readers should conduct their own research and, where appropriate, consult a qualified professional before making financial decisions.