The First Trading Day of 2026 Wasn’t a Rally—It Was a Map of Constraints
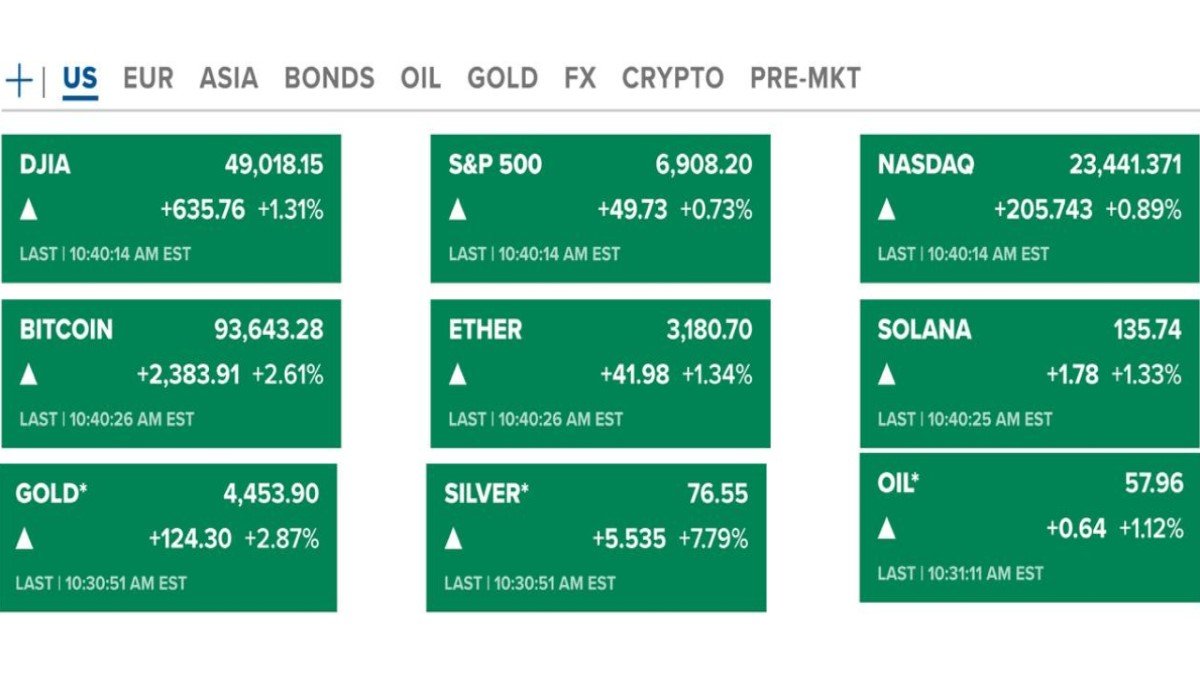
The first trading day of 2026 closed with the kind of numbers that look boring in isolation: the Dow and S&P 500 edged higher, the Nasdaq barely moved, and most major assets stayed within ranges that felt familiar. But “quiet” openings are often when markets confess what they’re really afraid of—because price doesn’t have to move much to reveal where capital is leaning and where it refuses to commit.
Across stocks, crypto, metals, and energy, the same theme appeared in different costumes: investors are not celebrating a new year; they are negotiating constraints. Policy uncertainty is one constraint. Leadership transitions are another. And the third is more subtle: when an asset class grows up, it doesn’t stop being volatile—it becomes sensitive to more variables at once.
1) A Mixed Close That Said More About Leadership Than Direction
On paper, Wall Street’s day looked straightforward: two major indices green, one slightly red. That framing misses the point. The more interesting story is how the market moved—who carried the gains, who dragged, and what that implies about the kind of conviction investors are willing to express right now.
When the Dow and S&P 500 rise while the Nasdaq stalls, it’s not automatically a “tech is over” signal. It can be a sign that the market is selectively pricing growth—rewarding themes that feel closer to cash flows or infrastructure demand, while being more skeptical of the most crowded expectations. In early 2026, that skepticism matters because valuations and policy narratives are still competing for the steering wheel.
One useful way to interpret the day is to treat it like a vote on timing. The market seems willing to buy stability, but not necessarily willing to pay any price for long-duration promises. That is not bearish; it is a different kind of discipline.
• The day’s pattern fits a market that prefers “incremental confidence” over “all-in optimism.”
• A mixed close often reflects rotation and hedging, not confusion.
• The key question is whether leadership broadens in January—or narrows under pressure.
In other words, the first session didn’t tell us where markets are going. It told us which vehicles investors trust to take them there.
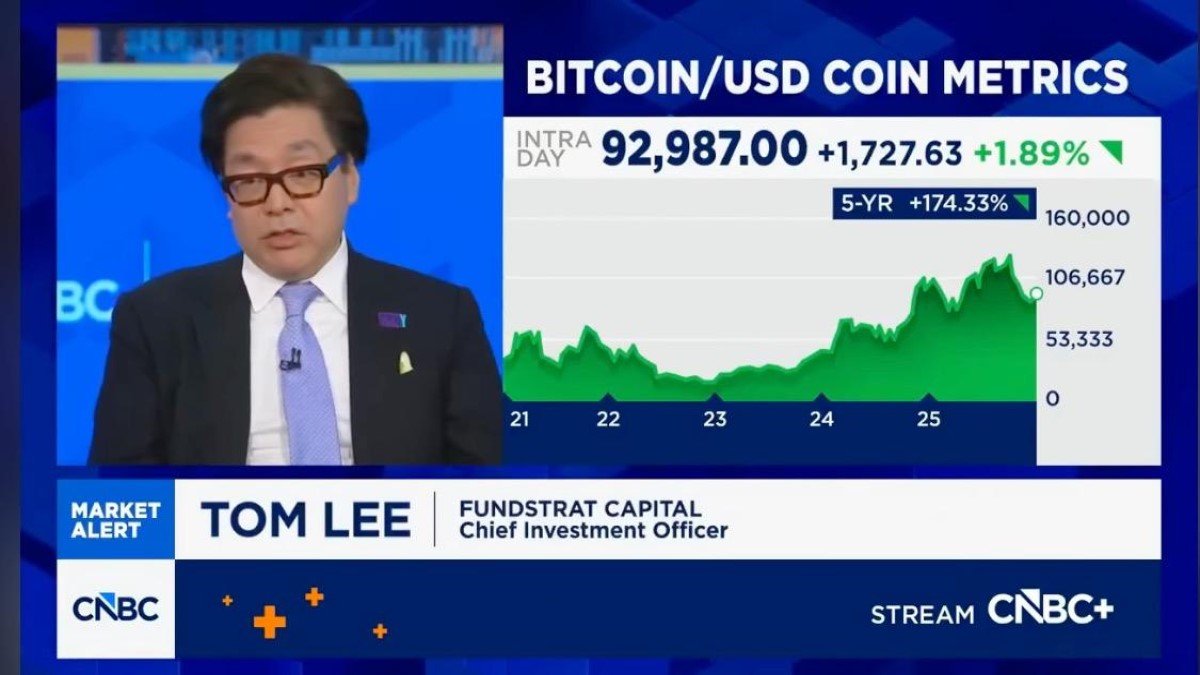
2) Bitcoin Near $90K: When a “Risk Asset” Starts Acting Like a Reference Rate
Bitcoin trading around $90K is easy to describe and harder to interpret. A few years ago, that level would have been treated as a pure sentiment event. Now it is increasingly treated as a benchmark: a number that influences positioning, headlines, and even how investors talk about broader risk appetite.
What stood out on the first day of 2026 was not just that Bitcoin rose modestly—it’s that it did so while the broader market mood stayed measured. That combination suggests Bitcoin is being held in two mental buckets at once: a speculative asset for some participants, and a portfolio reference point for others. When an asset sits in both buckets, it can look calmer than its reputation—until macro conditions force everyone to pick one label.
A practical takeaway is to watch Bitcoin the way you might watch a stress gauge rather than a lottery ticket. When it holds levels during mixed equity sessions, it can signal that liquidity is still present and that forced selling is limited. When it breaks down sharply, it often signals something more mechanical—positioning, leverage cleanup, or a sudden shift in risk budgets.
• Stability can be informative even when it’s not exciting.
• “Bitcoin up” matters less than “Bitcoin up without broad euphoria.”
• In mature phases, Bitcoin can trade like sentiment and like infrastructure—depending on who is active.
Bitcoin’s role is expanding. That doesn’t guarantee anything about price. It does change how we should read the tape.
3) Gold, Silver, and Oil: A Macro Triangle That Doesn’t Always Agree
Gold and silver held elevated levels while oil stayed below $60. That mix creates a deceptively rich macro picture. In simplified narratives, strong metals are “fear” and weak oil is “growth worries.” Real markets are messier: metals can rise due to currency dynamics and reserve preferences, while oil can fall due to supply expectations even when demand is steady.
The educational point here is that cross-asset signals often disagree because they’re measuring different anxieties. Metals can reflect long-duration concerns (currency, policy credibility, hedging). Oil can reflect nearer-term supply and demand balances. When both happen at once—strong metals, weaker oil—you can get a market that feels cautious without feeling panicked.
This matters for 2026 because many narratives will be tempted to overfit: “oil down means inflation solved” or “gold up means crisis.” Neither is automatic. The better habit is to treat these moves as inputs into a probability distribution—one that changes week by week.
• Low oil can reduce certain inflation pressures, but it does not erase them.
• High metals can reflect hedging demand, not necessarily immediate distress.
• The combination often points to “uncertainty about policy,” not “certainty about recession.”
Cross-asset analysis is not about finding one truth. It’s about identifying which fears the market is paying to insure.
4) Berkshire’s New Era: The Cash Pile as a Mirror of Market Psychology
Berkshire Hathaway entering a post-CEO Buffett era is more than a corporate story—it’s a cultural moment for markets. Berkshire represents a certain philosophy: patience, discipline, and a refusal to chase trends just because the crowd is running. When that symbol changes hands, investors naturally ask whether the philosophy persists—or whether the organization becomes more “normal.”
The numbers amplify that psychology. A record-scale cash pile creates a strange kind of pressure: cash is safety, but it is also a visible choice not to act. In a market where many assets already price in optimistic assumptions, the presence of massive cash can read like a quiet dissent. Not because cash is “bullish” or “bearish,” but because it’s a reminder that opportunity is not always obvious at the top of a cycle.
Greg Abel’s first chapters will likely be interpreted through one lens more than any other: capital allocation. What the market wants is not a dramatic move—it’s a coherent one. Consistency is the currency of leadership transitions.
• Cash is optionality—but optionality has reputational costs if it lasts too long.
• Investors will judge decisions against an impossible benchmark: “what would Buffett do?”
• The healthiest outcome is not imitation; it’s continuity of process with modern execution.
Berkshire’s story is a reminder that markets don’t only price assets. They price credibility—and credibility often lives in how leaders behave when the cameras are on.
5) Tesla’s Delivery Miss: When Incentives End, Reality Shows Up
Tesla’s reported fourth-quarter deliveries and the stock’s decline on the day were not just an EV story. They were a policy-and-demand story. When incentives change—like a tax credit ending—the market gets a real-world experiment in price elasticity: how much demand was structural, and how much was pulled forward by favorable terms?
This is one reason Tesla remains an unusually educational stock even for non-Tesla investors. It sits at the intersection of manufacturing constraints, consumer demand, policy incentives, and long-duration technology narratives. When a company like that misses expectations, the impact is rarely isolated. It forces investors to separate what they believe about the future from what customers are doing in the present.
The broader lesson for 2026 is not “EVs are up or down.” It’s that policy support can shape timing, and timing can look like a trend—until it doesn’t. Markets will likely face more of these “timing shocks” across sectors as fiscal and regulatory regimes evolve.
• Incentives can accelerate adoption, but they can also concentrate demand into specific windows.
• Delivery numbers matter because they anchor narratives in observable reality.
• A stock can reflect both near-term demand and long-term optionality—sometimes uncomfortably.
If 2025 taught markets anything, it’s that long-term narratives are strongest when they survive contact with quarterly data.
What to Watch Next: The Week After the “Reset” Day
Early-year sessions are often treated like omens, but they’re better treated as calibration. The first day doesn’t decide the year. It reveals which narratives the market is willing to entertain and which it is already suspicious of. In 2026, those suspicions will likely cluster around policy uncertainty, the path of rates, and whether growth can broaden beyond a narrow set of winners.
The most productive approach is not to chase the day’s winners, but to watch the next set of confirmations. Does leadership broaden? Do crypto and equities move together or diverge? Do commodities continue to tell a mixed story—or do they converge toward one dominant macro interpretation?
• Watch whether mixed index behavior becomes a pattern rather than a one-day event.
• Watch whether Bitcoin’s stability persists during equity volatility (a test of market structure).
• Watch whether oil remains low while metals remain high (a test of macro narratives).
Markets opened 2026 by showing their constraints. The next step is whether those constraints loosen—or become the plot of the year.
Conclusion
The first trading day of 2026 did not deliver a dramatic storyline—and that’s exactly why it’s worth studying. It was a diagnostic session. Stocks hinted at rotation rather than celebration. Bitcoin acted more like a reference point than a fireworks show. Metals stayed elevated while oil stayed restrained, underscoring that macro narratives are still unsettled. Berkshire reminded investors that credibility and capital allocation can be as important as growth. Tesla reminded everyone that incentives and real demand are not the same thing.
If there is one unifying message, it’s this: 2026 may reward investors who read markets as systems, not headlines. The year did not begin with a rally. It began with a map.
Frequently Asked Questions
Why does a mixed close (Dow/S&P up, Nasdaq flat) matter?
Because it often signals rotation and selective risk-taking rather than broad conviction. It can indicate that investors are comfortable owning certain exposures while hedging or reducing others.
Does Bitcoin hovering near $90K mean the market is “risk-on”?
Not automatically. Bitcoin can rise for many reasons, including positioning, liquidity conditions, and portfolio rebalancing. Context matters more than a single price level.
What does low oil but strong gold/silver usually imply?
It can imply mixed macro signals: oil may reflect supply expectations while metals may reflect hedging demand, currency dynamics, or policy uncertainty. The combination often points to “uncertainty” more than any single economic outcome.
Why is Berkshire’s cash pile important?
Large cash levels represent optionality and caution. They also shape expectations for acquisitions, buybacks, and investment strategy—especially during a leadership transition.
Disclaimer: This article is for educational purposes only and does not constitute financial, investment, legal, or tax advice. Markets involve risk, and prices can change rapidly. Past performance is not indicative of future results. Consider your objectives and risk tolerance and consult qualified professionals where appropriate.