Long Liquidations Back at FTX Levels: What This Bitcoin Flush Really Tells Us
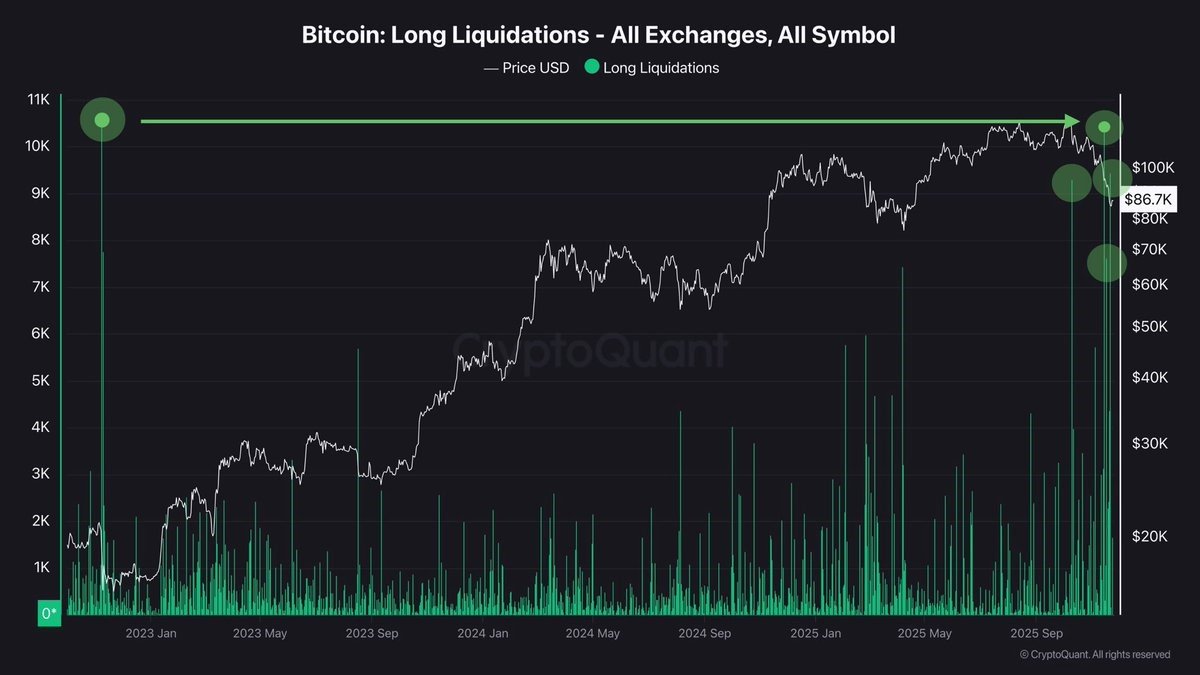
Bitcoin has just gone through one of the most violent deleveraging episodes since the FTX collapse in November 2022. The chart you provided, showing Bitcoin long liquidations across all major exchanges, makes the point visually: a towering green spike on the right-hand side that rivals the historic liquidation cascade at the start of the chart. Price, plotted in white, has fallen back toward the mid-80,000 USD region, but the fireworks have happened under the surface — in the derivatives engine rooms of the market.
Despite weeks of selling pressure, many traders did not step back. They kept trying to catch the falling knife, adding fresh long positions each time Bitcoin bounced a few thousand dollars. Over time, that behaviour built up a thick layer of leveraged longs sitting precariously below price. When the latest leg down arrived, those positions were wiped out in rapid succession, sending long liquidations to levels not seen since the FTX wipeout.
In this article we do not simply repeat that “a lot of longs were liquidated” — that part is obvious from the chart. Instead, we approach the event the way a professional research desk would: by examining the mechanics of how such cascades form, what they tell us about market structure and positioning, and how an investor can use this information without falling into the same leverage trap. All numerical values are taken from the scenario you described and the chart you shared; they are treated as indicative rather than audited live data.
1. What the Chart Is Actually Showing
The vertical green bars on the chart represent the USD value of long positions that were liquidated on derivatives exchanges on each day. The higher the bar, the more margin positions were forcibly closed by the exchanges’ risk engines because traders’ collateral was no longer sufficient to support their leverage.
The first big spike on the left corresponds to November 2022, when FTX imploded and Bitcoin briefly plunged below 16,000 USD. At that time, tens of thousands of BTC worth of longs evaporated as panic swept through the market. Since then we have seen many smaller waves of forced selling, but nothing quite as tall — until now. The latest bars on the right reach roughly the same magnitude, even though the price level today (around 86,000 USD) is several times higher than back then.
This is an important nuance. In 2022, liquidations were primarily about structural fear: a major exchange failed, counterparties were unsure who would blow up next, and liquidity conditions tightened abruptly. Today, the drivers are more about positioning and complacency — traders assumed that every dip would be bought instantly by ETFs and institutional demand, and they levered up accordingly.
2. How We Got Here: The Slow Build-Up of Long Risk
Liquidation cascades rarely come out of nowhere. They are the end result of a long process in which leverage builds up, risk management becomes lax and market narratives convince participants that downside is limited.
2.1 The post-ETF confidence trap
Ever since spot Bitcoin ETFs launched and accumulated massive inflows, a narrative took hold: “institutions are here; dips are for buying.” This story was not entirely wrong — ETFs did absorb a meaningful share of miner supply and spurred a new class of buyers. But markets are not one-way streets. As macro conditions tightened and ETF flows slowed or occasionally turned negative, thin order books met aggressive speculative positioning.
Retail and many smaller funds read each shallow pullback as proof that “ETFs will defend the level.” They bought futures rather than spot, using 5x, 10x or even higher leverage. Funding rates periodically spiked positive, a sign that longs were willing to pay rich financing costs to stay in the trade. Each micro-rally reinforced the belief that fading dips was “free money”.
2.2 The ladder of liquidations
Meanwhile, the exchange risk engines were quietly drawing a different picture. Every new long position comes with a liquidation price, usually set a few percent below the entry point depending on leverage and collateral type. When you aggregate thousands of such positions across venues, you get clusters of levels where forced selling will occur if price slices through quickly enough.
Over time, the market built a kind of ladder of fragile support — not real bids, but sandcastles of leverage. As long as price chopped sideways or drifted gently higher, nothing broke. But once a strong external shock arrived — ETF outflows, macro disappointment, or simply a loss of momentum — the ladder could turn into a domino chain.
3. Anatomy of the Current Flush
When Bitcoin finally broke down decisively from the 100,000–110,000 USD region, the first layer of highly leveraged longs was triggered. Those forced sales pushed price further down, which then hit the next cluster of liquidation levels, and so on. Because many traders used similar entry zones and leverage settings, these clusters were tightly packed. The result was a cascading liquidation wave.
The chart shows three especially large bursts of liquidation volume in quick succession at prices around 100,000 USD, 90,000 USD and finally the mid-80,000 USD zone. Each time, the spike in green bars corresponds to a violent downward extension on the price line. Importantly, this behaviour is mechanical. It is not that a mysterious “whale” decided to dump billions of dollars of BTC out of malice; rather, it is the natural consequence of leverage unwinding in a market where stop losses and liquidation engines are clustered in predictable places.
From a system-wide perspective, such events are both painful and healthy. They punish over-confidence, clear out excessive leverage and return power to spot buyers with real collateral instead of borrowed coins. But for the individual trader who was liquidated, the experience is brutal: the market takes not only his position but also his optionality to participate in the next move.
4. Why This Is Comparable to the FTX Collapse — and Why It’s Different
Calling the current event “comparable” to the FTX liquidations does not mean the underlying causes are identical. In 2022, leverage unwound as an exchange itself failed, destroying trust in custodians and lending desks. Today we are not dealing with the failure of a major venue in the same way; rather, we are looking at a mature bull cycle whose speculative excesses are being violently repriced.
However, from the perspective of derivatives market data, the similarity is striking. In both cases:
- Long liquidations spiked to record or near-record daily values across exchanges.
- The wipeout followed a period of optimistic positioning and elevated leverage.
- After the event, open interest dropped sharply, leaving a lighter and potentially more resilient market behind.
The difference is that, unlike late 2022, this episode is unfolding with Bitcoin still trading at multiples of its previous macro lows. That suggests we are dealing with a cyclical deleveraging within an ongoing higher-timeframe uptrend, rather than with the kind of structural confidence shock triggered by FTX.
5. What Professional Desks See in This Data
A professional trading or research desk does not look at liquidation charts just to marvel at how big the numbers are. They use them as part of a broader assessment of market structure. Here are a few key insights they might extract from the current spike.
5.1 The “easy long” trade is gone, at least for now
The presence of large long liquidations means many of the weak hands and late-stage FOMO buyers have been flushed out. That can be constructive for the longer term, but it also means that the previous pattern of relentless dip-buying may not resume immediately. Those who got wiped out now have less capital and more psychological scar tissue. In the short run, that reduces aggressive long participation on small dips.
5.2 Volatility is likely to stay elevated
Even though much leverage has been cleared, the memory of such a cascade tends to keep option implied volatility high. Market makers demand more premium to write downside protection; hedged funds may continue to chase gamma on both sides. From an investor’s perspective, that can create opportunities in selling richly priced options — but only if done with strict risk controls and a deep understanding of tail risk.
5.3 Spot holders have quietly gained relative power
When derivatives leverage shrinks, the marginal price setters shift back toward spot buyers and sellers. ETFs, long-term holders and treasuries who accumulate without leverage now have a larger relative influence on direction. For macro-oriented investors, this is a more comfortable environment: price becomes less sensitive to intraday liquidation cascades and more tied to genuine demand and supply.
5.4 Data now favours asymmetric accumulation over fresh leverage
Once a liquidation spike of this magnitude has occurred, risk-reward for leveraged longs generally worsens. There is less fuel for a short squeeze and still plenty of macro uncertainty. However, for investors using spot or modest leverage, the environment can be attractive: the market has already absorbed a significant shock, and positioning is cleaner.
6. How Long-Liquidation Data Can Be Misread
It is tempting to treat any massive liquidation event as an automatic buy signal: “liquidity has been flushed, time to go all in.” That is an oversimplification. Professional analysis requires a more nuanced view.
6.1 Liquidations clear leverage, not necessarily macro risk
A liquidation cascade says little about external drivers such as central-bank policy, regulatory surprises or ETF flows. If those macro factors stay negative, price can continue to drift lower even after leverage is reduced. In other words, solvency and sentiment can change faster than macro conditions.
6.2 Past extremes are a guide, not a guarantee
Comparing the current spike to FTX helps contextualise its scale, but it does not guarantee the same outcome. After FTX, Bitcoin spent months carving out a base before trending higher. This time, the recovery path could be faster or slower depending on external factors. Investors who blindly assume a rapid V-shaped reversal from any record liquidation risk being early — and being forced out again.
6.3 Exchange data has blind spots
Liquidation statistics typically cover major centralised exchanges. They say little about leverage embedded in structured products, OTC instruments, options or in non-transparent venues. The visible spike might represent only part of the deleveraging; some hidden pockets of risk may still be unaddressed.
7. Practical Framework for Investors
Given those caveats, how should a disciplined investor or trader use this information?
7.1 Separate timeframe from narrative
On a multi-year horizon, the fact that Bitcoin can absorb FTX-scale liquidation waves while still trading at many times the 2022 lows strengthens the argument that the asset is maturing. On a multi-week horizon, however, the same event tells you that volatility remains high and that further whipsaws are likely. Align your position sizing and leverage with the timeframe you truly care about, not with whatever time horizon Twitter is screaming about.
7.2 Favour spot and staged entries
For most non-professional participants, the healthiest way to express a constructive view after such a flush is simple: spot accumulation in tranches. If you believe that long-term fundamentals remain intact, you can scale in gradually as the market digests the shock, using clear invalidation levels rather than hoping to nail the exact bottom.
7.3 If you must use leverage, treat it like a perishable resource
Some participants will always trade futures and perpetuals; that is the reality of crypto markets. If you are one of them, treat leverage as something that should be deployed sparingly and temporarily. Post-cascade environments reward patience: wait for signs that open interest has rebuilt, funding has normalised and liquidity has returned before sizing up again. And always assume that another liquidation spike is possible.
7.4 Combine liquidation data with other on-chain and macro signals
Long-liquidation charts are most powerful when combined with:
- On-chain indicators such as realised price, NVT Golden Cross or long-term holder supply, which show whether genuine demand is stepping in.
- ETF flow data, to gauge whether institutions are net buyers or sellers during the deleveraging.
- Macro indicators like interest-rate expectations and dollar strength, to understand whether broader risk appetite is improving or deteriorating.
When several of these lenses align — for example, a massive long-liquidation event occurs just as on-chain value metrics signal undervaluation and ETF outflows stabilise — the case for accumulation becomes stronger.
8. What This Says About Bitcoin’s Maturity
Perhaps the most interesting takeaway is not the drama of the liquidation spike itself, but how the market absorbed it. Despite a notional volume comparable to the FTX capitulation, there has been no systemic exchange failure, no widespread insolvency rumours, and no chain of bankruptcies (at least in the scenario you described). The market structure has evolved: collateral is more diversified, risk engines are more battle-tested and major custodians are better capitalised.
That does not mean crypto is suddenly risk-free. It means that Bitcoin is now liquid and institutional enough that even deep deleveraging can be treated as part of a continuing cycle, not as an existential shock. Long liquidation spikes are likely to remain a recurring feature of this market for as long as high-leverage perpetuals exist. But over time, their impact on long-term trend may diminish relative to macro adoption drivers such as ETF integration, corporate treasury use and sovereign-level interest.
Conclusion
The latest wave of Bitcoin long liquidations, rivaling the intensity of the FTX collapse, is a powerful reminder of how much leverage hides beneath a seemingly calm surface. For traders who tried to buy every dip with borrowed coins, it has been a harsh lesson in risk management. For patient investors and professional desks, however, the event provides valuable information: speculative excess has been flushed, the easy leverage trade has been reset and price is once again being shaped more by real capital than by high-risk gaming venue-style speculative positions.
Whether this marks the exact bottom of the current correction cannot be known in real time. What can be said, based on the liquidation and price behaviour visible in the chart, is that we are much closer to the end of the leverage purge than to its beginning. As always, the winners in the next phase are unlikely to be those who traded the largest position, but those who survived the cascade with enough dry powder — and emotional stability — to act when others were forced out.
Disclaimer: This article is based on the scenario and chart data you provided and does not rely on live market feeds. It is for informational and educational purposes only and does not constitute investment, trading, legal or tax advice. Digital assets and leveraged derivatives are highly volatile and can result in the loss of all capital invested. Always conduct your own research and consider consulting a qualified professional before making financial decisions.