
No Q4 Blow-Off: What USDT Dominance and the Latest Drawdown Say About Bitcoin’s Cycle
In previous bull cycles, the script for the final act felt almost predictable. In 2017 and again in 2021, markets entered the last quarter of the year with strong momentum, delivered a euphoric vertical move, and then rolled over into a deep bear market. By contrast, the current cycle has taken a different turn. Since around 11 October, Bitcoin has not produced the classic Q4 melt-up. Instead, it has slipped roughly 35% from its high, leaving traders debating whether the four-year pattern has finally broken—or whether the market is simply writing a slower, stranger version of the same story.
Two pieces of evidence stand out in this phase. First, the behaviour of MicroStrategy (MSTR), the publicly listed company most closely associated with a corporate Bitcoin strategy, looks noticeably more muted than during earlier peaks. Second, USDT dominance—the share of total crypto market cap represented by Tether—has surged back into a zone that previously marked important local lows, as shown in the accompanying chart. Both metrics offer useful context for understanding how this drawdown differs from the last one and what it might mean for the weeks ahead.
1. A 35% Drawdown That Feels Different
On the surface, a 35% decline from the top is nothing new for Bitcoin. Historically, even strong bull trends have included sharp corrections of 30–40%, often without invalidating the larger move. What feels different this time is the character of the selling and the behaviour of key proxies like MicroStrategy.
During the previous major correction, MicroStrategy’s share price traded at roughly twice the net asset value implied by its BTC holdings—a Market NAV (mNAV) of around 2. In plain language, the market was not just valuing the company’s existing Bitcoin stack; it was also paying a large premium for the option that the company would continue to buy aggressively into weakness. That premium turned MicroStrategy into a kind of leveraged call option on Bitcoin’s future adoption.
In the current drawdown, by contrast, the mNAV of MicroStrategy has hovered closer to 1. The equity still reflects some operational value and strategic optionality, but the market is no longer assuming that the company has unlimited appetite or capacity to keep adding BTC on every dip. That change matters for sentiment. When MicroStrategy was perceived as an almost price-insensitive buyer, every correction came with a built-in narrative: eventually, the corporate whales would step back in and drive the next leg higher. A flatter mNAV suggests that investors now see fewer bullets left in that particular chamber.
This does not mean MicroStrategy is “finished” as a Bitcoin vehicle, or that corporate demand has disappeared. It simply means that a powerful psychological tailwind—the expectation of relentless treasury accumulation—has weakened. Without that tailwind, the market has to work harder to find incremental buyers, especially after a long run-up.
2. USDT Dominance at a Stress Line
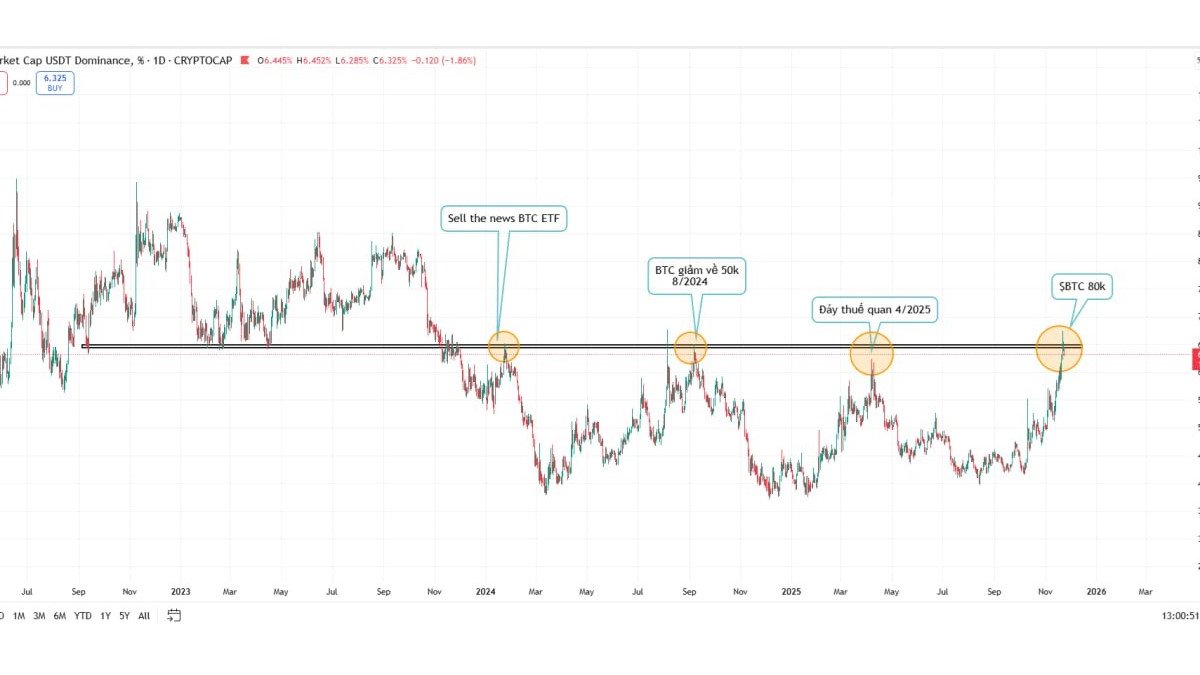
The second notable feature of this phase is the behaviour of USDT dominance (USDT.D), charted as Tether’s market capitalisation relative to the overall crypto market cap. When traders sell coins into stablecoins, USDT.D tends to rise; when they rotate back into risk assets, it falls.
The chart shows that USDT.D has climbed back to a horizontal band around 6–7%, an area that has repeatedly coincided with important inflection points:
- A spike in this zone accompanied the “sell the news” reaction to the first spot Bitcoin ETFs, when traders who had bought the rumour rushed to lock in profits.
- Later, another touch aligned with a correction that brought BTC back toward the $50,000 area in mid-2024.
- A third instance appeared near what many saw as the tax-season low in April 2025, when forced selling to meet tax obligations met with bargain hunting.
The latest surge in USDT.D has once again pushed the indicator into that same region, prompting some analysts to argue that the market is carving out a new bottom. It is important, however, to treat this as an indicator of stress rather than a magic crystal ball.
High USDT dominance tells us that a meaningful share of capital has moved to the sidelines, preferring dollar-denominated stability over volatile assets—at least temporarily. Historically, such spikes have often lined up with attractive entry points for long-term investors, but the indicator does not specify when or how quickly confidence will return. Markets can stay cash-heavy for longer than impatient traders expect, especially when macro headlines are noisy and positioning has been stretched.
3. Why Late Cycles Produce “Confidence Pumps”
One of the more uncomfortable truths about crypto cycles is that deep corrections rarely unfold in a straight line. Even within broader downtrends, markets frequently stage short but dramatic rallies in specific tokens—what some traders call “confidence pumps.” These moves pull sidelined participants back into the market by reminding them just how quickly prices can move.
A classic example from the previous cycle was GMT, which delivered an eye-catching rally—reportedly up to 40x from its initial levels—before the broader market rolled over again. The rally did not reverse the cycle, but it did capture attention and temporarily delayed the recognition that a more prolonged bear phase had begun.
When USDT dominance is high and sentiment is fragile, the environment is ripe for similar episodes. Capital parked in stablecoins can move quickly when a compelling narrative appears, especially if the token in question has:
- a relatively low circulating supply,
- a recognisable brand or story, and
- visible exchange support and liquidity.
That is why some market watchers expect one or two older names—sometimes dubbed “cycle antiques”—to produce outsized moves. Coins such as LTC, XVG, or niche ecosystems like ASTER that have not yet seen a major rally this cycle can become candidates for short, sharp bursts of attention, much like ZEC did when it surprised to the upside earlier in the year.
From an educational perspective, it is essential to separate the psychology of these confidence pumps from the sustainability of their price action. Late-cycle rallies in older coins often rely more on nostalgia and momentum than on new fundamental breakthroughs. They can be dramatic, but they can also reverse quickly once the initial burst of enthusiasm fades. Observing them can be instructive; chasing them without a clear risk framework can be dangerous.
4. One Month Left: The Yearly Candle and the Four-Year Story
Another theme running through market commentary is the focus on the yearly candle. With roughly one month left in the calendar year, Bitcoin’s current yearly bar has been flirting with the boundary between red and green. For traders who think in weekly timeframes, that might sound trivial. For investors and storytellers, it matters more than it seems.
The popular four-year halving narrative is built on a simple observation: historically, Bitcoin’s strongest yearly performances have clustered around the halving cycle. When the yearly candle closes green, it reinforces the idea that the long-term structure is intact; when it closes red near the end of a cycle, it raises the question of whether something has changed. Because narratives often influence behaviour, a final-month recovery that “rescues” the yearly candle can have a self-reinforcing effect. It becomes easier to say that the cycle has played out according to plan, even if the path was bumpier than expected.
This is not a prediction that Bitcoin will end the year green. It is a reminder that many participants are watching the chart through this lens. If a late Q4 rally materialises, part of the fuel may come from funds and individuals who prefer to enter while the yearly picture still aligns with their mental model of a four-year cycle.
5. Key Levels for BTC, ETH and SOL
From a pure price-structure standpoint, Bitcoin, Ether and Solana have now travelled back toward zones that many technicians regard as structurally important:
- For Bitcoin, the current region sits near prior breakout levels and former consolidation bands—areas where the market previously debated value before resolving higher.
- Ether has revisited ranges that hosted significant spot ETF speculation and DeFi repricing earlier in the cycle.
- Solana, after a powerful run, has retraced towards support zones defined by high-volume areas on the chart and the aftermath of earlier liquidation events.
Technically, such regions often act as decision points. They are places where both buyers and sellers have clear memories: some remember being rewarded for buying there before, others remember missing the move and may be eager to finally get exposure. That mixture can produce volatile but ultimately constructive trading if macro conditions are supportive.
The market’s behaviour around these levels over the next few weeks will likely determine whether this drawdown is remembered as a mid-cycle reset or as the first leg of a larger top. A determined bounce with improving breadth and falling USDT dominance would fit the former pattern. A failed attempt followed by renewed selling and another spike in stablecoin share would resemble the latter.
6. Interpreting the Signal Without Overfitting
It is tempting to look at the USDT dominance chart, the MicroStrategy premium, and the calendar and conclude that the path forward is obvious. History, however, argues for humility. Markets are particularly good at taking patterns that seemed reliable in the last cycle and breaking them in the next.
Instead of treating any single metric as a forecast, it is helpful to view them as pieces of a probabilistic puzzle:
• The 35% drawdown tells us that leverage has been partially flushed out and that many short-term trend followers have been shaken.
• The muted MicroStrategy premium suggests that the “corporate white knight” narrative is less dominant, pushing the market to look for other sources of demand.
• The elevated USDT dominance signals caution and optionality rather than panic: capital has stepped to the side, but has not left the ecosystem entirely.
• The possibility of confidence pumps in overlooked altcoins reminds us that late-cycle volatility often concentrates in a few names rather than lifting the whole complex.
• The focus on the yearly candle reflects the power of narratives; if a bounce does occur, it may attract additional flows simply by keeping the four-year story intact.
By combining these elements, investors can map scenarios and prepare responses, rather than anchoring on a single deterministic view. For example, one scenario might involve a sharp recovery that turns the yearly candle green and drags a selective group of altcoins higher; another could feature a slower, grinding base-building process with only occasional spikes in individual tokens; a third might see macro or regulatory shocks extend the drawdown despite USDT dominance already being elevated.
7. A Market Resetting Expectations, Not Ending
The absence of a classic Q4 blow-off has prompted some commentators to declare the four-year cycle “dead.” That is probably too strong. What the current configuration suggests is not the end of cycles, but a reset in expectations. With ETFs live, large corporates already holding BTC, and some jurisdictions even considering Bitcoin in strategic reserves, the set of marginal buyers and sellers has changed. The market may simply no longer need—or be able—to generate the same kind of vertical finale that defined earlier eras.
For long-term participants, this reset carries both risks and opportunities. On the risk side, it means that anchoring on past playbooks—“Q4 always pumps,” “alts always follow,” “MicroStrategy always buys the dip”—can be costly. On the opportunity side, it rewards those who focus on balance-sheet strength, genuine protocol usage, and risk management over pure narrative.
Whether Bitcoin ends the year red or green, the structural conversation is increasingly about how the asset fits into portfolios and financial infrastructure, not whether it belongs there at all. In that sense, a quieter Q4 and a more complex drawdown may be signs of maturity rather than weakness.
Nothing in this article is a prediction of future prices or a recommendation to buy, sell or hold any digital asset. The discussion is intended solely for informational and educational purposes, to help readers understand how different indicators and narratives interact during a market correction. Digital assets are volatile and can involve a high risk of loss. Always conduct your own research and consider speaking with a qualified financial professional before making investment decisions.


