
Has Bitcoin Bottomed? What Whale Accumulation Says – and What It Does Not
The last 24 hours in Bitcoin have looked deceptively calm on the surface. Spot prices have been oscillating in a relatively narrow range, liquidations have cooled off from their recent spike, and funding rates have drifted back toward neutral. Under the hood, however, the on-chain picture is anything but quiet. According to the latest Bitcoin Accumulation Trend Score v2, the largest investors are sending a mixed but important signal: some whale cohorts are quietly rebuilding positions, while others are still taking liquidity off the table.
That begs the question every market participant eventually asks: has Bitcoin already carved out a bottom, or is this just another pause before the next leg lower? A single chart cannot answer that definitively, and any analysis that pretends otherwise should be treated with caution. But the behaviour of large holders can help frame the discussion in a more disciplined way. Rather than guessing where the absolute low sits, we can ask who is actually buying, who is selling, and how that pattern compares with prior cycles.
Reading the Accumulation Trend Score
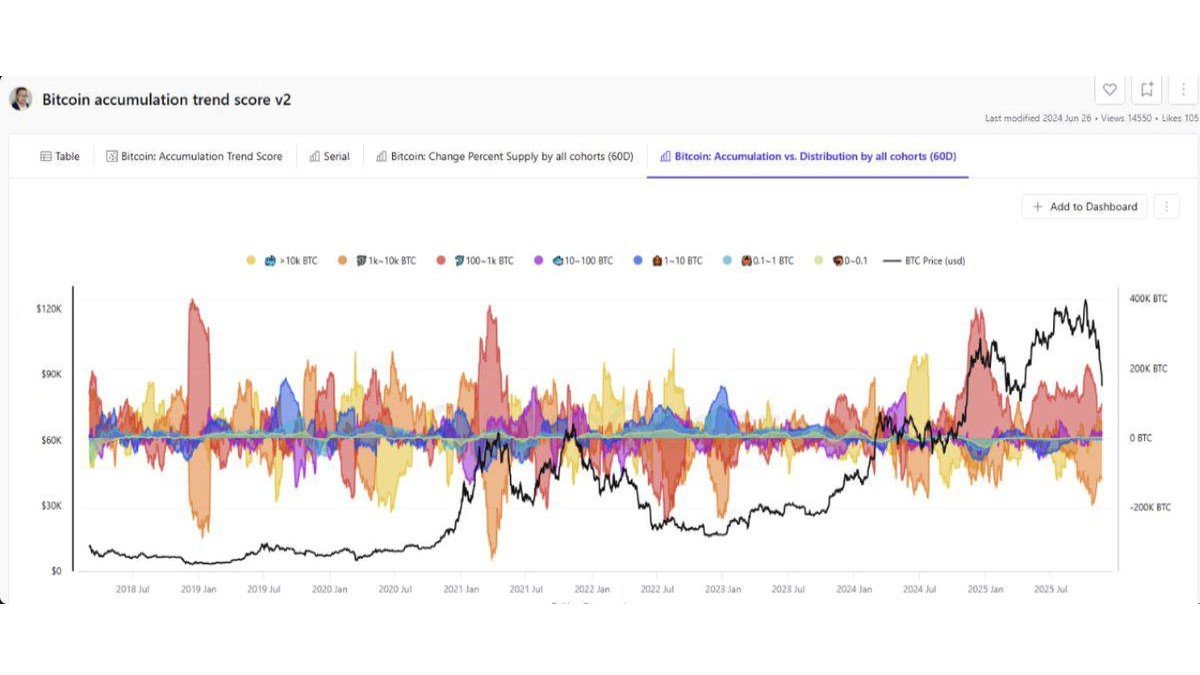
The Bitcoin Accumulation Trend Score aggregates wallet-level data across size bands and displays whether each cohort is, on net, accumulating or distributing over a rolling window. On the chart, you can see coloured bands above or below a zero line: positive values indicate net accumulation, negative values show net selling. Layered on top is the black line of the Bitcoin price.
What stands out in the current snapshot is the contrast between different whale groups:
- Wallets holding 100–1k BTC have flipped into clear accumulation, with sustained positive readings.
- The largest cohort, those with more than 10k BTC, is also leaning toward net buying, albeit in a more measured fashion.
- Meanwhile, the 1k–10k BTC group remains in distribution mode, consistently printing negative scores as they continue to sell.
In other words, two whale cohorts are reinforcing the idea of a local floor by mopping up supply, while a third cohort is still stepping away from the table. That split goes a long way toward explaining why the market feels like it is stabilising but not exploding higher: there is just enough fresh demand to absorb selling pressure, but not enough to trigger a decisive trend reversal.
Why 100–1k BTC and 10k+ BTC Cohorts Matter
Wallets in the 100–1k BTC range are often associated with serious high-net-worth individuals, smaller funds, family offices and early-stage treasuries. They are large enough to matter, but small enough to be nimble. Historically, this cohort tends to accumulate during uncertainty, when retail participation is subdued and headlines are more fearful than greedy. Their recent shift into sustained net buying suggests that a meaningful slice of sophisticated capital sees value around current price levels.
The 10k+ BTC cohort is different in character. These are mega-whales: exchanges, custodians, very early adopters, large mining treasuries and a handful of institutional players whose positions have been built over many years. Their flows are less frequent but more strategic. When the trend score shows this group tilting toward accumulation, it usually reflects long-horizon decisions—rebalancing corporate balance sheets, provisioning collateral for future products, or locking in inventory for market-making operations.
When both of these groups move in the same direction, the market gets something it badly needs during drawdowns: a structural buyer. Even if they are not actively pushing the price higher, they create a soft floor by absorbing coins from weaker hands. That is a classic ingredient of bottom formation. The chart supports that intuition: previous clusters of strong accumulation by 100–1k BTC and 10k+ BTC wallets tend to appear near major lows or after sharp liquidations, when long-term investors step in to rebuild positions.
The 1k–10k BTC Cohort: The Missing Piece of Confirmation
The caveat is that the 1k–10k BTC cohort has not joined the party. Instead, this group continues to distribute, selling into any strength and leaning against the attempt to build a durable base. Why does that matter?
Wallets in the 1k–10k BTC band often map to professional but flexible capital: hedge funds, crypto-native trading firms, proprietary desks and some long-only vehicles that actively rebalance. They sit in between the high-conviction mega-whales and the more granular 100–1k BTC cohort. In previous cycles, these entities have often been the ones to front-run trend reversals, adding early when they perceive capitulation and trimming when they sense euphoria.
Their current net selling can be interpreted in a few ways:
• Risk management. After a volatile year, many funds may simply be de-leveraging, reducing gross exposure and locking in profits or cutting underperforming positions ahead of year-end.
• Rotation. Some capital could be moving from Bitcoin into other themes such as layer-2 tokens, real-world asset protocols or AI-adjacent plays, particularly if mandate constraints push them toward “higher beta” opportunities.
• Liquidity provisioning. Market-making firms may be supplying inventory to meet renewed demand from ETFs, options desks or structured products, effectively transferring coins from their own books to more passive holders.
None of these explanations is inherently bearish, but they do mean that the market lacks a unified whale signal. As long as 1k–10k BTC wallets continue to lean against rallies, any bounce is likely to feel like a range rather than a clean new trend. That is why talking about a “confirmed bottom” is premature: one of the most historically important cohorts is still voting with its feet in the opposite direction.
How Today’s Pattern Compares With Past Bottoms
Looking back across previous cycle lows, a few patterns emerge. Major bottoms—in 2018, during the COVID shock in 2020, and after the 2022 deleveraging wave—were usually characterised by three ingredients:
- Sharp, forced selling by over-leveraged entities (exchanges, lenders or funds).
- Heavy short-term realised losses as newer entrants capitulated.
- Broad-based accumulation across most large cohorts once the dust settled.
In those regimes, the accumulation trend score tended to show multi-cohort alignment: 100–1k BTC, 1k–10k BTC and 10k+ BTC wallets all shifted toward net buying within the same general time window, even if the intensity varied.
Today’s pattern is similar but not identical. We have seen substantial drawdowns and pockets of forced selling, but the 1k–10k BTC cohort’s continued distribution sets this episode apart. That does not mean a deeper low is guaranteed; markets can and do bottom with some participants still sceptical. It does, however, suggest that the bottoming process may be more drawn out and uneven than prior V-shaped reversals.
One useful way to interpret the current configuration is as a two-thirds bottom: a significant portion of long-horizon capital is already repositioning for the next phase, while another important slice is still clearing its books. Historically, that type of split has often coincided with extended accumulation zones, where price chops sideways within a band as supply gradually transfers from tactical traders to strategic holders.
Local Bottom vs. Cycle Bottom
Another key distinction is between a local bottom and a cycle bottom. On-chain data is often very good at flagging exhaustion points—zones where sellers are running out of ammunition and long-term holders are quietly stepping in. It is less reliable at telling you whether that exhaustion marks the absolute low of a multi-year cycle or simply a pause in a larger downtrend.
The current data is compatible with a local bottom. The combination of whale accumulation, cooling derivatives metrics and improved spot liquidity suggests that the most aggressive phase of the sell-off may be behind us, at least for now. But a cycle bottom usually requires a broader shift in macro conditions, risk appetite and regulatory visibility. Those factors are outside the scope of on-chain metrics, even if they eventually show up indirectly through flows.
For long-term investors, the takeaway is not that the bottom is “in” or “out”, but that the character of the market has changed. We are no longer in a regime of indiscriminate selling; we are in a regime of redistribution, where some large players are exiting and others are entering at roughly the same price zone. That is what a transition often looks like in real time.
What This Means for Market Structure
The split behaviour of whale cohorts also has implications for how future moves might unfold. When 100–1k BTC wallets and 10k+ BTC entities accumulate, they reduce the available float of Bitcoin that can be easily shaken out by short-term volatility. Coins held by long-term, low-turnover entities tend to move less frequently, which can tighten the supply-demand balance once fresh spot interest returns.
At the same time, the ongoing selling from 1k–10k BTC holders effectively provides liquidity for that transfer. Instead of a classic capitulation wick where prices plunge and rebound in hours, the market may experience a slower, more orderly handoff. That kind of structure can be healthier for future price discovery, but it can also be frustrating for traders looking for clear signals: the absence of a single dramatic flush makes it harder to define a neat “before” and “after”.
In practice, this environment favours patient capital and robust risk management frameworks. Rapid leverage cycles may still appear in derivatives, but the underlying spot flows suggest a market in consolidation rather than mania or despair.
How to Use (and Not Use) Whale Data
It is tempting to treat whale accumulation charts as a cheat code: when the colours turn positive, buy; when they turn negative, sell. That approach misunderstands both the strengths and the limitations of on-chain analytics.
What whale data can do well is provide context. It can show whether the marginal seller is a short-term speculator or a long-term holder, whether price moves are backed by genuine spot flows or dominated by leverage, and whether large entities are using volatility to exit or to accumulate. Those insights are valuable for anyone trying to understand the state of the market, regardless of their time horizon.
What whale data cannot do is promise a specific outcome. Large holders mis-time cycles, change their minds, or respond to idiosyncratic constraints just like any other investor. Wallet labels are imperfect, flows can be obfuscated by internal transfers, and the historical sample of major cycles is still small. Treating any single metric as a standalone “signal” is more likely to create overconfidence than outperformance.
A brand-safe way to think about these tools is as part of a triangulation process. Combine them with macro analysis, liquidity conditions, derivatives positioning and your own risk tolerance, rather than letting them override all other inputs.
Three Scenarios From Here
Instead of predicting a single future, it is often more useful to map a few plausible paths:
• Sideways accumulation. The most conservative scenario is that Bitcoin spends an extended period in a range, with 100–1k BTC and 10k+ BTC cohorts continuing to accumulate while 1k–10k BTC wallets slowly finish distributing. Volatility compresses, realised ranges shrink, and the market gradually rebuilds a base.
• Constructive validation. In a more optimistic path, the 1k–10k BTC cohort eventually flips from net selling to net buying as macro conditions stabilise or new catalysts emerge. At that point, the accumulation trend score would show alignment across all three whale groups, offering a stronger confirmation that the bottoming process has matured.
• Another leg lower. In the more adverse scenario, an external shock—macro, regulatory or idiosyncratic—forces further deleveraging. Even then, the current accumulation by some cohorts may act as a buffer, but it would not fully immunise the market from renewed downside. In that environment, watching whether whales accelerate their buying or step back again would be critical.
None of these outcomes is predetermined. The point is to use today’s on-chain configuration as a starting point for scenario planning, not as a verdict.
Bottom Line: A Market in Transition, Not in Denial
So, has Bitcoin bottomed? The honest answer is that the market appears to be in the early stages of a potential bottoming process, supported by accumulation from 100–1k BTC and 10k+ BTC holders, but still lacking full confirmation from the 1k–10k BTC cohort. That divergence explains the current mix of resilience and hesitation: enough demand to stabilise, not yet enough agreement to trend.
For observers trying to make sense of this phase, the key is to recognise the structural shift without overstating its certainty. The fact that some of the deepest pockets in the space are leaning into this range should not be ignored; nor should the persistence of selling from an equally important set of large holders. Between those two forces lies the messy reality of price discovery.
This article is for informational and educational purposes only and does not constitute financial, investment, legal or tax advice. Nothing herein should be interpreted as a recommendation to buy, sell or hold any digital asset, nor as a guarantee that any market level represents a bottom or a top. Digital assets are volatile and may not be suitable for all investors. Always conduct your own research and consider speaking with a qualified professional before making financial decisions.


