
Is U.S. Demand Returning? Reading the Coinbase Bitcoin Premium
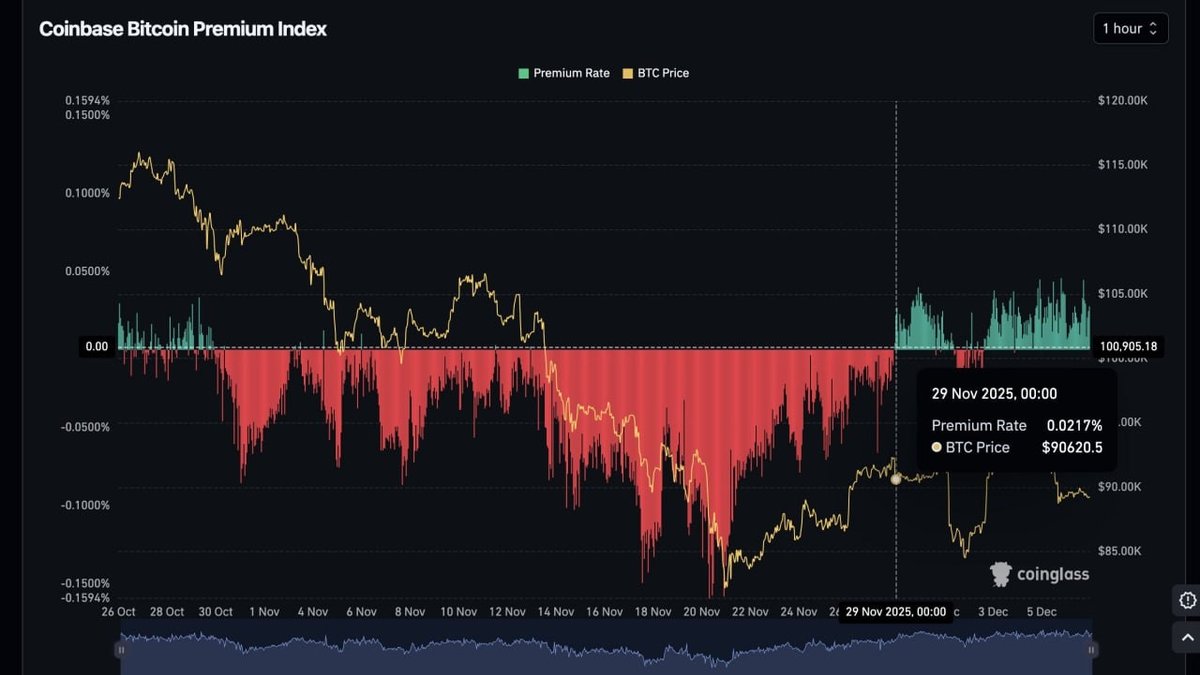
Since late November, one market-structure metric has quietly flipped from red to green: the Coinbase Bitcoin Premium Index. After almost a month of trading at a discount to major offshore venues such as Binance and OKX, Bitcoin on Coinbase is once again priced slightly higher than the global average. The Coinglass chart you see attached illustrates the shift clearly: deep red negative readings dominated most of November, followed by a cluster of positive green bars as the calendar turned toward December.
At first glance, a few basis points of price difference may not look like much. Yet this metric is closely watched because Coinbase remains the primary exchange used by many U.S. based investors, including institutions, funds and higher income retail users. When the index spends extended periods above zero, it usually means that capital located in the United States is more eager to buy than sell, even if overseas markets remain more cautious. In other words, a persistent positive premium is often interpreted as the U.S. bid quietly returning to the market.
This article unpacks what the Coinbase Premium Index actually measures, why its recent move back above zero matters, and how to interpret the signal without overreacting to it. The goal is not to give timing calls, but to help readers understand how regional demand imbalances show up in data and what they might imply for Bitcoin over the medium term.
What Does The Coinbase Bitcoin Premium Index Measure?
The Coinbase Bitcoin Premium Index tracks the percentage difference between the price of Bitcoin on Coinbase's USD market and its price on other large spot exchanges, most commonly Binance's BTC/USDT pair or a basket of global venues. When the index is positive, BTC is trading at a higher price on Coinbase than on those comparison markets; when it is negative, Coinbase is cheaper than the rest of the world. Several analytics providers, including Coinglass, CryptoQuant and others, publish versions of this metric and treat it as a proxy for U.S. capital flows.
The reason this index is often read as a gauge of American demand is straightforward. Coinbase has historically been the entry point of choice for many regulated entities, professional managers and higher net-worth individuals in the United States. These participants tend to move larger tickets than casual retail users. If they are competing to buy spot Bitcoin on Coinbase faster than arbitrage desks can balance the order books across exchanges, the price on Coinbase can rise slightly above the global average, creating a positive premium. The reverse is also true: when there is sustained selling pressure or a lack of aggressive buyers in the U.S., the Coinbase price may trade at a small discount.
It is important to emphasise that the premium is usually small in absolute terms, often fractions of a percent. In a highly connected market with active arbitrageurs, large mispricings do not last long. What matters is not a single spike, but the pattern: whether the index spends weeks mostly above, around, or below the zero line, especially during periods when Bitcoin is making large moves in either direction.
What Changed In Late November?
Throughout much of November, the Coinbase Premium Index was deeply negative. The attached chart shows extended stretches of red bars as U.S. traders were either taking profits or stepping back while buyers on offshore venues absorbed supply. This period coincided with a sharp pullback in BTC from its previous highs, a reset in leveraged positioning and a more cautious tone across macro assets as markets reassessed the path of interest rates.
That backdrop began to shift in the final days of the month. Around November 28–29, several data sources reported that the Coinbase premium flipped back into positive territory after nearly a month below zero, with readings clustering in the low basis points range. At roughly the same time, flow data showed a return of net inflows into U.S.-listed Bitcoin exchange traded products and a stabilisation of the spot price above key psychological levels. Taken together, these signals suggest that the marginal U.S. buyer is once again willing to step in on dips rather than consistently provide sell-side liquidity.
From early December onward, the chart has mostly stayed green, even as overall volatility remained moderate. This kind of quiet, persistent premium is often more informative than dramatic spikes. It implies a steady bias toward accumulation from the U.S. side of the market, rather than a short-lived rush of momentum trading. Of course, the picture can change quickly if macro conditions or regulatory headlines move, so it is useful to treat the current pattern as provisional rather than permanent.
Why A Positive Coinbase Premium Points To U.S. Capital Coming Back
When Bitcoin on Coinbase trades at a premium, it effectively means that someone in the United States is willing to pay a little extra to obtain exposure immediately, instead of routing orders to cheaper venues abroad. This behaviour is easiest to justify for participants whose operational, regulatory or mandate constraints make U.S.-domiciled, fully documented exchanges the default option. That includes many asset managers, corporate treasuries and professional investors who report to boards, risk committees or regulators.
For that group, the cost of seeking the absolute lowest execution price on a global venue may be higher than the benefit. They may value transparent reporting, tax documentation and connectivity to existing banking partners over small price differences. As a result, when they decide to increase exposure, their demand first shows up on platforms such as Coinbase, Kraken or regulated ETF vehicles rather than on less supervised exchanges. The Coinbase Premium Index captures this behaviour as a slight but persistent distortion in the price data.
Retail investors in the U.S. who prefer simple user interfaces and seamless integration with domestic payment rails can produce a similar effect. When sentiment among this cohort shifts from fear to cautious optimism, they may begin placing recurring purchases or opportunistic buys using their existing Coinbase accounts. While each individual order might be modest, the aggregate impact can still tilt the local order book enough to keep the premium above zero.
Institutional Versus Retail: Reading The Indicator Carefully
Because Coinbase is popular with professional investors, a positive premium is often framed as evidence of institutional accumulation. The reality is more nuanced. On-chain and order-book data cannot always cleanly separate hedge funds, family offices, corporates and affluent individuals, especially when they use similar execution channels. What the data does show is that U.S.-linked demand is no longer consistently on the sell side, which is already a meaningful change compared with the earlier part of the quarter.
It can be helpful to think of the Coinbase Premium Index as a broad thermometer rather than a microscope. Rising into positive territory signals that U.S. entities are, on balance, more inclined to add exposure than to reduce it. Whether that flow is dominated by long-term allocators, fast-moving funds or active retail traders requires additional context: ETF flows, derivatives positioning and wallet behaviour. In practice, analysts combine these datasets to build a richer picture instead of relying on any single indicator.
For example, when a positive premium coincides with inflows into spot Bitcoin ETFs, stable funding rates in derivatives markets and no obvious stress in lending venues, the case for a genuine improvement in sentiment strengthens. If, on the other hand, the premium spikes briefly while derivatives leverage climbs sharply and ETF volumes remain muted, the reading may reflect short-term positioning rather than a durable shift in long-horizon capital.
How This Episode Compares With Past Cycles
Historically, extended periods of positive Coinbase premium have often lined up with phases when U.S. investors were particularly active buyers. During parts of the 2020–2021 bull market, for instance, the index spent weeks well above zero as corporations, funds and high net-worth individuals accumulated Bitcoin via Coinbase and related platforms. Conversely, long streaks of negative readings have tended to appear during risk-off phases, when U.S. participants either reduced exposure or preferred to wait on the sidelines while overseas markets played a larger role.
The current episode is more moderate in scale. Premium readings in late November and early December are positive but not extreme, and Bitcoin is trading in a broad range rather than in a parabolic move. That makes this an instructive case study for students of market structure: it shows how an improvement in regional sentiment can appear first as a subtle shift in pricing rather than as a headline-grabbing surge. If the premium remains steadily positive while other data, such as ETF flows and on-chain accumulation metrics, also improve, it could mark the early stages of a more constructive phase led by U.S. capital.
At the same time, it is worth remembering that correlation does not guarantee causation. Not every positive streak in the premium leads to a sustained advance, just as not every negative streak precedes a major drawdown. The index is best viewed as one input in a broader mosaic, grounding narratives about U.S. demand in observable data instead of anecdotes alone.
The Limits Of The Indicator
Like any single metric, the Coinbase Premium Index has limitations. First, it primarily reflects conditions on one exchange pair versus a handful of comparison venues. If liquidity temporarily thins out on Coinbase for technical or operational reasons, the premium could move even if underlying investor appetite has not changed. Second, arbitrage desks work constantly to capture price differences between exchanges. Their activity can dampen or distort the premium, especially during periods of heavy volume when automated strategies are most active.
Third, the index does not directly capture demand expressed through U.S.-domiciled ETFs, structured products or over-the-counter desks. Those channels have become increasingly important since the approval of spot Bitcoin funds, which allow institutions to gain price exposure without handling the asset directly. When ETF flows and OTC activity are strong, some of the demand that might once have shown up on Coinbase spot markets instead appears in those instruments. Analysts therefore need to interpret a modest premium in the context of a changing market ecosystem.
Finally, the indicator says nothing about valuation in isolation. A positive premium tells us that U.S. buyers are relatively more eager than their offshore counterparts at a given moment; it does not say whether the overall price level is sustainable, stretched or attractive. Assessing those questions requires a wider toolkit: macro analysis, on-chain data such as realised price or dormancy, and a clear understanding of individual risk tolerance and time horizon.
Scenarios For The Months Ahead
Looking forward, there are several broad scenarios for how the Coinbase premium and broader market could evolve. In a constructive scenario, U.S. demand remains steady or gradually increases, keeping the premium mostly positive even during short-term pullbacks. ETF inflows stabilise, macro conditions remain supportive, and Bitcoin grinds higher in a more measured fashion. In this environment, the premium would serve as a confirmation tool that U.S. capital is participating in the advance in a disciplined way.
In a more volatile scenario, rapid price swings pull the premium in both directions as emotions rise and fall. Short bursts of optimism could push the index sharply higher, followed by periods of negative readings when traders lock in gains or reduce risk. Here, the premium behaves more like a barometer of short-term sentiment than a steady guide to long-term positioning. Market participants would need to be careful not to overinterpret every fluctuation.
There is also a more cautious scenario in which the recent positive streak fades, perhaps because macro data disappoints or regulatory developments introduce new uncertainty. In that case, the premium might drift back toward neutral or mildly negative territory, signalling that U.S. buyers have become more selective. Such an outcome would not automatically imply a severe downturn, but it would suggest that the burst of enthusiasm from late November was temporary rather than the start of a longer trend.
Using The Coinbase Premium In A Responsible Way
For individual and professional investors alike, the most practical way to use the Coinbase Premium Index is as a contextual tool rather than a trigger for all-or-nothing decisions. A sustained positive premium can support a thesis that U.S. demand is returning, especially when it aligns with other evidence such as ETF inflows and improving liquidity conditions. However, relying on it alone to make allocation choices would be unwise.
A more balanced approach is to treat the index as one layer in a structured research process. For example, an analyst might begin by forming a macro view, then look at on-chain metrics related to long-term holders, derivatives funding and realised volatility. The Coinbase premium can then be added as a lens on regional flows: is the U.S. side of the market reinforcing or contradicting the broader picture? Over time, tracking how the premium behaves across different phases of the cycle can also help investors build intuition about when U.S. demand tends to lead or lag global sentiment.
Above all, it is crucial to remember that no indicator eliminates risk. Bitcoin remains an asset class with significant price variability, and even well-researched positions can move sharply in either direction. Sound portfolio construction, clear time horizons and appropriate position sizing are still more important than any single dashboard widget.
Key Takeaways
The recent shift of the Coinbase Bitcoin Premium Index into sustained positive territory is an informative development. It suggests that, after weeks of discount pricing, U.S. buyers are once again willing to pay slightly more for spot Bitcoin on Coinbase than investors on major offshore venues. While the magnitude of the premium is modest, the persistence of green readings on the chart indicates a change in regional balance: American capital is no longer consistently on the back foot.
Whether this marks the beginning of a longer U.S.-led accumulation phase will depend on factors well beyond the scope of a single metric: interest rate expectations, regulatory clarity, ETF flows and global risk appetite. For now, the premium offers a data-driven way to track the return of U.S. participation in real time. Used thoughtfully and in combination with other tools, it can help observers move beyond narratives and ground their interpretation of market moves in observable evidence.
Disclaimer: This article is for educational and informational purposes only. It does not constitute investment, financial or legal advice, and it does not recommend any specific strategy, asset or service. Digital assets carry risks, including the potential loss of principal. Readers should conduct their own research, consider their financial situation and risk tolerance, and, if needed, consult qualified professionals before making financial decisions.


