Bitcoin’s Trader Realized Price Bands: Why Low Selling Pressure Opens Room for a Relief Rally
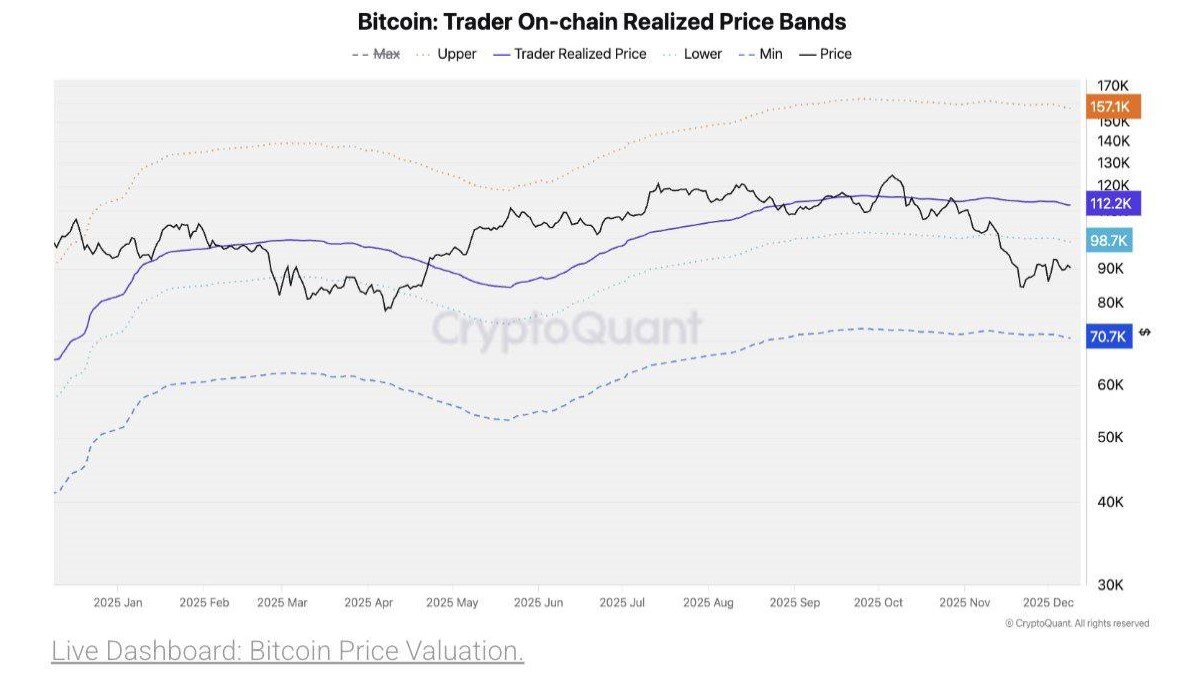
The recent consolidation in Bitcoin has left many market participants asking a simple question: is the downturn losing momentum, or is this just a pause before another leg lower? On the surface, price action looks indecisive. Underneath, however, on-chain data is sending a more nuanced message. One of the clearest lenses right now is the Trader On-chain Realized Price Bands published by CryptoQuant.
According to this framework, selling pressure from active market participants has eased significantly while spot price trades below the lower part of the trader realized band. That combination historically creates room for a relief move back into the band itself. In the current setup, this would imply potential upside toward the 99k USD area, with subsequent resistance zones around 102k USD and 112k USD.
This article unpacks what those levels actually represent, why the realized price structure matters more than a traditional static support or resistance line, and how investors can interpret the signals without turning them into mechanical buy or sell rules.
1. What is the trader realized price band?
Realized price is an on-chain metric that attempts to approximate the average cost basis of coins on the network. Instead of asking where traders think Bitcoin is worth, it asks at which price those coins last moved on-chain. When we filter this view for coins associated with more active entities – wallets that change hands frequently rather than dormant long-term holders – we obtain a picture of the cost basis of the short- to medium-term trading cohort.
CryptoQuant’s Trader Realized Price Bands extend this idea by creating a channel around that average cost basis:
- The central line is the trader realized price itself – currently clustered in the low 110k USD region on the chart.
- The lower band sits below, near the 99k USD area. It represents a threshold where, in earlier phases, traders had accumulated coins and where unrealized losses start to compress.
- The upper band and maximum band reside even higher (above 150k USD), defining regions where short-term cohorts have historically become heavily profitable and more inclined to take chips off the table.
By comparing the current market price with this structure, we get a dynamic view of where traders as a group are sitting in terms of profit and loss. When price trades comfortably above the central band, the average active participant is in profit and therefore has a financial incentive to lock in gains. When price falls below the lower band, the same group is, on average, under water. In that zone, marginal selling tends to dry up because those who wanted to exit have mostly done so, leaving a core that is more resilient and more willing to wait for better levels.
2. The current picture: low realized selling pressure
At the moment, Bitcoin price is fluctuating below the lower trader realized band while the on-chain measures of realized losses and spent coins from short-term holders have eased. In plain language, most of the forced selling from late entrants appears to have already occurred. Those still holding coins acquired near the top are sitting on paper losses but are not rushing for the exit at any price.
There are several reasons why this lower supply pressure matters:
• Inventory exhaustion: When a sharp downside move forces weak hands to close positions, the pool of marginal sellers shrinks. Once that group is exhausted, even modest levels of new demand can have an outsized effect on price.
• Improved risk–reward for remaining holders: For traders who bought around 110k–120k USD, the difference between selling at 90k and selling at 95k may not justify immediate action. Many prefer to wait for a larger bounce before re-evaluating, which reduces the aggressiveness of sell orders at current levels.
• Spot-flow stabilization: ETF creations, exchange balances and on-chain transfer volumes suggest that, while demand is not euphoric, it is also not collapsing. That combination – subdued demand but even more subdued supply – often precedes a sideways-to-up regime.
Taken together, the data aligns with CryptoQuant’s interpretation that selling pressure is relatively low, opening the door for a temporary recovery as price gravitates back toward the cost-basis region of active traders.
3. Why 99k, 102k and 112k matter
If supply pressure is reduced, the natural next question is: where could a relief move reasonably run into resistance? The realized price bands help translate that into a set of concrete zones.
3.1. The 99k zone: first encounter with the lower band
The first candidate is the 99k USD area, essentially the lower edge of the trader realized band. This zone is important for both technical and psychological reasons:
- It marks the point at which a significant portion of recent buyers transitions from large unrealized losses to more manageable drawdowns.
- Market participants who promised themselves they would “exit on the next bounce” frequently place orders around their entry cost or slightly below, turning this region into a dense cluster of resting supply.
- From a chart perspective, this area often coincides with previous consolidation ranges where price spent considerable time, meaning there is historical traded volume to contend with.
For these reasons, a move from current levels back toward 99k can be seen as a retest of broken support. Breaking and holding above it would signal that the market has enough underlying demand to absorb late sellers who were simply waiting to get closer to breakeven.
3.2. 102k and 112k: the deeper parts of the cost-basis cluster
Beyond 99k, the next notable areas sit around 102k USD and 112k USD:
• The 102k region lines up with short-term local highs formed during the previous distribution phase and with intermediate levels inside the lower realized band. Pushing through this zone would turn a tactical bounce into something more structurally meaningful.
• The 112k area roughly corresponds to the current trader realized price itself, the central line of the band. At that level, the average active trader would be near breakeven. Historically, this is where behaviour diverges: some market participants use the opportunity to reduce exposure, while others treat a successful reclaim of the realized line as confirmation that the uptrend is reasserting itself.
In other words, the path from the low 90k range to 112k is not a single monolithic wall of resistance. It is a sequence of psychological checkpoints where different groups of market participants reassess their positions. Each checkpoint cleared reduces the overhang of sidelined supply, but each also carries higher risk of short-term rejection as resting sell orders are triggered.
4. How realized price bands fit into the broader macro context
On-chain metrics do not exist in isolation. The realized bands are most useful when viewed alongside macro and policy developments that influence the overall demand for risk assets.
At present, the policy backdrop is in a transitional phase. The Federal Reserve has begun to lower interest rates, but at a cautious pace and with internal disagreement over how quickly to proceed. Markets are still digesting the idea that the path from restrictive policy to a more neutral setting may be uneven. That uncertainty tends to compress valuation multiples for growth assets while favouring instruments with steady income streams.
In such an environment, Bitcoin’s behaviour often reflects two competing forces:
- Structural adoption tailwinds: the spread of spot ETFs, increasing use of Bitcoin as collateral in institutional products and corporate treasury allocations provide a long-horizon demand base that does not react to every weekly candle.
- Cyclical liquidity headwinds: when real yields are elevated or policy communication is unclear, marginal capital becomes more selective. This cap on new inflows can slow down recovery even when on-chain supply dynamics look favourable.
The trader realized bands sit at the intersection of these forces. They tell us where active market participants are positioned right now, but not whether macro conditions will provide enough incremental demand to overpower resistance zones on the first attempt. In practice, relief rallies toward 99k–112k can coexist with a slower, more choppy medium-term environment as the macro picture evolves.
5. Reading the signal without turning it into a rule
Because realized price bands are visually clean and easy to overlay on charts, there is a temptation to treat them as a mechanical trading rule: buy whenever price touches the lower band and expect it to travel to the upper band. A more balanced, education-focused view would use them as one component of a wider framework.
Some principles that long-term investors can consider:
• Use bands as context, not triggers. The fact that price is below the trader realized band tells us selling pressure has likely compressed, not that a specific price path is guaranteed. It is a backdrop for scenario analysis rather than a stand-alone signal.
• Combine on-chain with liquidity and positioning data. ETF flows, futures open interest and funding conditions provide additional clues about where short-term leverage sits. When on-chain metrics and derivatives positioning point in the same direction, the case for a relief move is stronger.
• Be mindful of time horizon. Realized price bands help frame multi-week to multi-month dynamics, not intraday swings. A test of 99k can be part of a broader sideways range that lasts months before a clear directional break emerges.
• Account for structural regime shifts. As institutional participation grows, some historical patterns around realized price may weaken or change in timing. Past behaviour is informative but not deterministic.
Approached in this way, the current setup can be summarised as follows: supply from short-term holders has eased, spot price sits below their average cost basis, and the 99k–112k corridor represents the main region where those same holders will decide whether to exit or recommit. That is analytically useful, even if it does not translate into a simple formula.
6. Possible paths from here
With those caveats in mind, it is helpful to map out a few broad scenarios anchored on the realized bands:
Scenario A: Classic relief rally into the band
In this path, diminishing sell pressure and modest new demand push Bitcoin gradually from the low 90k range toward the 99k lower band. Initial resistance triggers some supply, but flows from participants who view the move as confirmation of resilience help absorb it. Price then grinds through to 102k and potentially tests the 112k trader realized line over several weeks.
Such a move would not automatically imply a full return to the previous all-time high, but it would indicate that the market has transitioned from forced selling to a more balanced state, setting the stage for whichever macro narrative dominates in 2026.
Scenario B: Sideways consolidation below resistance
Here, the market attempts to rally but repeatedly stalls in the 99k region as sellers who have waited for better levels use each approach to reduce exposure. In this case, realized bands still function correctly – they highlight the region where overhang is concentrated – but the process of clearing that overhang takes longer than many would like.
Price action under this scenario can feel frustrating, yet it often lays the foundation for more sustainable advances later. The more times the market tests and absorbs supply near 99k–102k without revisiting the lows, the stronger the eventual breakout tends to be.
Scenario C: Failed bounce and deeper reset
A less favourable outcome would see macro conditions deteriorate (for example, if growth data weakens faster than expected while policy remains cautious) and demand for risk assets shrinks further. In that context, even reduced supply might not be enough to support a rally. Bitcoin could then fail to reach the lower band in a meaningful way and instead revisit the lower bounds of the broader cycle structure.
While this scenario is always possible, current evidence from realized losses, ETF flows and macro policy guidance suggests that outright stress conditions are not the base case. Still, when constructing a risk framework, it is important to acknowledge that realized bands can support a rally but do not eliminate downside risk.
7. Key takeaways for long-term observers
For readers tracking Bitcoin through an educational lens rather than as short-term traders, the latest configuration of the trader realized price bands offers several lessons:
• On-chain data can reveal how different cohorts of market participants are positioned in terms of profit and loss, providing insight that price charts alone cannot offer.
• Periods when spot price trades below the lower trader realized band typically correspond to phases when a large portion of active buyers is under water, and selling pressure has already done most of its work.
• In such phases, the market often develops a relief rally back toward the band, but the journey is rarely linear. Zones like 99k, 102k and 112k should be viewed as layers of supply where behaviour may diverge.
• Macro conditions, liquidity and institutional flows can accelerate or delay the process. Realized price bands highlight where key decisions are likely to occur; they do not determine the outcome on their own.
In summary, CryptoQuant’s trader realized price structure currently points to a market that has already endured a substantial clearing of weak hands and now has room for a temporary recovery into the 99k–112k corridor, provided macro conditions remain broadly supportive. For long-term observers, the most important task is not to guess the exact path of the next few candles, but to understand how these structural levels shape the incentives of participants and define the battleground for the next decisive move.