Short-Term Holders Underwater: What a 101K Realized Price Says About Bitcoin’s Cycle
On-chain data is sending a very clear message: recent Bitcoin buyers are in pain.
The realized price of short-term holders (STH) – effectively their average cost basis – has climbed to roughly 101.2K USD, while the market price hovers well below that level. In other words, this cohort as a whole is sitting on large unrealized losses.
At the same time, on-chain metrics estimate that more than 6 million BTC are currently below their purchase price. A big part of that pool belongs to STH, the investors who entered during the later stages of the rally and are statistically more likely to react quickly when price moves against them.
That combination – heavy losses for recent buyers and a large inventory of coins in the red – tells us a lot about where we are in the cycle, how fragile sentiment is, and where the key pressure points lie for the months ahead.
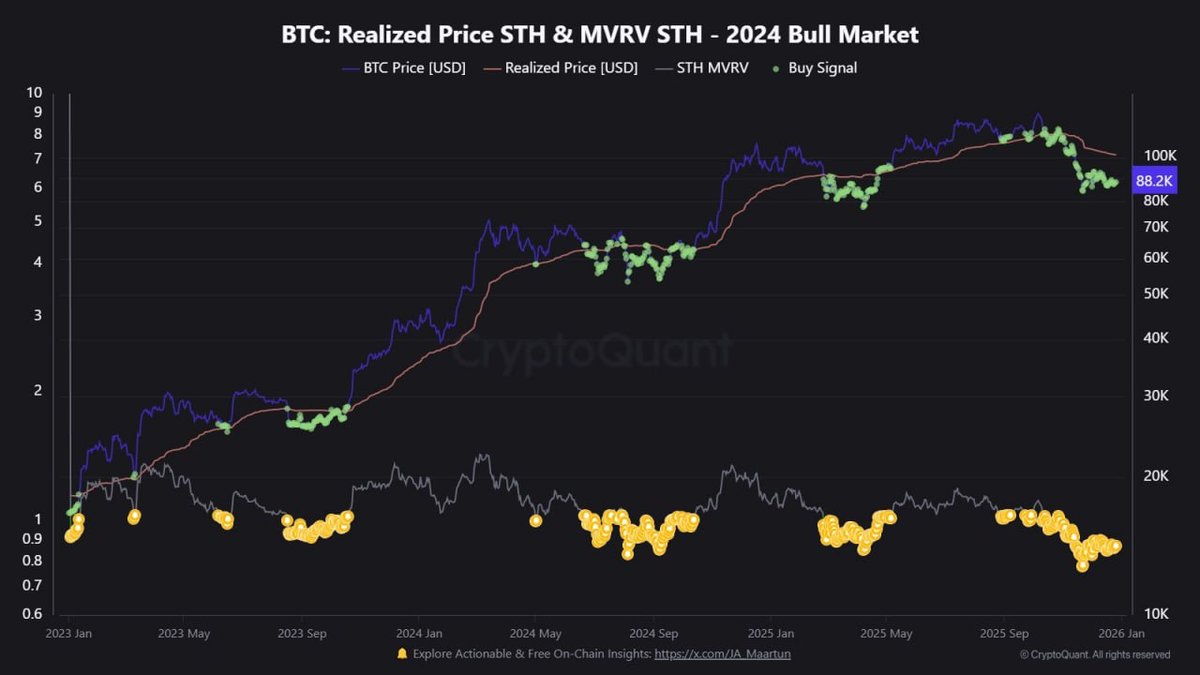
1. How the STH realized price became a new battleground
The chart you are looking at plots three key series for the 2023–2025 bull market:
- BTC price (blue line), showing the spot market path.
- STH realized price (red line), representing the average on-chain cost basis of coins held by addresses that have held for a relatively short window (often 155 days or less).
- STH MVRV (lower panel), the ratio between price and STH realized price. A value above 1 means STH are in profit on average; below 1 means they are in aggregate loss.
During much of the 2024 bull run, the pattern was textbook:
- Price would dip toward the STH realized price, briefly push STH close to breakeven, and then bounce higher as demand absorbed supply.
- The lower panel showed STH MVRV oscillating around 1, with yellow markers highlighting zones where STH were close to neutral or slightly underwater. Historically, these have often been attractive risk-reward areas in an ongoing uptrend.
What has changed is that the red line has marched up faster than the blue one. As late-cycle buyers paid higher and higher prices, the STH cost basis climbed into six-figure territory. Once the market failed to sustain those peaks and pulled back, the entire cohort flipped from healthy profit to heavy loss.
Today, with the STH realized price around 101.2K USD and spot trading noticeably lower, STH MVRV has dropped well below 1. That is a clear sign that the marginal buyer of the last leg is underwater.
2. Why short-term holder pain matters more than long-term holder pain
Not all unrealized losses are equal. When coins held by long-term holders (LTH) dip below cost basis, history shows that many of them simply wait; their decision to hold through previous drawdowns proves they can tolerate volatility.
Short-term holders are different:
- They tend to buy closer to local highs, often driven by narratives, momentum, or fear of missing out.
- They are more likely to use leverage or borrow stablecoins against their holdings, because they entered during phases of optimism when such strategies seemed attractive.
- They have less emotional attachment to the asset and a shorter track record of surviving large drawdowns.
This means that the current configuration – STH deeply underwater, LTH still largely in profit – creates a two-layer market structure:
- An upper layer of reactive supply (STH) that may be quick to sell if prices fall further or fail to recover within their time horizon.
- A lower layer of patient supply (LTH) that, for now, still sees the drawdown as tolerable.
The risk is that if price remains below the STH cost basis for too long, more of these short-term holders will either lock in losses voluntarily or be forced to reduce positions because of loan covenants or margin requirements. That can turn unrealized losses into realized selling pressure.
3. The hidden link: unrealized losses and loan markets
On-chain data suggests that a meaningful share of Bitcoin supply is now tied into lending agreements, whether through centralized institutions, on-chain credit platforms, or structured products. In many of these arrangements, Bitcoin is posted as collateral to borrow stablecoins or other assets.
When price is far above the collateral entry level, risk appears low. As long as the collateral value comfortably exceeds loan balances, lenders feel secure and borrowers feel confident using the borrowed funds for other purposes.
However, when a large portion of coins move into loss, especially around psychologically important areas such as the 100K region, three things can happen at once:
- Loan-to-value ratios rise. As the value of collateral falls while loan principal stays the same, positions move closer to their risk thresholds.
- Volatility becomes more dangerous. A relatively small additional drop can push leveraged investors into margin call territory, forcing them to either add collateral or reduce exposure.
- Sentiment deteriorates. Borrowers who expected quick gains may become uncomfortable carrying debt against an asset that is not behaving as planned.
That is why the combination of a 101.2K USD STH realized price and millions of BTC in loss is more than just a psychological statistic. It hints at potential forced selling if conditions deteriorate further, especially among the later entrants who financed their positions.
Importantly, this does not mean a cascade is guaranteed. Many loans have conservative buffers, and lenders have improved risk practices compared with earlier cycles. But it does mean that the market is more sensitive to additional shocks than it appears if you only look at spot price.
4. The 100K zone as a psychological and structural pivot
The focus on the 100K USD region is not arbitrary. It is significant for at least three reasons:
4.1 A round number with narrative weight
Round numbers shape expectations. Crossing into six-figure territory turned Bitcoin into headlines again, pulled in new participants, and reinforced long-standing narratives about its potential as a macro asset. When price then drops back below that level, those same narratives can flip into disappointment.
4.2 A rough proxy for the STH cost basis
With the average STH entry clustered around 101.2K USD, the 100K area acts as a breakeven line for a large share of recent buyers. Every time price approaches this zone from below, some investors will see an opportunity to exit flat rather than continue to endure paper losses. That can create overhead supply and slow down recoveries.
4.3 A reference point for lenders and risk teams
Institutions that lend against BTC collateral often use clearly defined thresholds to manage risk. While they do not all key off the same number, round figures like 100K tend to feature in stress tests and scenario planning. If the market spends a long time below such levels, it can trigger internal reviews of risk limits, reducing the willingness to extend fresh credit.
Taken together, this means that how Bitcoin behaves around the 100K band will likely influence not only spot participants but also the willingness of credit providers to support leveraged activity in the next phase of the cycle.
5. What history says about STH capitulation zones
Past cycles offer useful context for the current configuration of losses.
- When STH MVRV falls deeply below 1 during bear markets, it has often coincided with late-stage capitulation, where recent buyers finally give up and transfer coins to stronger hands.
- During ongoing bull markets, brief dips of STH MVRV below 1 have sometimes marked attractive re-accumulation windows, especially when long-term holders remain firmly in profit and continue to hold.
The current situation is unusual because it combines elements of both:
- Price is still relatively high compared with previous years, so by absolute levels it looks like a bull-market consolidation.
- Yet the depth of STH losses resembles what we usually see in more severe corrections.
This hybrid pattern suggests that the market is in a fragile equilibrium. If macro conditions ease and credit remains available, STH may gradually be absorbed by new demand, turning this phase into a prolonged consolidation before another attempt higher. If, however, macro data or policy surprises lead to tighter financial conditions, the same large pool of underwater STH could become the source of an extended drawdown.
In other words, on-chain data shows us that the fuel for both outcomes already exists; what we do not know yet is which spark will dominate.
6. Risk management when the reactive cohort is hurting
For individual investors, the key takeaway is not to predict the exact path of price but to adjust risk management to the current structure of the market. A few principles stand out.
6.1 Respect how sensitive the market is
When more than 6 million BTC are in unrealized loss and STH are collectively underwater, the market is naturally more emotional. Headlines, policy announcements, or unexpected moves in traditional markets can trigger outsized reactions, because many participants are sitting on losses and looking for reasons either to hold on or to cut exposure.
In such an environment, it is crucial to avoid overconfidence. Position sizes that felt comfortable during the earlier, smoother stages of the bull market may now be too aggressive.
6.2 Have clear exit rules instead of vague intentions
One practical response to a more fragile market is to define in advance where you will reduce risk if conditions deteriorate. That can involve traditional stop-loss levels, time-based rules (for example, reducing exposure if price stays below a threshold for a set period), or portfolio-level limits on how much drawdown you are willing to tolerate.
The important part is not the exact formula but the existence of a plan. Without one, it is easy to react emotionally to volatility, especially when you are watching an asset hover below your own cost basis.
6.3 Be cautious with leverage
The current on-chain configuration already implies that a significant number of participants may be carrying debt against their holdings. Adding more leverage on top of that environment increases vulnerability.
Leverage can magnify gains during clear trends, but when the main cohort of recent buyers is deeply in the red and facing possible margin pressure, the risk of abrupt moves grows. For many investors, especially those without professional risk systems, it can be healthier to focus on unleveraged exposure or very modest leverage rather than aggressive structures.
6.4 Reframe time horizons
Finally, understanding that STH are in pain can help long-term participants reframe expectations. If your thesis spans multiple years, the fact that recent entrants are struggling is not automatically negative. In previous cycles, coins sold by short-term holders at a loss were often accumulated by patient buyers who later benefited from the next leg up.
The key is aligning your investment horizon with your behavior. Long-term theses require the ability to tolerate phases where on-chain metrics look uncomfortable in the short run.
7. Conclusion: A cycle defined by macro and behavior, not just supply
The picture painted by the STH realized price and MVRV metrics is clear: recent buyers are bearing the brunt of the current drawdown, with an average cost basis near 101.2K USD and spot trading below that level. Over 6 million BTC are sitting at an unrealized loss, concentrated in a cohort that is both emotionally and structurally more likely to react.
This does not automatically spell disaster, nor does it guarantee a near-term bottom. Instead, it tells us that the market is highly sensitive to both macro developments and internal leverage dynamics. The 100K region has become a pivot point where psychology, loan risk management, and on-chain cost structures intersect.
For investors, the most constructive response is not to try to guess the next headline but to adapt positioning: acknowledge the fragility indicated by on-chain data, define clear risk boundaries, be cautious with leverage, and ensure that any exposure matches your true time horizon.
On-chain metrics like STH realized price and MVRV do not predict the future on their own, but they reveal how much stress is already embedded in the system. Right now, that stress is elevated. Navigating this phase successfully is less about finding a perfect entry and more about surviving the volatility with discipline intact, so that you are still in the game when the next, less crowded phase of the cycle arrives.
Disclaimer: This article is for educational and analytical purposes only. It does not constitute investment advice, trading guidance, or a recommendation to buy or sell any asset. Digital assets are volatile and may not be suitable for all investors. Always conduct your own research and consider consulting a qualified professional before making financial decisions.