Developer Activity Isn’t a Price Chart: Reading Ethereum’s 30-Day “Builders Leaderboard” Without Getting Trapped by Narratives
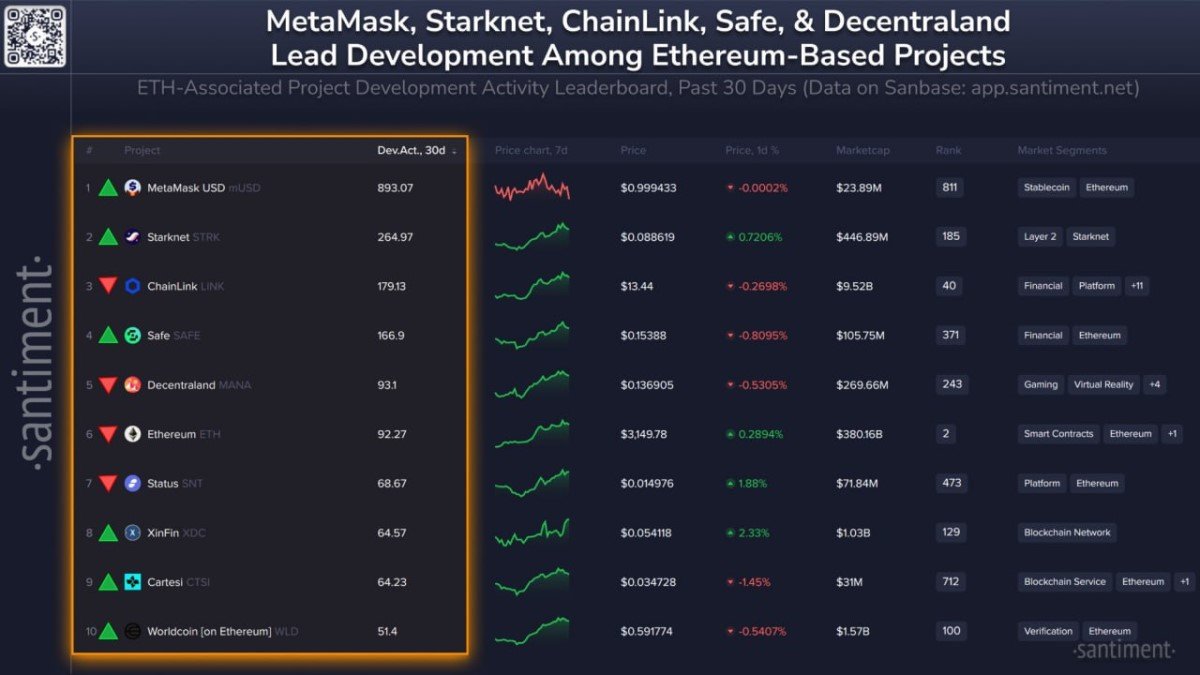
Santiment’s 30-day developer activity leaderboard is the kind of chart crypto loves: clean ranking, a tidy list of familiar names, and an implied moral—“the teams are still building, therefore the future is bright.” The screenshot you shared reinforces that intuition. Wallet infrastructure, a major L2, core Ethereum, and long-standing primitives like oracles all appear near the top. In other words: the machine room is loud.
But the most expensive mistake in crypto is confusing engineering momentum with market consensus. Developer activity is a signal about effort and iteration speed. Price is a signal about marginal buyers and sellers—liquidity, risk appetite, and token design. Sometimes these line up. Often they don’t. This article is about holding both truths at the same time, without slipping into either cynicism (“dev doesn’t matter”) or naïve optimism (“dev guarantees upside”).
1) What “dev activity” measures—and why it’s easy to misread
Dev activity (as commonly reported in crypto dashboards) is usually derived from public repository behavior: commits, pull requests, issue activity, releases, and related code events. This is useful because it’s hard to fake consistently over long periods. A project that stops shipping tends to leave fingerprints: fewer updates, fewer merges, fewer releases. In that sense, dev activity is like checking whether the lights are on in a factory.
The trap is thinking the factory’s noise tells you what the product will earn. A team can be extremely active while the market reprices its token lower—because the token is not an equity claim on that productivity. In crypto, “more building” doesn’t automatically mean “more value captured by the token,” especially when (1) fees accrue elsewhere, (2) supply expands faster than demand, or (3) competition compresses margins the way it does in any real industry.
2) The leaderboard’s real message: Ethereum is shifting from hype cycles to infrastructure cycles
If you zoom out, the top names in the chart tell a deeper story than “bullish” vs “bearish.” They represent infrastructure layers—wallets, L2 scaling, security tooling, and settlement networks. That’s a sign of maturation. When markets are young, attention clusters around new narratives. When markets age, attention slowly migrates to plumbing: custody, safety, compliance-friendly rails, scaling efficiency, and UX.
In the list shown, you can roughly group the projects by what they’re trying to become:
- Wallet & distribution layer: MetaMask-related tooling suggests user access and embedded finance are priorities, not just speculative trading.
- Scaling layer: Starknet (STRK) is a bet on rollup-centric throughput and cheaper execution.
- Credibility layer: Chainlink (LINK) signals continuous work on data integrity, cross-chain messaging, and the “reality bridge.”
- Safety & coordination layer: Safe (SAFE) reflects institutional-grade custody and treasury workflows.
- Legacy application layer: Decentraland (MANA) and others show that consumer apps still iterate—even if they’re not the headline narrative this week.
Read this way, the leaderboard is less about “what will pump” and more about “what the ecosystem is investing engineering attention into.” That’s a quieter, more useful insight.
3) The Starknet (STRK) paradox: strong building, painful pricing
Your note about STRK is the emotional core of this topic: a name most people know, heavily repriced—“down over 40x from the top”—yet still large enough that its market cap remains around the half-billion range in the narrative you shared. This is what crypto’s middle age looks like: not dead, not euphoric, just forced to live under the rules of capital markets.
Here is the paradox in plain terms. A scaling network can be shipping aggressively—improving provers, developer tooling, bridges, account abstraction, and UX—while the token experiences persistent sell pressure. That sell pressure can come from many places: early allocations gradually exiting, market makers managing risk, or simply a mismatch between token supply schedules and real demand for the asset.
The upcoming unlock you mentioned—an additional ~127M STRK in roughly 8 days—illustrates why dev activity and price often diverge. Unlocks are not “bad” by default. They are a liquidity event. They increase circulating supply. That changes the market’s job description: price must either find new buyers or accept lower levels until demand catches up. Even if the project is executing perfectly, the token still has to clear that supply.
Seed round optics: why “down 40x” can still mean early investors are up
You also highlighted a detail that most headlines avoid because it’s awkward: “even after such a drawdown, seed round is still ~4x the current price.” This matters because it explains why unlocks can feel relentless. If early holders are still meaningfully profitable, they may be rational sellers into strength—or even sellers into weakness to reduce exposure—regardless of Twitter sentiment about “building.”
This isn’t a moral argument. It’s mechanics. Tokens are not stocks. Early allocations are often priced at a different universe of valuation assumptions. When those allocations unlock, the market has to digest them. That’s why the most honest way to analyze STRK around unlock windows is not to ask “are they building?” but to ask “what is the marginal flow likely to be, and where does it meet real demand?”
4) A better mental model: dev activity is a “survival signal,” tokenomics is a “distribution signal”
If you want one framework that keeps you sane, use this: dev activity answers: will the product keep improving? Tokenomics answers: who gets to own the upside (if it exists), and when? Both matter. Mixing them into a single bullish conclusion is where people lose objectivity.
For STRK specifically, the most constructive interpretation of high dev activity is that the network is fighting for relevance in a brutally competitive L2 arena. The most realistic interpretation of unlock risk is that the token is still in its “distribution era,” where ownership is being reallocated from early stakeholders to the broader market. Distribution eras can last a long time. They can also end suddenly if demand accelerates. But you should analyze them as a phase, not a glitch.
5) How to use the leaderboard without turning it into a superstition
Here’s how experienced analysts tend to treat charts like this: as a shortlist generator, not a buy list. High dev activity tells you where teams are investing talent and time. That’s a hint about where future features, integrations, and product polish may emerge. It is not an instruction to ignore supply schedules, liquidity conditions, and user growth.
If you want to extract real value from the leaderboard, ask three questions for each project:
- What is the product loop? Does usage naturally create recurring demand (fees, collateral needs, staking security, or operational necessity), or is demand mostly narrative-driven?
- Where does value accrue? To the token, to off-chain businesses, to validators, or to a broader ecosystem that dilutes individual token capture?
- What is the supply path over the next 6–12 months? Unlocks, emissions, incentives, and treasury programs often matter more for price than another GitHub sprint.
Answering those three questions forces the analysis to become structural—not emotional. And structural thinking is what separates “news” from “market understanding.”
Conclusion
Santiment’s 30-day dev leaderboard is a useful snapshot: Ethereum-adjacent teams are still shipping, and the ecosystem’s center of gravity is clearly leaning toward infrastructure and scalable execution. That’s a healthy sign for the long-term resilience of the stack.
But the Starknet example is the reminder the market keeps teaching: shipping is necessary, not sufficient. Tokens trade on liquidity, distribution, and value capture. A project can be in a golden age of engineering while its token is in a difficult phase of ownership transfer. If you can hold that contradiction without forcing a simple narrative, you’re already ahead of most timelines.
Frequently Asked Questions
Does high dev activity mean a token is undervalued?
Not necessarily. It suggests the team is actively improving the product, but valuation depends on adoption, value capture, supply dynamics, and broader market liquidity.
Why can a token fall even while the project is building?
Because token prices are heavily influenced by flows (unlock schedules, emissions, hedging), and because the token may not directly capture the economic value created by development.
Are token unlocks always bearish?
No. Unlocks are supply events. They can be absorbed if demand is strong or if markets are positioned for it. But they can also pressure price if liquidity is thin or if holders decide to sell.
Disclaimer: This article is for informational and educational purposes only and does not constitute financial, investment, legal, or tax advice. Cryptoassets are volatile and involve risk. Past performance and historical patterns are not guarantees of future results.