The 2025 Token Issuance Graveyard: What A 70–99 Percent Drawdown Really Tells Us
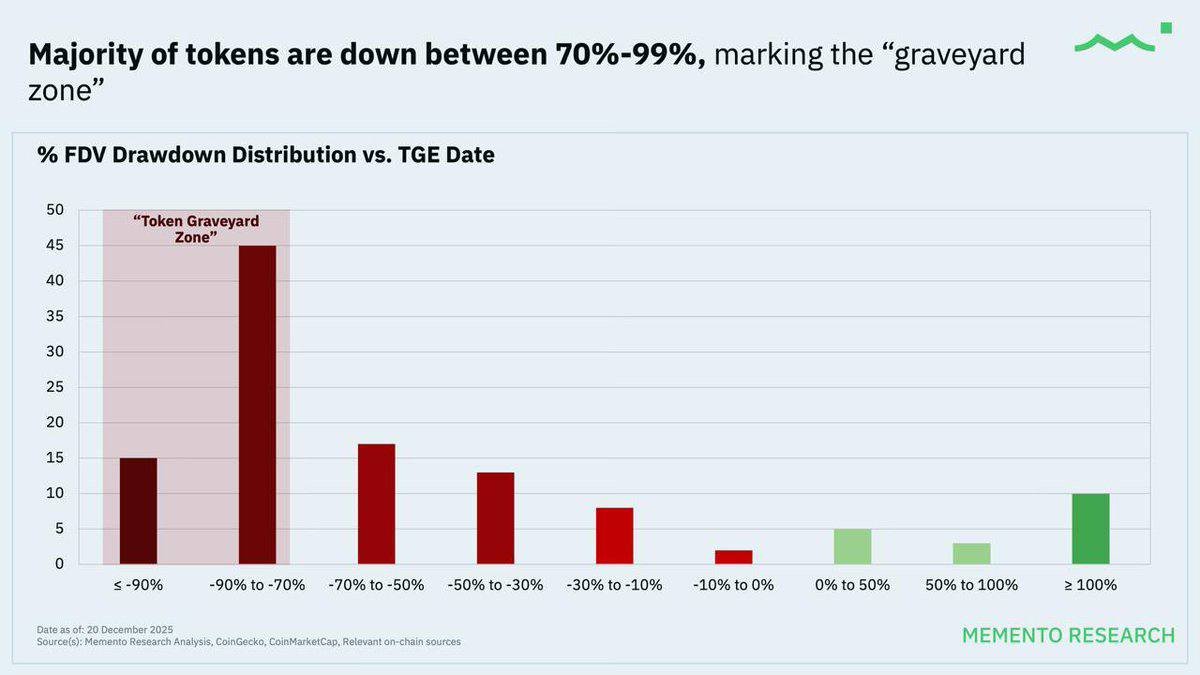
Every cycle has its own brutal chart. For 2025, it may well be the distribution of token performance since listing: a tall block of dark red bars showing that the majority of new tokens are down between 70 and 99 percent from their fully diluted valuation (FDV) at token generation event. Researchers have started calling this band the token graveyard zone, and unfortunately a large part of this year's cohort is already buried there.
According to data compiled by Memento Research and several market data providers, roughly 84.7 percent of tokens launched in 2025 now trade below their initial FDV. The most striking detail is that every single token that debuted with an FDV above 1 billion USD currently shows a negative return relative to its launch valuation. Nine out of ten large launches have not simply underperformed; they have re-priced sharply lower as soon as the market had a chance to vote with real liquidity.
This article looks beyond the headline number and tries to answer three questions:
- What exactly happened in the 2025 token primary market?
- Why did so many ambitious projects fall into the 70–99 percent drawdown band?
- What practical lessons can investors and builders take into the next issuance cycle?
Reading the Graveyard Chart Properly
The chart behind the report groups tokens by the drawdown of their FDV since listing. On the left side, shaded in red, lies the graveyard zone: launches that are now down between 70 and 99 percent relative to their starting FDV. Two bars dominate this region:
- A first group with losses worse than 90 percent.
- An even larger group with losses between 70 and 90 percent.
Together, these categories already comprise the majority of 2025 launches. Moving to the right, the bars gradually shrink: fewer projects are down 30–50 percent, fewer still sit close to breakeven, and only a small fraction trade above their initial valuation. The group that has doubled or more since TGE is visible but modest, emphasising how rare sustained outperformance has been in this environment.
The message is not that every token is doomed. There are clear survivors, and a handful of outliers have delivered impressive gains. But the distribution is heavily skewed. For anyone approaching token launches as if the average outcome is attractive, this chart is a cold reminder that the median project has not created value for secondary market buyers so far.
When Big FDV Meets Thin Liquidity
The most dramatic statistic in the research set is that 100 percent of tokens that listed with an FDV above 1 billion USD are now below their launch valuation. That does not mean the underlying ideas were all poor or that the teams have not shipped products. It says something subtler: the initial valuation embedded expectations that were extremely hard to meet once organic trading replaced carefully curated private rounds.
Several structural elements came together to create this outcome:
• Low circulating supply at launch. Many tokens entered the market with 5–10 percent of total supply circulating and the rest locked in vesting contracts. FDV was calculated on the full supply, not the float that could actually be traded.
• High headline valuations. In a competitive fund-raising environment, projects and investors often anchored on large numbers that signalled ambition. A 1–3 billion USD FDV for an early infrastructure or application project became almost normal for high-profile launches, even when on-chain usage was still modest.
• A shrinking secondary market risk appetite. By 2025, macro conditions had cooled, liquidity rotated toward larger assets, and market participants had already experienced previous cycles of dilution. The audience willing to support lofty FDVs with real capital was smaller than in earlier boom years.
When a token with a tiny float, aggressive valuation and heavy future unlock schedule meets a cautious market, the path of least resistance is downward. Each unlock event adds potential new sellers, while new buyers demand a growing discount to compensate for upcoming supply. The result is a slow but persistent slide into the graveyard band.
Infrastructure Dominance, Infrastructure Pain
The report highlights that infrastructure tokens made up the largest category in the 2025 issuance wave, yet they also recorded some of the deepest drawdowns. On paper, that might seem surprising. Infrastructure is supposed to be the most durable part of the stack: base chains, data layers, middleware, indexers, execution environments and so on.
The challenge is that many of these projects launched before their revenue models and long-term demand were clearly demonstrated. Competing infrastructure platforms often targeted similar segments with overlapping features. In some cases, the runway to meaningful self-sustaining fee generation may be years rather than quarters. The token, however, started trading immediately.
This created a mismatch between the business timeline and the market timeline. Tokens priced as if they were already mature networks suddenly had to justify those valuations while still searching for product–market fit. As traffic, fee revenue and developer traction evolved more slowly than expected, prices adjusted downward.
That does not mean that infrastructure is a poor theme. It does suggest that investors need to separate the narrative appeal of owning the 'picks and shovels' from the hard reality of how long it takes for infrastructure revenue to stabilise. A chain that expects meaningful economic activity in three to five years may be better suited to private capital that understands the timeline than to a liquid token trading at a mature FDV from day one.
The Perp DEX Mirage
Another interesting nuance in the data is the behaviour of perpetual futures exchanges. At a high level, this vertical appears to have delivered some of the best average performance among 2025 launches. However, once the outliers are removed, the picture becomes more modest.
A few highly successful platforms captured significant volume and became blue-chip names almost overnight. Their tokens pulled up the average for the entire category. But the majority of smaller derivatives platforms still struggled with the same dynamics as other segments: thin liquidity, heavy incentives spending, and intense competition for traders and market makers.
This is a classic example of why averages can be misleading. Looking only at category-wide returns might suggest that launching a derivatives platform is a reliable path to token success. Drilling into the distribution shows that most tokens in this niche remained under pressure while a select few captured the lion’s share of attention and fees.
Why The Graveyard Zone Is So Crowded
Beyond individual categories, there are broader forces that pushed so many tokens into 70–99 percent drawdown territory.
1. Over-reliance on emissions and incentive campaigns
Many teams leaned heavily on liquidity programmes, airdrops and trading incentives to bootstrap volume. These tools can attract activity, but they rarely build durable loyalty if the underlying product does not solve a real problem. Once incentives are dialled down, users move on, leaving a high-FDV token with little organic demand.
2. Vesting cliffs and complex unlock schedules
Large token supplies reserved for teams, advisers and early backers typically unlock over several years. When unlocks coincide with weak market sentiment, they can act as constant headwinds. Even if insiders are patient, the market often prices in the possibility of selling, which keeps valuations suppressed.
3. Fragmentation of liquidity
The number of chains, bridges and exchanges has grown rapidly. For new tokens, this often means fragmented order books, inconsistent pricing and higher volatility. Depth may look respectable on one venue but be thin elsewhere, making it hard for larger participants to build positions without moving the market.
4. Narrative fatigue
After several cycles of ambitious roadmaps and token designs, investors have become more sceptical. Buzzwords alone no longer justify valuations. Segments that were fashionable in previous years – from infrastructure layers to social applications – now face a market that demands evidence of usage and fee generation, not just promises.
What This Means For Investors
The 2025 issuance report is not simply a warning sign; it is also a map of where risk tends to concentrate. A few practical lessons stand out.
1. Treat FDV as a working hypothesis, not a fact
FDV is often displayed as if it were an objective measure of value, but in reality it is an assumption about what the project could be worth once all tokens unlock. When the underlying business is still in its early stages, a high FDV essentially asks buyers to pay today for tomorrow’s success. The graveyard chart shows how often that trade-off has failed in 2025.
Instead of anchoring on FDV alone, investors can ask:
- What would this valuation imply for revenue or fee levels in three to five years?
- Is there a clear path from today’s user base to those numbers?
- How does the FDV compare with similar projects that already have proven usage?
2. Look through to circulating supply and unlock pressure
A token launching with a 10 percent float and a 2 billion USD FDV is effectively asking new buyers to support a 200 million USD circulating valuation under the shadow of future unlocks. If emission schedules show large tranches entering the market every quarter, the price must absorb not just current selling but also expected future supply.
Analysing vesting schedules, team lock-ups and treasury management policies is no longer an optional extra; it is central to understanding risk.
3. Focus on demonstrated demand, not just design
Token design has become more sophisticated, with advanced mechanisms for staking, fee sharing and governance. But clever design cannot replace product–market fit. Before committing significant capital, it can be useful to ask simple questions: Are users returning without incentives? Are developers building on top? Is there meaningful fee generation that would still exist if rewards were reduced?
4. Size positions with the expectation of high volatility
Even well-designed projects can experience sharp drawdowns in their early life as markets discover a fair trading range. Rather than trying to perfectly time bottoms and tops, many long-term participants treat new tokens as high-risk exposures, using smaller position sizes and staged entries. In a world where 70–90 percent drawdowns are common, risk management matters at least as much as selection.
Implications For Builders
The graveyard distribution is not just a critique of investor behaviour; it is feedback for founders and protocol teams as well.
• Moderate initial valuations: Launching with a more modest FDV can create room for upside as the project proves itself, rather than forcing the market to cut valuations later.
• Align token economics with real usage: Instead of front-loading emissions, teams can design rewards that closely track genuine activity, reducing the gap between early speculative demand and long-term utility.
• Communicate clearly about unlocks and treasury plans: Transparent, predictable schedules help build trust. Sudden changes to vesting or undisclosed treasury sales erode confidence quickly.
• Consider whether a token is necessary at all: In some cases, the best way to avoid graveyard status is to delay issuance until there is enough real demand to support it, or to build products that do not require a native token in the first place.
Is There Opportunity Hidden Inside The Graveyard?
Historically, crypto markets have often delivered their best long-term opportunities during periods of pessimism. A high percentage of tokens trading 70–90 percent below their launch FDV does not guarantee value, but it does create a hunting ground for investors willing to distinguish between projects that were simply overvalued and those that are fundamentally flawed.
Some tokens in the graveyard zone belong to teams that continue to ship, maintain healthy treasuries and grow user bases quietly. Others have seen development stall or community interest fade. The distribution chart cannot tell these stories on its own; it only provides a starting point. Detailed research is needed to separate temporary mispricing from structural decline.
Conclusion: A Tough Year With Useful Lessons
The 2025 token issuance report is sobering. More than four out of five new tokens are below their initial FDV, and the majority sit in a 70–99 percent drawdown band. Large headline valuations, thin floats, heavy unlock schedules and a more selective market have combined to make this one of the most difficult environments for new token performance in recent memory.
Yet the picture is not entirely bleak. The data also show a small but meaningful group of projects that have managed to grow above their launch valuations, typically by pairing disciplined token economics with clear product value. These exceptions provide a roadmap for how future launches can be structured more sustainably.
For investors, the message is clear: do not treat token launches as a lottery where the average ticket pays off. Approach FDV, supply schedules and narrative promises with healthy scepticism, and assume that volatility and drawdowns are part of the journey. For builders, the graveyard chart is an invitation to rethink how and when tokens should be issued, and how to align long-term community ownership with the realities of product development.
If the lessons of 2025 are absorbed, the next issuance cycle does not have to repeat the same pattern. Tokens can still be powerful coordination tools. But in a market that now understands just how crowded the graveyard can become, the bar for sustainable design and realistic valuation has been raised.
Disclaimer: This article is for educational purposes only and should not be interpreted as financial, investment or tax advice. Digital assets are volatile and may not be suitable for all investors. Always conduct your own research and consider speaking with a qualified professional before making financial decisions.