
Reading the Signal Behind the Viral Chart
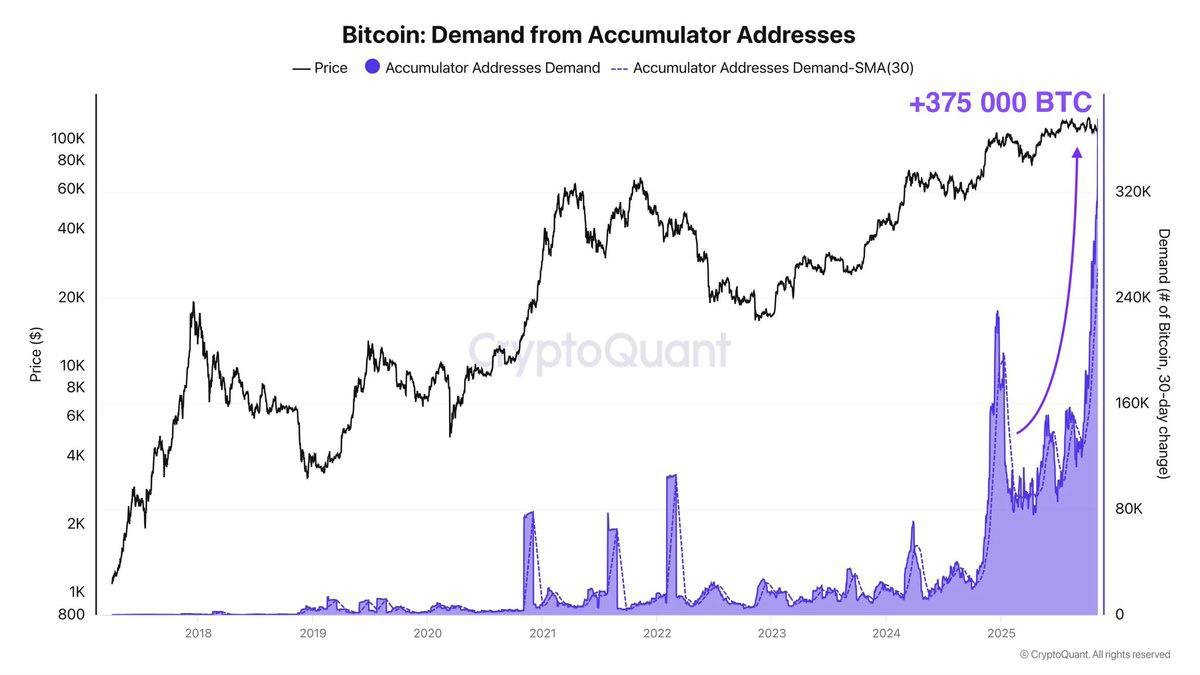
The attached CryptoQuant visualization plots Bitcoin’s price against an estimate of net demand from so-called accumulator addresses. The key message is blunt: wallets that historically only receive bitcoin—and have never spent—are currently hoovering up supply at a pace without precedent in the time series. A 30-day net change near 375,000 BTC, with a single-day print above 50,000 BTC, is not the footprint of casual dip buyers; it is the signature of pipelines capable of moving institutional-scale inventory into cold storage.
What makes the surge striking is its backdrop. Broader ‘headline demand’—as proxied by exchange volumes, retail search interest, and casual wallet activity—has softened in recent weeks. Yet this cohort is accelerating: the rolling monthly average has more than doubled, from roughly 130k to 262k BTC, in under two months. When aggregate participation cools while a narrow group accumulates faster, the market often feels contradictory: prices can chop or even fall while the long-term float quietly tightens.
How the Metric Works—and Where It Can Mislead
Before we extrapolate big conclusions, we should understand the construction. An accumulator address is tagged heuristically as a wallet that:
- has received at least two inbound transactions satisfying a minimum size threshold (to filter dust), and
- has never broadcast an outbound transaction (i.e., has not sold or spent).
This definition intentionally captures ‘quiet hands’—entities behaving like vaults, escrow, or time-locked treasury wallets. Because the algorithm focuses on addresses that have not spent, it likely under-counts active long-term holders who occasionally rebalance UTXOs or consolidate outputs (those would cease to qualify). Conversely, it may over-count custodial flows that get parked in deposit-only shells before internal sweeping. That is not a fatal flaw; it simply means the indicator is best used as a directional measure of sock-drawer behavior rather than a precise headcount of ‘individual HODLers’.
Three caveats are worth underlining:
1. Address ≠ Person. A single institutional custodian can control many deposit-only addresses. A burst of new segregated accounts for ETF creations will amplify this metric without necessarily increasing the number of ultimate owners.
2. Internal reorganizations can look like demand. If a custodian migrates coins from older omnibus wallets to fresh vaults, the algorithm may record net ‘accumulation’ even though ownership hasn’t changed. Analysts should cross-check with exchange reserve balances and ETF creation/redemption prints to separate organic buys from bookkeeping.
3. Never-spent is a state, not a promise. These wallets have not sold yet. Their future behavior depends on mandates, not morals. Treat the line as a flow map, not a covenant.
Who Are the Likely Buyers?
If we triangulate on-chain flows with structural changes in market plumbing, four buyer archetypes emerge:
1) ETF and Public-Vehicle Pipelines
Spot ETFs and similar vehicles create units by delivering bitcoin to the trust in exchange for shares (through authorized participants). The APs typically source BTC from OTC desks and exchanges, then warehouse it with a qualified custodian. On-chain, that warehousing often appears as fresh deposit-only vaults—exactly what the metric flags. Even when primary market inflows slow, rolling rebalancing, share creations on volatility, and new segregated account structures can visibly swell the ‘accumulator’ curve.
2) Institutional and Corporate Treasuries
Family offices, funds, and corporates that dollar-cost average into BTC rarely churn inventory. Their security practices also push them toward infrequent spending (multi-sig, time locks, deep cold). Those operational choices get recognized as ‘accumulator’ behavior. Notably, when price is choppy and narratives are noisy, treasury buyers tend to buy calendars, not headlines—they keep stacking through discomfort.
3) OTC Desks and Prime Brokers Re-Segregating Coins
As counterparty rules tighten and clients demand transparency, brokers increasingly park client assets in segregated, programmatically controlled vaults. The transition away from omnibus hot wallets boosts the count of never-spent addresses. It’s partly cosmetic, but it also reduces rehypothecation risk—good for systemic stability.
4) Long-Horizon Whales and High-Net-Worth Individuals
Finally, we cannot ignore old-school HODLers. The post-halving issuance environment (reduced miner supply) plus fiat-rate expectations can pull forward accumulation from dollar-based savers seeking hard-cap exposure, especially in jurisdictions where access via ETFs or brokerages is improving.
Why This Matters for Liquidity, Volatility, and Price Discovery
Driven by any mix of the above, a rapid build in never-spent balances has three important implications:
1. Free Float Shrinkage. Coins migrating to cold, segregated storage temporarily exit the tradable float. If exchange reserves are falling at the same time, order-book depth thins and the market becomes more inelastic: a given notional can move price further in both directions.
2. Volatility ‘Spring-Loading.’ Paradoxically, heavy accumulation can coexist with drawdowns if marginal sellers dominate price in the short term. The longer the spring is compressed by off-market absorption, the sharper the eventual move when flows re-synchronize—up or down depending on the catalyst.
3. Realized Cap and Cost Basis Drift. When accumulators buy weakness, the realized price of coins in strong hands trends higher. That raises the market’s ‘conviction floor’: subsequent dips into those cost bases tend to find buyers quicker, while breakouts above them can travel further because overhead supply is cleaner.
How ETFs Amplify the Accumulator Footprint
ETF mechanics deserve deeper treatment because they neatly explain how one metric can ramp even when price stalls. Inflows arrive in lumps via creations; APs acquire spot (often OTC), deliver it to a custodian, and receive shares. The custodian then distributes assets to segregated cold wallets for security and auditing. None of that activity shows up as exchange trading volume, yet it pushes the accumulator series higher. Furthermore, as ETF assets grow, internal account reshuffles (new wallets per fund, per jurisdiction, or per auditor request) can temporarily mimic net accumulation in on-chain heuristics. To validate, serious desks compare the metric with:
- ETF creation/redemption totals and rolling 5-day flows;
- aggregate exchange reserve changes (spot and derivatives platforms);
- custodian-linked cluster behavior (where label data is available);
- basis and funding (to detect disconnects between spot demand and perp-led moves).
Cross-Checking the Signal: A Professional Workflow
When a single chart starts trending on social timelines, we do four sanity checks before altering positioning:
1. Confirm exchange reserve direction. If reserves fall while accumulators rise, the float is truly tightening. If reserves rise, you may be looking at internal reorganizations.
2. Check long-term holder (LTH) net position change. Rising LTH balances alongside accumulator growth supports the ‘supply sink’ narrative. If LTH is flat or negative, the cohort might be recycling coins internally.
3. Look at LTH-SOPR and aSOPR. Sub-1 prints during drawdowns suggest long-term coins are not taking profits; above-1 prints into strength tell you whether distribution is happening into the rally.
4. Map the UTXO Realized Price Distribution (URPD). If a dense pocket of realized cost sits just above spot and accumulators are growing, expect chop as that pocket gets digested; a clean air gap above increases the odds of trend continuation once resistance breaks.
Macro Backdrop: Why ‘Never-Spent’ Rose Now
The timing makes sense. Post-halving, miner issuance is structurally lower. At the same time, real yields have begun to roll over from cycle highs, and policymakers in key jurisdictions are normalizing crypto market structure (friendlier rhetoric, clearer custody rules, and ETF pipelines). For allocators looking out 3–5 years, those ingredients justify programmatic stacking regardless of weekly headlines. Said differently: the cost of being early is smaller than the cost of being structurally late when the asset’s supply schedule is hard-capped.
There is also a behavioral flywheel. Each new treasury announcement, ETF inflow burst, or insurance mandate for segregated custody nudges peers to adopt similar practices, which requires fresh never-spent vaults. The metric picks up the operational echo of those policy and governance choices.
What Could Go Wrong With the Interpretation
Strong narratives invite complacency. Here are the main pitfalls:
• Heuristic drift. Changes in the clustering methodology (or custodian wallet patterns) can move the series mechanically. Treat cliff-edges with caution whenever a vendor updates address tagging rules.
• Sweep illusions. Large custodians can rotate between vault architectures (e.g., different key quorum policies). Bulk sweeps into fresh addresses will look like new demand even if owners are unchanged.
• Bridging and wrappers. If coins are being wrapped or bridged to L2s with evolving address schemes, on-chain labels on L1 may lag, misclassifying movements as accumulation.
• ETF redemptions are lumpy. When redemptions arrive, the same pipes that filled the metric can drain it quickly. Because creations/redemptions settle on discrete cycles, the series can whipsaw.
Portfolio Translation: A Practical Operating Plan
Assuming you accept the series as broadly directional, here is how to convert it into decisions without fortune-telling:
1. Bias but verify. Treat sustained rises in never-spent demand as a tailwind for medium-term structure, not as a day-market update. Let price reclaim or build bases before you size up.
2. Track the trifecta. For tactical adds, want to see (i) rising accumulators, (ii) falling exchange reserves, and (iii) spot leadership over perps with neutral funding. Two out of three is acceptable; one out of three is a trap.
3. Separate spot from leverage. When accumulation rises but perps drive price with hot funding, fade exuberance into resistance and reload on clean retests.
4. Control downside with structure, not hope. Put invalidations outside noise (e.g., below the prior weekly low or an anchored VWAP) and respect them. Accumulator lines do not pay margin calls.
Scenario Map (Next 4–8 Weeks)
1) Base-Building Continuation (40%)
Accumulator growth persists; ETF net flows stabilize; exchange reserves grind lower. Price action remains choppy but prints higher lows on the weekly. Strategy: buy pullbacks to reclaimed levels, sell into first extensions, keep a runner only when breadth improves.
2) Reflexive Upside Break (35%)
A macro catalyst (e.g., liquidity easing or policy clarity) syncs with the tight float. Breakouts travel further because overhead supply has been redistributed to strong hands. Strategy: favor spot leadership; keep leverage modest; trail under weekly higher lows; avoid selling the first thrust unless breadth is poor.
3) Redemptions & Re-risking (25%)
A round of ETF redemptions and risk-off macro headlines reverse flows. The accumulator series cools as custodians move coins internally or distribute to market makers. Strategy: step down size, lean on deep liquidity pairs, re-enter only after the metric turns up again and perps reset.
For Builders and Executives
Even if you do not trade, the lesson is actionable. The long-horizon wallet growth tells you where the trust boundary is moving: toward auditable custody, segregated accounts, and verifiable settlement. Products that align with that boundary—better key management, proof-of-reserves, on-chain attestations—will enjoy demand tailwinds. If your protocol depends on elastic liquidity, design guardrails (circuit breakers, oracle sanity checks) that assume the tradable float could shrink suddenly as more coins vanish into never-spent vaults.
What to Watch Next (Dashboard)
• Accumulator series (7D/30D ROC): A slowing rate of change is the first tell that the spree is cooling.
• ETF creations/redemptions: The cleanest proxy for institutional pipes feeding those vaults.
• Exchange reserves (spot + derivatives): Confirm whether float is actually tightening.
• LTH Net Position Change + HODL Waves: Validate the migration of coins into aging cohorts.
• LTH-SOPR and aSOPR: Identify whether long-term holders are distributing into strength.
• Funding & basis: Ensure spot—not leverage—leads any rally that follows.
• URPD pockets near price: Map overhead supply to gauge how far a breakout can run before meeting dense seller memory.
Bottom Line
Record accumulation by never-spent addresses is not a meme; it is a structural clue. It tells us that entities with long horizons, strong governance, and institutional pipes are absorbing more of the finite supply, even while retail-style demand has cooled. That does not immunize price from drawdowns—short-term path still belongs to leverage and liquidity—but it does tilt the medium-term distribution of outcomes toward higher realized floors and sharper rallies if catalysts align. Treat the chart as a compass, not a map: it points north, but you still have to navigate weather, terrain, and time.


