2 Billion Dollars Liquidated and Old Bitcoin Whales Selling: Liquidity Stress or Cycle Reset?
The last 24 hours in the crypto market have been brutal, even by Bitcoin’s own standards. Price has slid toward the 81,000 USD zone after a persistent, multi-week downtrend. Around 2 billion USD in derivatives positions have been liquidated in a single day. And, to make sentiment worse, one of the headline stories is that a long-standing Bitcoin whale, reportedly Owen Gondon, has closed out roughly 1.3 billion USD worth of BTC accumulated since as far back as 2011.
On social media, this combination is being read as the worst possible omen: old whales capitulating, short-term holders underwater, derivatives metrics flashing red, and the calendar ticking toward the end of 2025 with structure looking fragile. But markets are rarely that simple. The same data that terrify short-term traders can, from a professional vantage point, look like the ingredients of a late-cycle washout rather than the start of a permanent breakdown.
In this article we treat the numbers you provide as scenario inputs and emphasise a key caveat up front: from this environment we cannot independently verify the identity of the whale or the precise liquidation and position figures. They should be understood as indicative of the pattern, not as audited facts. What we can do—what a serious analysis outlet is supposed to do—is unpack the mechanics and psychology behind these signals and frame the different paths that could emerge from here.
1. What actually happened: price, liquidations and whale selling
The sequence of events is straightforward enough:
• Bitcoin declines steadily from higher levels and trades down to the low 80,000s, with 81,000 USD becoming the focal support zone.
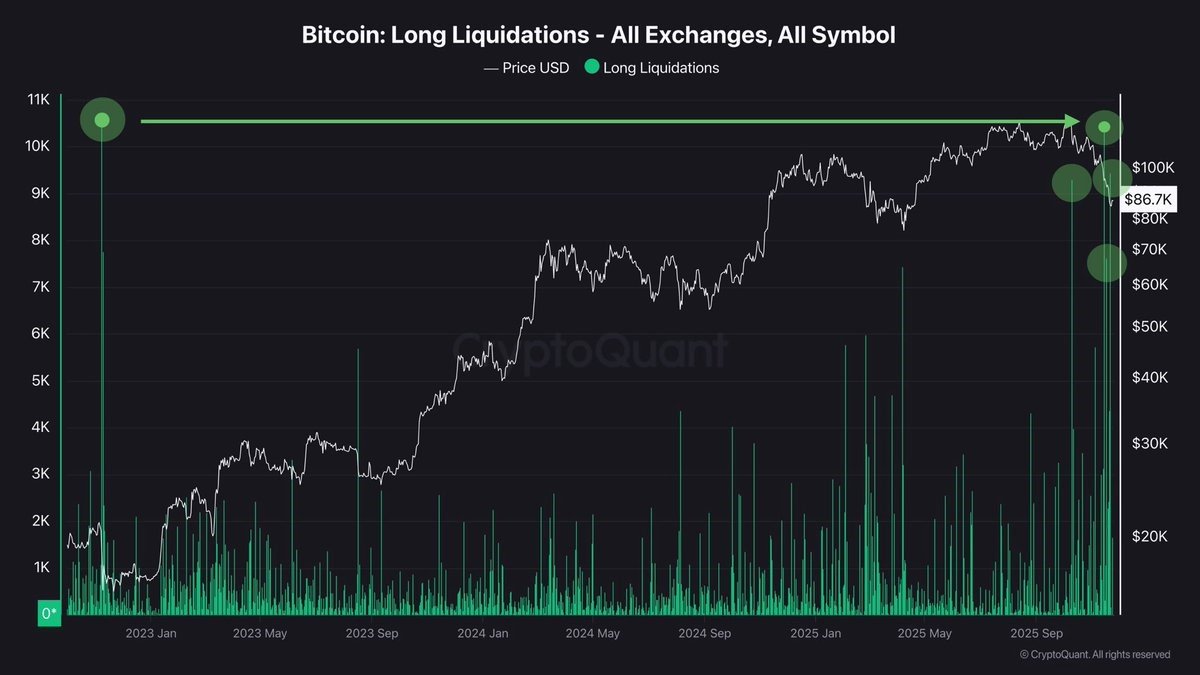
• As spot price grinds lower, overleveraged futures and perpetual positions begin to hit margin limits, producing roughly 2 billion USD in forced liquidations within 24 hours.
• Reports circulate that a long-term whale—Owen Gondon—has exited approximately 1.3 billion USD worth of BTC that had been accumulated over more than a decade.
• At the same time, on-chain and derivatives data show short-term holders (coins held less than ~6 months) sitting heavily in loss and capitulating.
• Futures markets move into backwardation (futures price below spot) and funding rates turn negative, while spot buying interest fades.
On the surface, this looks like a perfect bearish storm: long-term capital exiting, short-term capital blown out, and derivatives structure signalling fear. But each of these components tells a deeper story if we examine them in isolation.
2. A decade-long whale exits: signal or noise?
If the reports about Owen Gondon are accurate, we are dealing with a classic early adopter: someone who accumulated Bitcoin in the early 2010s and has held through multiple cycles. The decision to finally sell in size at current levels is emotionally loaded for the community, yet the motivations may be far more mundane.
2.1 Why would an old whale sell now?
There are several rational reasons a long-term holder might exit at this stage:
• Lifestyle change and diversification: After more than a decade of holding a highly volatile asset, locking in life-changing gains and spreading wealth into safer instruments is a rational move.
• Portfolio rebalancing: If Bitcoin has grown to dominate their net worth, selling some—perhaps even all—can be about reducing concentration risk, not about losing faith in BTC.
• Macro uncertainty: With end-of-year macro data, uncertain central bank policy and thinner liquidity, an older whale might decide that the risk-reward of holding through another full cycle no longer fits their personal objectives.
None of these explanations imply that Bitcoin as a system is "broken." They simply mean that the risk profile of a veteran holder has changed. In fact, history shows that every cycle sees some legendary early addresses finally distribute their coins to a new generation of investors. That is how ownership decentralises.
2.2 Why this still matters for market structure
Even if the decision is personally rational, the market impact can be significant. A 1.3 billion USD sale, unless conducted entirely via OTC block trades, increases spot supply at a time when derivatives markets are already fragile. It may:
- Accelerate the downside move as order books absorb large sells,
- Act as a psychological catalyst, with traders interpreting the exit as “smart money giving up”,
- And indirectly trigger additional liquidations as price pierces levels where leveraged longs were anchored.
However, it’s equally important to remember the other side of every trade: for a whale to offload Bitcoin, someone else must be buying. Whether that buyer is a mix of funds, OTC desks, Asian traders or other whales, coins are not vanishing—they are moving from old hands to new ones. Long-term, that redistribution is part of every Bitcoin cycle.
3. Short-term holders capitulate: the anatomy of pain
While the headline whale story grabs attention, the bulk of forced selling tends to come from another group: short-term holders who bought into strength over the last six months. According to your context, this cohort is now "almost entirely" in loss at current prices and many are being forced to realise those losses.
3.1 Why short-term holders hurt the most at cycle extremes
Short-term holders (STHs) are typically:
- More reactive to news and price swings,
- More likely to have used high leverage, especially via perpetual futures,
- And more prone to anchoring on recent highs when setting expectations.
When price is trending up, STHs amplify moves through aggressive long positioning. When the trend reverses, their pain meter spikes faster. They are the ones:
- Whose liquidation prices cluster in narrow ranges (producing the 2 billion USD wipeout),
- Whose stop-losses sit just below obvious support zones,
- And whose risk tolerance collapses as unrealised losses mount.
From a behavioural standpoint, STH capitulation is almost a feature of every major downturn. The key analytical question is whether that capitulation exhausts the bulk of marginal sellers, or whether it is simply the first wave of a much larger de-risking.
3.2 Long-term holders reducing, but not disappearing
Your description also notes that structural market metrics show weakening breadth as 2025 draws to a close. Some long-term holders are clearly selling, but we are not seeing a mass exodus of all seasoned investors. That’s consistent with typical late-cycle dynamics: a portion of long-term holders take profits, some whales exit entirely, but a significant base of conviction capital remains, increasingly concentrated in entities with multi-cycle experience.
This matters because those remaining long-term holders tend to represent the price-insensitive backbone of the market. As long as that base does not collapse, the asset’s fundamental scarcity and security characteristics remain intact, even if price undergoes a significant drawdown.
4. Derivatives metrics flashing stress: backwardation and negative funding
Perhaps the most technically revealing aspects of your description are the derivatives indicators: backwardation in futures and negative funding rates across perpetual swaps. Both are classical signs of stress and defensive positioning.
4.1 What backwardation tells us
Backwardation occurs when futures prices trade below spot. In a healthy bull trend, we usually see the opposite—futures at a premium (contango)—because traders are willing to pay extra for leveraged exposure and the time value of carrying a position. When futures flip below spot:
- It suggests that traders expect lower prices in the near future,
- Or that demand for hedging (shorting futures to protect spot) is overpowering speculative long demand,
- And that arbitrageurs may step in to buy futures and short spot, if basis becomes attractive enough.
In other words, backwardation is a sentiment indicator: it reflects widespread skepticism about the immediate outlook. Markets are willing to price in a discount for future delivery of Bitcoin relative to owning it today.
4.2 Negative funding: longs paying to suffer
Negative funding rates mean that traders who remain long in perpetual swaps are paying shorts to keep their positions open. At first glance that seems paradoxical: why would longs pay when price is falling. The answer lies in the time lag of positioning. Many of those longs were opened earlier at higher levels and have not yet capitulated. Funding turning negative signals that:
- Short demand has surged as traders position for further downside,
- Longs are under pressure but not fully flushed, and are effectively subsidising the shorts,
- And the market’s immediate bias has shifted from greed to fear and protection.
Historically, extended periods of backwardation and negative funding have often coincided with late-stage selloffs or mid-cycle shocks, not the start of a new bull market. But they can also mark good entry zones for investors with longer horizons, precisely because much of the leveraged optimism has already been burned away.
4.3 Spot demand drying up
Compounding the derivatives stress is your observation that spot demand has weakened. Early in the year, spot buying was strong; by year end, that appetite has faded. This creates a simple but dangerous imbalance:
- Sellers include long-term whales, short-term capitulators and hedgers,
- Buyers are fewer, more cautious and less willing to step in front of falling knives,
- Result: thinner order books and sharper price moves when sell pressure spikes.
In this environment, even moderate additional selling—from another whale, a large ETF redemption or a macro-driven de-risking—can produce outsized price moves simply because the passive bid has weakened.
5. End-of-year liquidity and the risk of an 80k retest
Several analysts in your context highlight a familiar seasonal concern: as the year closes, and especially as U.S. traders head into holiday periods, risk exposure is often trimmed. Funds lock in P&L, reduce directional speculative positions and raise cash. When that behaviour coincides with already-negative sentiment, Bitcoin and other high-beta assets can become vulnerable to "air pockets"—zones where a lack of active buyers leads to fast, slippery drops.
The 80,000 USD region is now in focus as a logical area to test. It is close enough to current prices to be within reach of a single bad day, but psychologically important enough that a clear break could:
- Trigger more stops and liquidations set just below round-number support,
- Amplify fear headlines about "Bitcoin losing 80k",
- And flush out yet another layer of weak hands.
That does not mean such a break is guaranteed. It simply means the market structure is sensitive to it. In illiquid holiday conditions, a few large orders can achieve outsized impact.
6. The contrarian view: why some see value here
Against this grim backdrop, the comment attributed to Ki Young Ju, CEO of CryptoQuant, stands out: he reportedly views current prices as a reasonable accumulation zone for investors with a longer time horizon. How can that be reconciled with all the bearish signals?
On-chain analysts like Ki typically look beyond raw price to metrics such as realised cap, long-term holder cost basis, spent output profit ratio (SOPR), and various cycle indicators. While we cannot pull live values here, the intuition is simple:
- When a large share of short-term holders are in loss and capitulating,
- When derivatives traders are paying to hold shorts and futures trade below spot,
- And when fear indicators spike while structural demand from certain regions (for example Asia) persists,
- Then the asymmetry for multi-year buyers can start to tilt positive, even if more downside is possible in the short run.
This is not a promise that price cannot fall further. Professional on-chain analysts rarely call exact bottoms. Instead, they speak in terms of value zones—regions where historical data suggest that coins bought and held through volatility have, over full cycles, produced attractive returns. The presence of long-term selling does not invalidate that view if, in aggregate, the market is still moving coins from weak hands to new, strong hands who intend to hold through the next epoch.
7. Possible paths from here: breakdown, base or violent rebound
Given the current configuration—whale selling, STH capitulation, backwardation, negative funding and weakening spot demand—there are three broad scenarios that a professional desk would monitor.
7.1 Bearish continuation: clean break and deeper flush
In the bearish case, cautious flows from whales and institutions continue, holiday liquidity thins further, and 80,000 USD fails decisively. That could:
- Trigger another wave of liquidations and stop-losses,
- Push volatility sharply higher,
- And drive Bitcoin into a lower range where long-term buyers reassess their risk tolerance.
In this scenario, structural damage could be more serious. Some leveraged players might be forced out permanently, and it could take months for confidence to rebuild. Yet, historically, the worst drawdowns in Bitcoin have also produced the best forward return profiles for genuinely patient capital.
7.2 Grinding base: sideways pain instead of vertical panic
A second scenario is a long, messy basing phase around the 80,000–90,000 USD band. Price chops sideways, punishing both bulls and bears; spot volumes remain muted; derivatives metrics gradually normalise. This outcome is often described as "max pain" because:
- It offers no cathartic capitulation,
- It slowly drains enthusiasm and attention,
- And it encourages traders to over-trade ranges, compounding losses through fees and slippage.
For builders and long-term allocators, though, a grinding base can be constructive. It provides time to accumulate, to hedge properly and to observe whether fundamental adoption (network activity, institutional integration, geographic demand) continues despite the lack of price excitement.
7.3 Violent rebound: forced sellers exhausted, buyers step in
The most optimistic short-term scenario is that the combination of 2 billion USD in liquidations, whale exits and negative derivatives structure has already done much of the necessary cleansing. In that case, any sign of:
- Stabilising macro expectations (for example clearer central bank guidance),
- Renewed ETF inflows or strong spot buying from specific regions,
- Or simple exhaustion of forced sellers,
Could trigger a sharp mean-reversion rally. When backwardation unwinds and funding flips back to neutral or slightly positive, shorts can become as vulnerable as longs once were. The same leverage that amplified the down move can then accelerate the rebound.
Professional desks do not speculative position their entire strategy on any single path. Instead, they size positions and hedge in ways that survive the bearish and sideways cases while allowing them to benefit from the bullish one.
8. What this all means for serious participants
For a retail trader, the current situation is emotionally simple: it feels terrible. For a professional or aspiring professional, it is more nuanced. Several key takeaways emerge from this configuration:
• Whale selling is inevitable in a maturing asset. The exit of a decade-long holder is part of the life cycle of any asset class. It says more about individual risk preferences than about Bitcoin’s protocol health.
• Derivatives stress is both a warning and a signal. Backwardation and negative funding tell you that fear is dominant and leverage is being punished. That argues against high-leverage longs—but it also tells you that many of the previously crowded positions have already been unwound.
• End-of-year flows can distort price. Thinner liquidity and risk-off rebalancing mean that price can overshoot in both directions relative to fundamental value.
• Time horizon dominates entry precision. For multi-year investors, whether the exact bottom is 80,000 or 70,000 USD matters less than whether they avoid forced leverage and define a risk budget they can live with through volatility.
The value of a professional analysis platform in this environment is not to shout "up only" or "game over," but to connect signals across order books, derivatives, on-chain flows and macro context. The raw facts—a 2 billion USD liquidation day, a 1.3 billion USD whale exit, backwardation and negative funding—are only the starting point. The real work is in translating them into an understanding of who is being flushed, who is stepping in, and how the board is being reset for the next major move.
Important note: The figures and individual names referenced in this article (including the reported whale, cumulative liquidations and derivatives metrics) are taken from the scenario described in the prompt and cannot be independently verified from this environment. They should be treated as illustrative of current market dynamics, not as audited data. This analysis is for informational and educational purposes only and does not constitute investment, trading, legal or tax advice. Digital assets are highly volatile and can result in the loss of all capital invested. Always perform your own research and consider consulting a qualified professional before making financial decisions.