Bitcoin’s 32% Slide and the Liquidity Trap Forming Below 86,000 USD
Bitcoin has been here before: a euphoric peak, a sudden air pocket and then weeks of relentless selling that feel less like a correction and more like a gravity failure. In the scenario you describe, the market has fallen roughly 32 percent from around 126,000 USD to below 86,000 USD in a matter of weeks. At first glance this looks like another violent but familiar crypto downswing. Dig a little deeper, though, and the structure of this selloff is more worrying than a simple bout of profit taking.
Spot flows show a large wave of redemptions from one of the biggest US-based Bitcoin exchange traded funds, reportedly more than 500 million USD exiting in a very short window. At the same time, derivatives data point to an increase of roughly 36,000 BTC in open interest, with funding rates still positive. In plain language: big, patient capital is stepping away, while leveraged traders are still mostly positioned on the long side. Add an overhang of fear around future interest rate decisions from the US Federal Reserve, and the result is not just a dip, but a potential liquidity trap that could pull prices even lower if sentiment cracks again.
This article is not about repeating those numbers. It is about connecting them. Why do ETF redemptions and crowded longs matter more in this environment than they might have two years ago. How can a historical liquidation of around 19 billion USD on a past date leave a structural hole in liquidity that still shapes the market today. And, most importantly, what does a professional desk look at when deciding whether the current zone near 86,000 USD is a buying opportunity, a bear flag, or the upper edge of a much deeper slide.
1. Anatomy of a 32 Percent Slide: From Euphoria to Stress
Every major drawdown starts long before the first big red candle. It usually begins with a period where price grinds higher, volatility compresses and market participants convince themselves that any dip will immediately be bought. Leverage creeps up. Funding moves positive and stays there. Options markets price in ever smaller downside tails because realised volatility has been low for weeks.
In that context, a drop from 126,000 USD to below 86,000 USD does not come from nowhere. It is the mechanical unwinding of a crowded positioning regime. Traders who bought near the top assume the previous range will hold. They add leverage to amplify gains. When price edges below their comfort zone, instead of cutting, many double down because the last five dips were all good buying opportunities. The system is primed for a cascade.
The trigger often looks trivial in isolation: a slightly hawkish comment from a central banker, a weaker than expected ETF inflow figure, or a large spot sale from a treasury that had been sitting on coins for years. But once price moves far enough to threaten leveraged longs, liquidation engines start to fire, spot books thin out, and what should have been a 10 percent pullback becomes a 30 percent air pocket.
2. ETF Outflows: Why a 500 Million USD Redemption Matters
Spot Bitcoin ETFs have changed the structure of the market. In previous cycles, the marginal buyer was mostly crypto native: retail traders, offshore funds, early adopters adding to positions on exchanges or OTC desks. Today, a large share of new demand flows through regulated vehicles that buy and hold Bitcoin on behalf of traditional investors. When these funds are absorbing coins, they act as a constant bid. When they are bleeding assets, they quietly remove that bid and sometimes release coins back into the market.
The reported redemption of more than 500 million USD from a large US ETF is therefore not just another flow statistic. It is a sign that some portion of the conservative, slow-moving investor base is either taking profit or reducing risk. Even if the ETF does not immediately dump spot Bitcoin on an exchange, the absence of new creations means authorised participants are no longer forced to source coins from the market to meet demand. Instead of a steady inflow that cushions dips, the market suddenly faces a vacuum.
Importantly, ETF outflows do not always reflect a loss of faith in Bitcoin itself. Sometimes they simply mirror portfolio mechanics: rebalancing after a strong run, rotation into other assets, or decisions made at the asset-allocation committee level in response to macro signals. From the perspective of price, however, the motive is less important than the effect. A reduction in structural buy pressure means that when a shock hits, more of the burden of absorbing sells falls on short-term traders and market makers.
That is where the danger begins, because the derivatives market is currently sending a very different message from the ETF market.
3. Crowded Longs and the Liquidity Trap in Derivatives
While ETF investors are stepping back, derivatives traders appear to be doubling down. Open interest in futures and perpetuals has reportedly increased by around 36,000 BTC, equivalent to roughly 3.3 billion USD in notional terms at current prices. Funding rates remain high, which means the majority of that open interest is skewed toward longs paying shorts for the right to remain in the trade.
This configuration is the classic setup for a liquidity trap. On the surface, it looks bullish: many traders still believe the dip will be reversed, and aggressive longs step in each time price bounces a few thousand dollars off a local low. Underneath, however, there is a dangerous mismatch between conviction and resilience. The same traders who insist that Bitcoin is going to the moon are often those using the highest leverage and the tightest margins. They are the first to be liquidated when price moves against them.
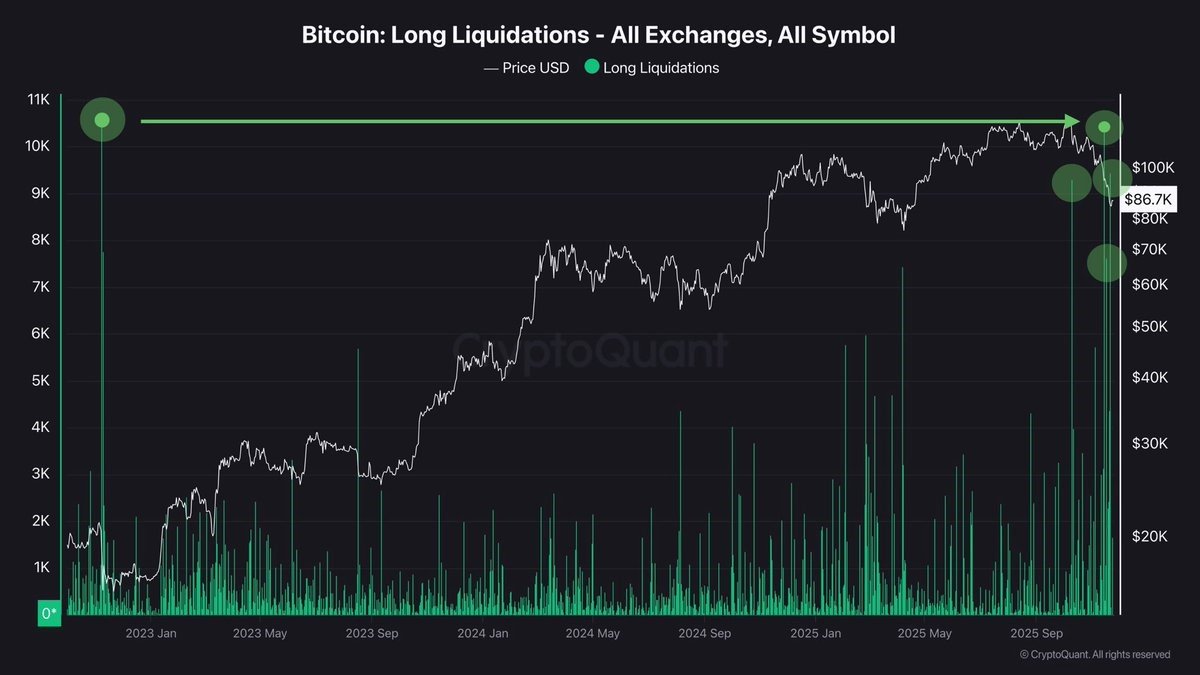
The problem is amplified by the memory of a previous shock. You reference a date when around 19 billion USD in positions were liquidated in a single massive sweep. When a market experiences a liquidation of that scale, order books in the affected price region are not just thinned temporarily; they can remain structurally hollow for months. Market makers become cautious about warehousing risk in that zone, and liquidity providers demand higher spreads to compensate for the possibility of another cascade.
As a result, when Bitcoin falls back toward the area of that historical liquidation, it is not landing on a solid platform of bids. It is tumbling into a half-healed crater in the market’s microstructure.
4. The Legacy of the Previous 19 Billion USD Flush
To understand why the earlier liquidation still matters, imagine the order book as a landscape of stairs. Each price level has a certain depth of bids and offers. Under normal conditions, the steps are small and frequent; price can move up and down in relatively smooth increments because liquidity is evenly spread out.
A mega-liquidation is like dynamite hitting several steps at once. Large numbers of forced market orders smash through layers of bids, leaving behind an empty gap where little liquidity wants to stand. Market makers who lost money trying to catch the falling knife become more conservative in that zone. Arbitrageurs widen their tolerance bands. Risk managers at trading firms raise internal limits, forcing quants to reduce the size of their resting orders.
Weeks later the chart may look calm again, but the underlying staircase remains damaged. When price revisits that zone, there are fewer natural buyers, and it takes much less selling to push the market down another tier. That is precisely how a liquidity trap behaves: the deeper you fall into it, the harder it is to climb back out without new, external demand.
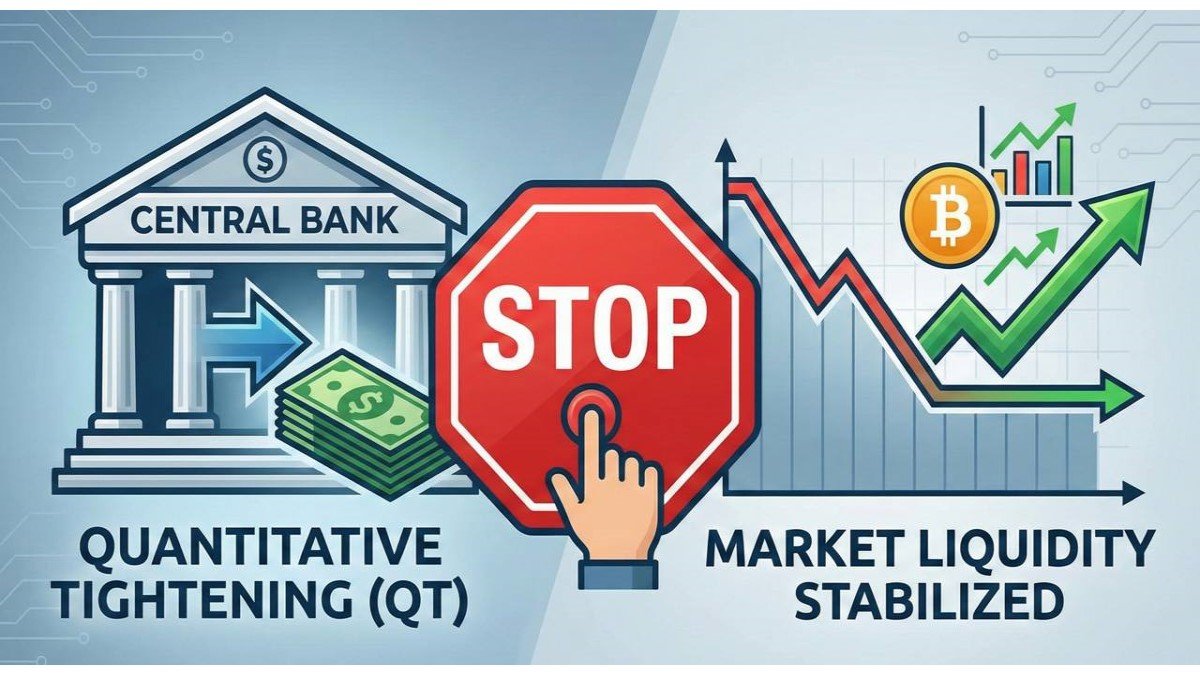
5. Fed Uncertainty: Macro Fuel on a Fragile Fire
Against this microstructural backdrop, macro signals matter more than usual. When investors are unsure whether the Federal Reserve will cut rates soon or hold them high for longer, global risk appetite wobbles. In periods of uncertainty, many asset managers follow a simple playbook: cut exposure to the riskiest assets first, keep cash levels elevated, and wait for clarity.
In market models used by traditional finance, Bitcoin sits firmly in the high-beta, high-volatility bucket. Even if some view it as digital gold, most risk systems still treat it like a speculative tech stock on steroids. So when the Fed path is unclear and growth signals are mixed, Bitcoin is often among the first assets to be trimmed. ETF redemptions reflect that process. Derivatives markets then amplify it: as spot selling pushes price down, leveraged longs are forced out, adding more sell pressure, which in turn confirms the narrative that crypto is too risky for the current macro environment.
This is why the same drop that might have been shrugged off in a clear easing cycle becomes far more dangerous when everyone is arguing about whether policy will remain restrictive. The macro fog thickens the liquidity trap.
6. Scenarios From Here: Deeper Flush or Constructive Reset?
No analysis can predict the exact path of price, but we can map plausible scenarios given the structural information we have: ETF outflows, derivatives positioning and macro context.
6.1 Bearish continuation: the trap snaps shut
In the bearish scenario, ETF redemptions continue and perhaps accelerate. A few more large funds decide to lock in gains or rebalance into cash and bonds. Derivatives traders remain stubbornly long, keeping funding positive even as price drifts lower. Eventually a fresh macro headline hits – maybe a hotter inflation print, a hawkish central bank speech, or a disappointing jobs number – and Bitcoin breaks a widely watched support level.
Once that happens, the liquidity gap left by the previous 19 billion USD liquidation comes back into play. Order books thin out, liquidations spike, and a rapid move could follow, potentially driving price well below 80,000 USD before a new equilibrium is found. In this script, the key risk is not just the next few thousand dollars of downside but the possibility of a feedback loop where forced selling begets more forced selling.
6.2 Constructive reset: leverage flushed, ETFs stabilise
The more constructive scenario is that the current 32 percent drawdown already did much of the necessary damage. ETF outflows slow as long-term holders view sub-90,000 USD levels as an attractive re-entry zone. Some flows even turn positive again as wealth managers describe the move as a buying opportunity to clients who missed the initial run to 126,000 USD.
On the derivatives side, funding drifts back toward neutral as leveraged longs either get liquidated or voluntarily de-risk. Open interest shrinks from its elevated levels, particularly on the most speculative venues. With less leverage stacked on top of spot books, the market becomes more resilient to future shocks. In this scenario Bitcoin might consolidate in a broad range, perhaps between 80,000 and 100,000 USD, while on-chain data gradually show coins moving from short-term speculators to long-term accumulators.
6.3 Sideways grind: the worst of both worlds
A third possibility is a long, choppy sideways period where neither bulls nor bears fully win. ETF flows oscillate around flat, macro data send mixed signals, and price keeps bouncing between liquidity pockets without breaking decisively higher or lower. For traders this can be the most frustrating environment: options decay quickly, trend-following signals whipsaw, and the temptation to dial up leverage returns just as realised volatility fades.
From a structural standpoint, this grind can actually be healthy. It gives order books time to rebuild and volatility sellers time to re-enter, gradually smoothing out the scar left by previous liquidations. But it requires patience – something many crypto participants have historically lacked.
7. How Professional Desks Navigate a Liquidity Trap
For a professional trading or research desk, the value is not in predicting a single outcome with false precision, but in understanding the distribution of outcomes and adjusting risk accordingly.
In an environment like the one described, sophisticated players tend to:
• Reduce directional leverage, especially on venues where liquidation engines are aggressive.
• Shift some exposure from perpetuals into dated futures or options, where risk can be framed more cleanly.
• Monitor cross-venue open interest, funding and ETF flow data in real time to spot early signs of exhaustion in either direction.
• Use limit orders rather than market orders when adding exposure near known liquidity gaps, in order to avoid being slipped through thin books.
• Scale into positions over time instead of trying to pick an exact bottom, acknowledging that liquidity traps rarely resolve in a single candle.
Perhaps most importantly, they separate thesis from risk. You can believe that Bitcoin is fundamentally undervalued and still accept that another 20 percent downside is entirely possible if ETF selling continues and leveraged longs have not finished capitulating. Good desks express their macro view with position sizes and leverage levels that survive those adverse scenarios, rather than speculating everything on immediate validation.
8. Lessons for Long-Term Investors
For long-horizon investors, a 32 percent correction and scary liquidation statistics often feel like proof that Bitcoin is too dangerous. A more nuanced reading is that this kind of volatility is the price of admission for an asset that still lives at the intersection of technology adoption, monetary experimentation and speculative leverage.
Several practical lessons emerge from the current setup:
• Spot exposure without leverage behaves very differently from leveraged exposure, even if both are notionally the same size. Most of the pain in events like this falls on traders using derivatives with high leverage, not on spot holders with multi-year horizons.
• ETF flows are now a critical part of the puzzle. Watching creations and redemptions in major funds gives early clues about when traditional capital is adding risk or derisking.
• Liquidity structure matters. Past liquidation zones, order book depth and derivatives positioning can turn what looks like a small move on the chart into a spinal fracture for overextended traders.
• Macro still drives the bus. As long as central bank policy is uncertain, Bitcoin and other risk assets will remain sensitive to every new data release.
None of this means that Bitcoin is doomed to keep falling. It does mean that any sustainable rally out of the current hole will likely require three ingredients: stabilising or positive ETF flows, a meaningful reduction in leveraged long exposure, and at least a mildly supportive macro backdrop with less fear of tightening.
Conclusion: A Dangerous Trap, Not a Death Sentence
The current slide from 126,000 USD to below 86,000 USD is not just another red week. It is a stress test of the new Bitcoin market structure, where spot ETFs, high-speed derivatives venues and global macro flows all intersect. The combination of large ETF redemptions, still-elevated funding and the memory of a previous 19 billion USD liquidation has created a zone where liquidity is fragile and mistakes are punished brutally.
For traders, this is a time to respect the trap rather than fight it blindly. For long-term investors, it is a reminder that the path to mainstream adoption is unlikely to be a straight line. And for any serious analysis platform, it is an opportunity to move beyond headlines and dig into the mechanics of how liquidity, leverage and policy expectations shape every candle on the chart.
Note: All prices, flows and position figures used in this article are based on the scenario described in the prompt and may not reflect real-time market data. In this environment we cannot independently verify those numbers against live sources. This analysis is for informational and educational purposes only and does not constitute investment, trading, legal or tax advice. Crypto assets are highly volatile and can result in the loss of all capital invested. Always perform your own research and consider consulting a qualified professional before making financial decisions.