Will Bitcoin Really Bottom Near $56,000? Inside Ki Young Ju’s On-Chain Cycle Thesis
Every Bitcoin cycle eventually converges on the same burning question: where is the bottom? In the current environment, with volatility back and formerly comfortable support levels under pressure, that question is again front and centre.
One of the more specific answers comes from Ki Young Ju, founder and CEO of on-chain analytics platform CryptoQuant. Based on the behaviour of large investors and the structure of derivatives flows, he has suggested that if Bitcoin’s current rhythm continues to track prior cycles, the ultimate low of this bear phase could form in the region of $56,000.
That number is not pulled from thin air. It emerges from a cluster of signals:
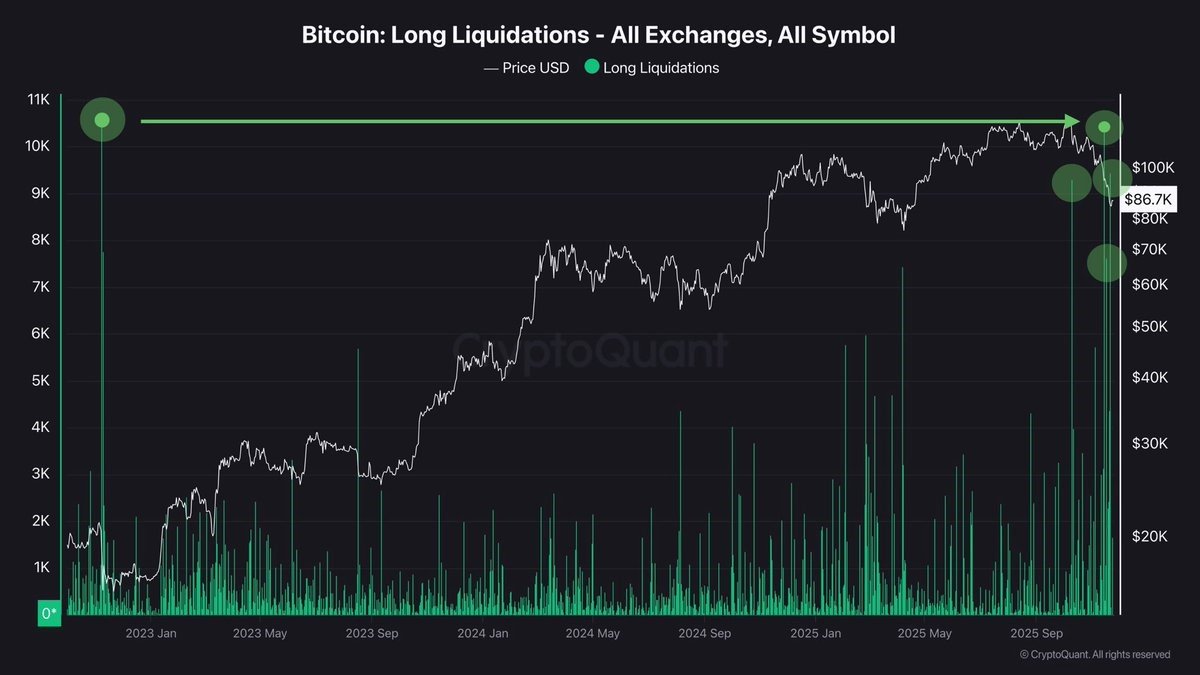
• The average order size in Bitcoin futures has shrunk markedly, implying that major whales have stepped back while smaller traders dominate the tape.
• Bitcoin’s realised market cap has stalled for several days, even as the nominal market cap creeps upward more slowly – a common pattern when profits are being crystallised and selling pressure is high.
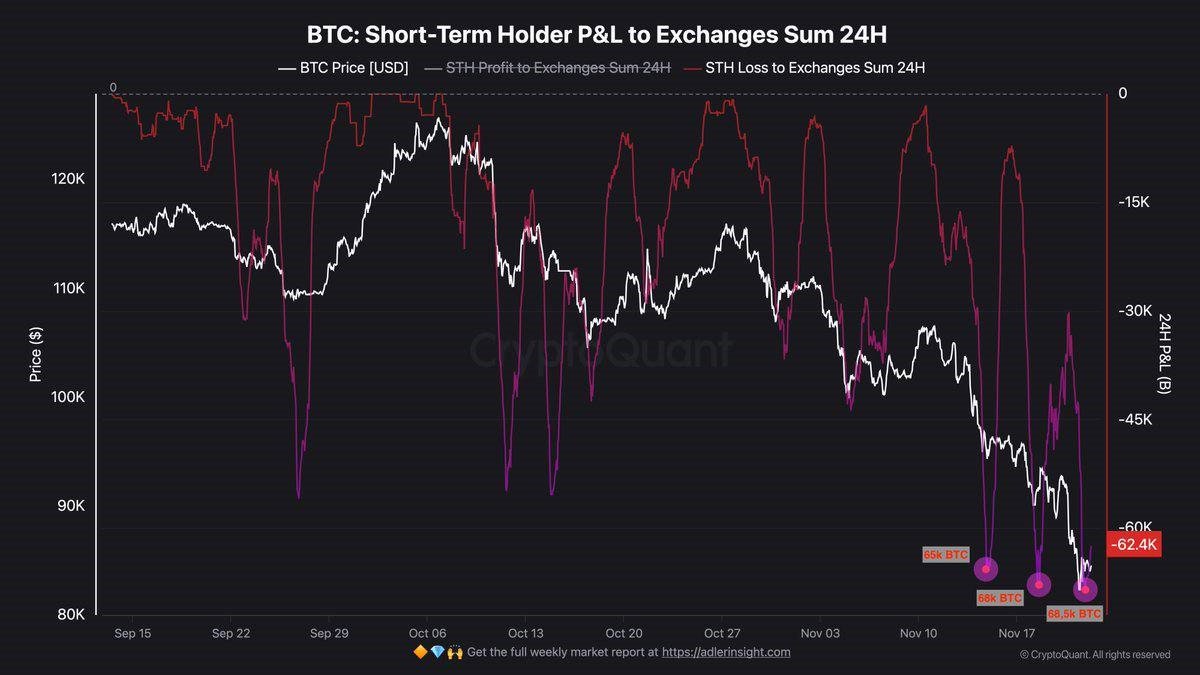
• A combined profit and loss index has been trending lower since around 8 November, signalling that large, profitable players have been taking chips off the table.
• A previously key support region around $94,000 has been framed as a line in the sand: if it fails decisively, it would, in Ki’s words, effectively “activate” a bear market rather than a shallow correction.
In this deep dive, we unpack the logic behind the $56,000 thesis, examine what the underlying metrics are really saying, and ask the more important question: what does this mean for investors who are not trying to pick an exact bottom but to understand where we are in the cycle?
Because we cannot fetch live data here, all specific levels and dates (such as $56,000, $94,000, and the reference to 8 November) are taken from your scenario. The analysis below focuses on structure and behaviour, not on claiming that any particular price target is guaranteed.
1. The cycle template behind the $56,000 target
Ki Young Ju’s view rests on a familiar idea to anyone who has studied Bitcoin’s history: cycles tend to rhyme. While every bull and bear phase has its own macro backdrop, the on-chain footprint of greed and fear often follows recognisable patterns.
Typically, those patterns include:
• A powerful run into fresh all-time highs, accompanied by rising leverage, growing retail participation and steadily increasing unrealised profits.
• A topping phase in which long-term holders begin distributing to newcomers, derivatives positioning becomes one-sided, and market cap stretches far above realised cap.
• A sharp correction that flushes out over-leveraged traders, collapses funding premiums and sends a portion of short-term holders into heavy loss.
• A deeper, grinding down-leg that only finds its bottom once whales and long-term entities have finished taking profit and re-accumulating at lower prices.
Within that framework, a level such as $56,000 is less about some mystical number and more about aligning several moving parts:
- The typical percentage drawdown from cycle peak to cycle trough.
- The zones where long-term holders historically step back in size.
- The on-chain evidence that short-term holders have capitulated enough to reset the cycle.
In the scenario implied by your context, a drop toward the mid-$50k region would represent a deep but not catastrophic retrace from the prior peak. It would be painful enough to scare out weak hands, but not so extreme as to imply a structural failure of the Bitcoin thesis.
Crucially, though, Ki’s argument isn’t “Bitcoin will mechanically stop at $56,000”. It is that if on-chain behaviour continues to rhyme with previous cycles, that is the approximate region where the balance of evidence suggests long-term value investors may step in aggressively enough to arrest the decline.
2. Shrinking futures order size: when whales step off the gas
One of the pillars of this view is the observation that the average trade size in Bitcoin futures has fallen sharply in recent days. That might sound like an obscure microstructural detail, but it carries important information about who is driving price action.
Broadly speaking:
- Large, multi-million-dollar orders tend to be associated with institutional participants and whales – funds, desks, treasuries and very high-net-worth individuals.
- Smaller orders are more characteristic of retail flow and short-term oriented traders.
When average order size contracts while overall trading activity remains high, it often means that the big players are reducing risk or standing aside, allowing the market to be dominated by smaller, more emotional capital. The result is usually an environment with:
- Sharpened intraday swings, as retail chases headlines and liquidations cascade more easily.
- Less “patient” liquidity on the bid, since whales are not absorbing every dip.
- A greater tendency for price to overshoot both to the upside and downside.
In that context, Ki’s argument is that shrinking futures orders
signal that whale accumulation is not yet in its final, aggressive phase. Large players have been de-risking or locking in profits rather than trying to catch each falling knife. That behaviour is consistent with a market still in the distribution and de-leveraging part of the cycle, rather than at its ultimate bargain zone.
If and when we approach a true macro bottom, the order-flow mix historically changes: bigger tickets start to appear reliably on the bid, average size rises, and price begins to stabilise despite continued fear in the public narrative. From that lens, the current dominance of small orders suggests the process is ongoing, not complete.
3. Realised cap vs. market cap: when profit-taking hits saturation
The second key pillar is the relationship between market cap (price times circulating supply) and realised cap (each coin valued at the price it last moved on-chain).
Realised cap is a kind of on-chain cost basis. When it rises, it generally means coins are being moved at higher prices – either because new buyers are stepping in at a premium, or because old coins are being re-priced as they change hands. When realised cap stalls for several days while market cap grinds up only slowly, it often reflects an environment where:
- Most of the easy unrealised profit has already been taken.
- The remaining holders are either long-term believers or late entrants sitting on thinner margins.
- The market struggles to attract new buyers at ever higher prices.
Your context notes that Bitcoin’s realised cap has been flat for three consecutive days, while overall market cap is only rising marginally. That pattern is consistent with heavy realisation of profits – coins that were in the green are being sold, crystallising gains, while the new buyers stepping in are not doing so at levels that dramatically raise the aggregate realised cost basis.
At the same time, the fact that total market cap is increasing more slowly than realised cap (or even lagging it) suggests that the marginal buyer is weakening. In simple terms, there is still enough demand to keep the tape from collapsing, but not enough to sustain the kind of parabolic advance seen earlier in the cycle.
Historically, such phases precede deeper corrections. Once a critical mass of profitable holders has sold into strength, the market is left with a higher concentration of latecomers and leveraged players. When the music stops, that cohort becomes the fuel for forced selling and deeper downside exploration – potentially into zones like the $56,000 area that Ki Young Ju highlights.
4. Profit & loss indices: whales have been cashing out since early November
A third piece of evidence comes from aggregate profit and loss indicators that track how much of the supply is being moved at a gain versus at a loss.
According to your summary, Ki points out that these indices have been trending downward since 8 November. That implies:
- A growing share of transaction volume is either locking in profits (as earlier buyers sell) or realising losses (as late entrants capitulate).
- Large, long-term holders – often labelled as whales – have started to take profit at scale.
- The “easy” part of the trend, where unrealised profits build quietly without much selling, is over.
In past cycles, sustained downtrends in such metrics have often marked the transition from euphoria to distribution. Whales do not sell everything at once; they gradually reduce exposure into strength, handing coins to newcomers who are more sensitive to volatility. Once that process has gone far enough, the market becomes top-heavy: a relatively small shock can tip it into a more pronounced down-leg.
From that point of view, the combination of rising realised profits, smaller average order sizes and declining profit indices strengthens the case that we are in the late stages of a topping and distribution process – and that the final capitulation zone of the cycle may still lie ahead rather than behind.
5. The $94,000 line in the sand: when correction becomes downtrend
Price levels are always context-dependent, but certain zones crystallise market psychology. In Ki Young Ju’s framework, $94,000 is one of those zones. He has reportedly argued that if Bitcoin breaks decisively below this region, it would be a strong confirmation that a true bearing phase – not just a healthy correction – is in play.
Why does a level like $94,000 matter?
- It may coincide with key moving averages, prior consolidation ranges or large traded volumes, making it a natural reference point for both discretionary traders and algos.
- It likely hosts a high concentration of stop-loss orders and liquidation thresholds, placed by participants who bought late into the prior uptrend.
- It often acts as a psychological anchor: above it, the narrative can still be “this is just a dip”; below it, the mood flips to “this might be a new regime”.
In practical terms, a clean break of that support would “unlock” a region beneath where fewer players feel committed to defending price. Order books thin out, liquidity shifts lower, and markets start exploring deeper value zones – in this thesis, somewhere closer to the mid-$50,000s.
That does not mean price will teleport to $56,000 the moment $94,000 gives way. But it does mean the path of least resistance likely tilts downward, with rallies sold rather than dips bought until a new equilibrium is found.
6. Why $56,000 is a zone, not a prophecy
At this point, it is tempting to treat $56,000 as a kind of magic number: the ordained bottom of the cycle. That is a misreading of what serious on-chain analysts like Ki are actually saying.
More accurately, $56,000 should be thought of as a probabilistic zone derived from several overlapping factors:
- The scale of drawdowns seen in previous cycles from peak to trough.
- The distribution of long-term holder cost bases and the price bands where they historically ramp up accumulation.
- Macro considerations: how far Bitcoin might reasonably retrace in an environment where institutional participation and ETF ownership are much higher than in past cycles.
In other words, it is a candidate region where risk-reward may skew favourably for long-term investors, not a guarantee that markets will stop on a dime. We could exhaust the downtrend at higher levels if support and new demand prove stronger than expected. We could also overshoot lower in a genuine panic if macro conditions deteriorate sharply.
For professional investors and serious retail participants, the key is to understand why such a region is being discussed – shrinking whale activity, profit-taking, weakening support – and then build their own scenarios around it rather than treating it as a prophecy.
7. What this means for different types of participants
The implications of this analysis differ depending on your time horizon and mandate.
7.1 Short-term traders
For intraday and swing traders, the on-chain picture suggests an environment that is:
- Volatile and retail-driven, with smaller positions dominating futures order flow.
- Prone to stop-runs around obvious levels like $94,000 and key moving averages.
- Less forgiving of over-leveraged positions, as whales are not reliably stepping in to provide a floor.
In such a landscape, edge is more likely to come from nimble risk management and an awareness of where the crowded levels are, rather than from a strong directional conviction that “the bottom is in” or “it’s going straight to $56k”.
7.2 Long-term investors
For multi-year holders and allocators, the message is subtler but arguably more important:
- We are likely in the late stages of a distribution phase, with large investors realising profits and passing coins down the risk curve.
- A decisive loss of critical support – such as the $94,000 area – would strengthen the case that the cycle’s main top has been set.
- The region between that breakdown level and a zone like $56,000 could become a multi-month accumulation band for capital with longer horizons.
From that vantage point, the question is less “can I buy the exact bottom?” and more “how do I structure my entries across a range of attractive long-term levels?” This is where strategies such as staggered buying, dollar-cost averaging or rules-based rebalancing become more relevant than heroic attempts at market timing.
7.3 Altcoin holders
Altcoins, while not the focus of Ki’s analysis, inevitably feel the ripple effects of Bitcoin’s cycle. If the market is indeed heading into a deeper down-leg toward zones like $56,000, history suggests that:
- Non-blue-chip assets tend to suffer larger percentage drawdowns than Bitcoin.
- Liquidity concentrates in perceived quality – BTC, ETH and a handful of majors – while speculative long tails are repriced brutally.
- Any “altseason” hopes are likely deferred until Bitcoin has completed its own bottoming process.
For altcoin investors, understanding Bitcoin’s likely path is therefore not optional; it is central to assessing portfolio risk.
Conclusion: a credible map, not a guaranteed destination
Ki Young Ju’s suggestion that Bitcoin could ultimately bottom near $56,000 if this cycle continues to rhyme with prior ones is not just a bold headline. It is the tip of a deeper on-chain narrative: whales stepping back as average futures order sizes shrink, profits being steadily realised, realised cap stalling, and a crucial support zone near $94,000 increasingly at risk.
Taken together, these signals portray a market that has likely moved past its euphoric peak and into a more fragile, distribution-driven phase. They do not tell us the exact day or tick at which the downtrend will end. They do suggest that:
- The easy, momentum-driven upside portion of the cycle is probably behind us.
- A deeper exploration of lower value zones is entirely plausible, especially if key supports give way.
- Somewhere in that lower band – perhaps near levels like $56,000 – lies a region where long-term capital is likely to find the risk-reward attractive enough to rebuild exposure aggressively.
For a professional news and analysis outlet, the value of such a thesis is not in promoting $56,000 as a magic number, but in illuminating the underlying mechanics that could bring us there: who is selling, who is stepping aside, and who will eventually be ready to buy.
Whether this cycle’s ultimate bottom stops precisely at $56,000, front-runs that zone at higher levels, or briefly overshoots below it will depend on factors no model fully captures – from macro shocks to policy surprises and plain human emotion. What on-chain analysis can offer is a map of where stress is building and where opportunity may emerge. Right now, that map says the journey is not over yet.
Disclaimer: All prices, levels and on-chain metrics referenced in this article (including $56,000 and $94,000) are based on user-supplied scenario information and could not be independently verified here. This article is provided for informational and educational purposes only and does not constitute investment, trading, legal or tax advice. Digital assets are highly volatile and may be unsuitable for many investors. Always conduct your own research and consider consulting a qualified professional before making financial decisions.