
USDT Dominance Is Flashing a Bottom Signal: Reading the Last Relief Wave for Bitcoin and Altcoins
Most traders watch Bitcoin and forget that a large part of the market quietly trades something else every day: neutral dollars on chain. When fear spikes, traders rush into stablecoins like USDT. When confidence returns, that parked liquidity flows back into Bitcoin and altcoins. The chart you attached, USDT.D, turns that behaviour into a clean visual: it measures the market share of Tether compared with the rest of crypto.
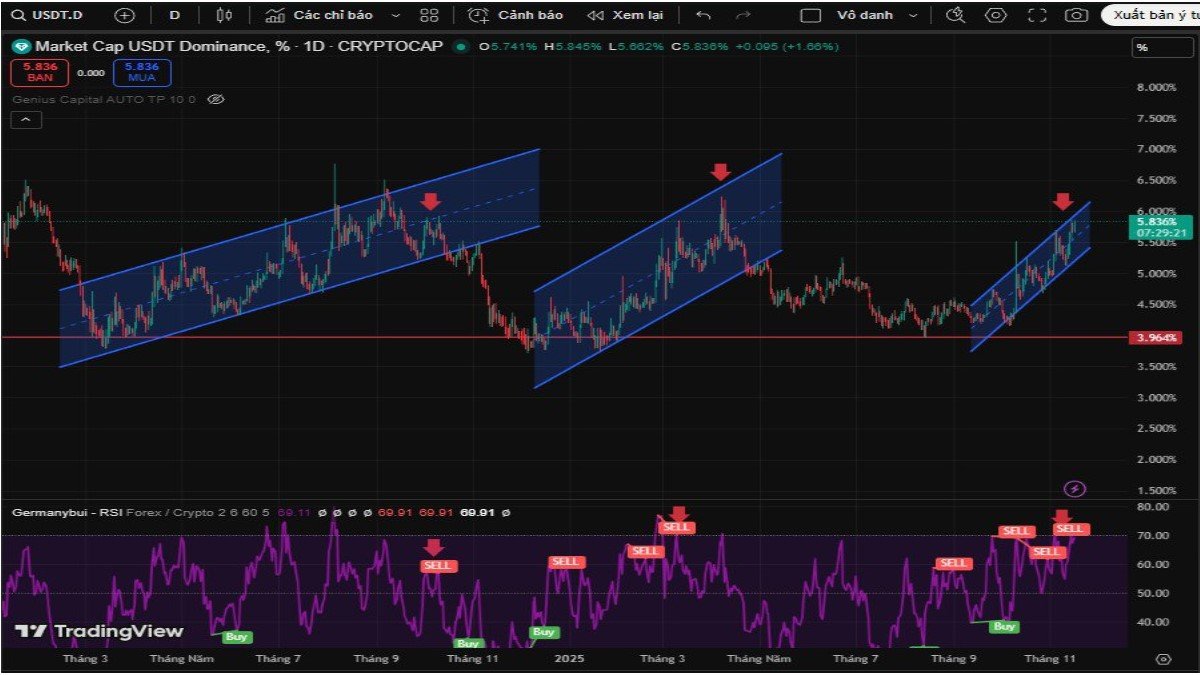
On that chart, an important pattern has been repeating. Each time USDT dominance touches a key resistance band, Bitcoin is usually forming a short term top. When USDT.D keeps grinding higher, eventually hits a rising trend line and starts to show bearish divergence on the daily time frame, a powerful reversal in dominance is often close. When that reversal starts, USDT loses share because traders are leaving the safety of stablecoins and buying coins again. That moment has tended to line up with short term Bitcoin bottoms and the start of recovery phases for altcoins.
Right now, USDT.D is back in that familiar late stage zone: pressing into an upper resistance area, testing a rising trend line and flashing signs of momentum exhaustion. Combined with the structure we see on Bitcoin dominance and on the BTC price chart itself, this suggests that the market is not at the start of a fresh crash, but rather somewhere near the end of the current down leg. The implication is not that risk has disappeared, but that the next large move is increasingly likely to be an upward relief wave rather than another straight line dump.
1. What USDT.D actually measures and why it matters
USDT.D is shorthand for USDT dominance: the percentage of total crypto market capitalisation represented by Tether. When that percentage rises, it usually means one of two things is happening:
- Prices of volatile coins are falling faster than the supply of USDT is shrinking, so the stablecoin naturally takes a bigger share of the pie.
- Traders are actively selling coins into USDT, increasing demand for the stable asset as they de risk.
When USDT.D falls, the opposite is true. Either coins are rising faster than stablecoins, or investors are converting their tether back into BTC and other assets. Taken together, the index is a sentiment gauge for the entire market. In broad strokes:
- High and rising USDT dominance indicates fear, hedging and capital sitting on the sidelines.
- Low and falling USDT dominance suggests risk appetite, rotation into spot exposure and a willingness to hold volatility.
Because Bitcoin is still the benchmark asset of the space, there is often a loose inverse relationship between BTC price and USDT.D. Peaks in USDT.D frequently align with local lows in Bitcoin, and vice versa. The chart you provided focuses on exactly that relationship and highlights how repeating structures in USDT.D can help frame where we are inside a Bitcoin swing.
2. The recurring pattern: resistance, trend line touch, daily divergence
Looking back across the last major cycles, we can describe a recurring sequence in USDT dominance in three stages.
Stage one: first touch of the red resistance band
At the start of a correction, Bitcoin is still elevated and altcoins are still relatively expensive. As prices begin to fall, traders rush into USDT and other stablecoins. USDT.D spikes from low levels into a well defined horizontal resistance area, marked in red on your chart. That first touch often occurs when Bitcoin is putting in a short term high within a lower time frame range.
At this stage the story is simple: risk assets are heading lower, stablecoins are gaining share. Many traders still think of the move as a routine dip. They rotate part of their exposure into USDT, but they have not capitulated. The red band becomes the first warning sign that capital is becoming defensive.
Stage two: grind higher into the rising trend line
After that initial spike, USDT dominance rarely collapses immediately. Instead it usually grinds higher along a rising trend channel. Each local pullback in USDT.D corresponds to a short lived bounce in Bitcoin. Each new higher high in dominance corresponds to another wave of selling in coins.
On your chart this grind is captured by a diagonal trend line. The important observation is that when USDT.D finally touches that line again after an extended run from the base, the width of the move and the time spent climbing tend to be mature. The trend is ageing.
Stage three: momentum divergence and reversal
The final ingredient is a bearish divergence on the daily time frame. Price, in this case the value of USDT dominance, prints a higher high. Momentum indicators such as RSI, MACD or simple rate of change print a lower high. The market is still crawling upward in dominance, but the fuel behind the move is fading.
That is the moment when strong hands start preparing for a reversal. As soon as supply shocks in Bitcoin ease, or new demand appears, tether dominance can fall quickly. Every unit of USDT sitting in exchanges becomes potential buy pressure on spot assets. Historically, the start of these down legs in USDT.D has mapped closely to short term bottoms in Bitcoin price and to the beginning of altcoin relief rallies.
3. Where we are now: late in the fear leg, close to the relief wave
Applying that template to the current structure, several points stand out.
- USDT dominance has already surged from its lows and visited the red resistance region, which in past moves has coincided with short term BTC tops and the first deep sell off.
- Since then it has continued to climb, tracking a rising trend line that marks the main fear leg of this correction.
- On the daily chart, momentum no longer confirms the higher highs in USDT.D. We can see a clear pattern where the index has edged upward while indicators roll over, a textbook bearish divergence.
This is the same combination you highlighted in your notes: contact with the trend line, daily divergence, and a pattern of exhausted buying of safety. Each time something similar has appeared in the past, the next significant move has been a sharp drop in USDT dominance, not a continuation higher. When that drop happens, money is no longer flowing into tether; it is flowing out of it.
In parallel, Bitcoin dominance itself is not at euphoric levels. It has expanded during the risk off phase as BTC has outperformed altcoins on the way down, but the structure still looks like a corrective expansion rather than the start of a brand new Bitcoin only super cycle. That reinforces the message from USDT.D: the current move is more likely the concluding wave of a down swing than the start of an entirely new regime.
4. Translating the signal into a cycle roadmap for BTC and altcoins
Putting all of this together, we can sketch a reasonable scenario for the coming weeks. It is not a promise, but a structured way to think about risk.
Phase A: forming a short term Bitcoin bottom
As USDT dominance stalls at trend line resistance and daily divergence matures, Bitcoin is likely to be trading near the low of the current leg. That does not mean the exact bottom has printed, but it does suggest that the distance to the eventual low is smaller than the distance to the next meaningful high.
In this phase, sentiment often feels worst. Funding rates are depressed, liquidations create long wicks, social media is filled with bottom calling and despair in equal measure. Yet under the surface, smart money is beginning to scale into positions, swapping a portion of their tether back into BTC and higher quality altcoins. The USDT.D chart is where you see this rotation before it is obvious on price charts.
Phase B: the last relief rally before a broader downtrend
Once USDT dominance turns down decisively, Bitcoin tends to move into a relief rally. In your broader macro framework you describe this as the final recovery wave before a full downtrend takes control. The idea is simple: the market does not go directly from peak euphoria into multi year bear in a straight line. It usually passes through a transitional phase where one last rally allows late participants to exit closer to break even.
During this relief leg:
- Bitcoin retraces a portion of its decline, often moving back toward major daily moving averages or previous support turned resistance zones.
- USDT.D continues to fall as traders slowly shift back from safety into volatility.
- Altcoins, which were crushed during the fear leg, often rebound harder in percentage terms, as even small inflows have outsized price impact when liquidity is thin.
For investors who survived the sell off, this phase is psychologically tricky. On the one hand, portfolios finally stop bleeding. On the other, the memory of recent losses can make it hard to sell into strength. That is why having a structural roadmap in advance is valuable: it turns emotional noise into pre planned decision points.
Phase C: transition into the broader downtrend
Eventually, if the larger cycle really has topped, the relief rally will give way to a more sustained bear trend. On the chart this is often visible as Bitcoin failing at long term resistance such as the daily or weekly 200 period averages, while USDT dominance finds a new floor and begins to stabilise or slowly climb again.
In that phase the risk reward of holding risky assets deteriorates. Altcoin bounces fade, liquidity slowly drains and the market grinds downward rather than crashing. The key point is that by the time Phase C arrives, the best exit opportunities have usually already occurred during Phase B. For traders following the USDT.D signal, this means the current environment is less about fear of further immediate collapse, and more about preparing a strategy for that last exit wave.
5. Using the signal without over trusting it
A professional approach treats USDT dominance as one input among many, not as an oracle. There are several reasons for caution.
• Stablecoin supply can change structurally. Large issuances or redemptions related to regulatory events, corporate treasuries or exchange operations can move USDT.D independently of sentiment.
• Other stablecoins matter. The market today is not only USDT. USDC, FDUSD, algorithmic or collateral backed stablecoins all compete, and capital can rotate between them without touching Bitcoin at all.
• Dominance is a ratio, not an absolute measure. USDT.D can fall because stablecoin supply shrank, not only because coins rallied. That is why it must be cross checked with price action, on chain flows and BTC dominance rather than read in isolation.
Despite these caveats, the pattern you highlight — resistance touch, trend line contact, daily bearish divergence, followed by a down wave in USDT.D and an up wave in BTC and altcoins — has repeated often enough to deserve attention. The right way to incorporate it is to think in probabilities:
- The closer USDT.D is to that confluence zone, the lower the marginal benefit of panic selling Bitcoin.
- The first clear breakdown in tether dominance, especially if confirmed by a shift in BTC dominance and a stabilisation of daily candle structure, increases the odds that a tradable bottom is forming.
- In that environment, the strategy shifts from dumping into weakness to planning staggered exits into the anticipated relief rally.
6. Psychology: why not to capitulate near the bottom
The final message buried in this chart is psychological rather than technical. Every cycle, the majority of retail participants sell when conditions are most uncomfortable: near local lows, when USDT.D is stretched, fear indexes are elevated and social media narratives are most negative. They then watch prices recover without them, FOMO back in too late, and repeat the process in the next downswing.
Recognising that we are likely late in the fear leg of the current move does not mean blindly buying every dip. It means refusing to let panic be the only driver of decisions. If the roadmap is roughly correct, the rational options for someone already heavily invested are:
- Reduce size gradually on the way up during the relief phase, targeting major resistances rather than market selling into despair.
- Use the recovery to clean up low quality positions, rotate into stronger assets or even move a portion of the portfolio into long term stable reserves.
- Accept that missing the exact bottom is fine if it allows for calmer, more deliberate execution.
In other words, the chart is hinting that this may not be the smartest time to jump overboard. The water around the boat is choppy, but the shoreline of a relief rally is likely within sight.
Conclusion: one more wave before the tide truly turns
USDT dominance is not a magic tool, but it is a powerful lens on market behaviour. The current configuration — touching upper resistance, leaning against an ascending trend line, printing daily bearish divergence — is the sort of setup that in previous cycles has preceded short term Bitcoin bottoms and broad altcoin recoveries. Combined with a Bitcoin dominance structure that also looks late stage, the message is consistent: we are closer to the end of this down leg than the beginning.
From a professional analysis perspective, that does not translate into an unconditional buy signal. It translates into a shift in emphasis. Instead of asking how low panic can push prices in the next few sessions, the more relevant question becomes how to position for the last relief wave of the cycle and how to use that wave to improve the long term health of a portfolio.
Holding through the tail end of a drawdown is uncomfortable. The temptation to capitulate is strong. Yet the structure of USDT.D, cross checked with Bitcoin dominance and price action, suggests that discipline in this region may be rewarded with a more orderly exit opportunity on the other side. As always in crypto, the market will not send a calendar invite for that moment. But by reading the dominance charts rather than the headlines, you at least have a map of where you might be on the journey.
This article is for informational and educational purposes only. It does not constitute investment, trading, legal or tax advice. Cryptoassets are highly volatile and risky. Always conduct your own research and consider consulting a qualified professional before making any financial decisions.


