“Uptober” Broke Its Streak: Why Bitcoin Closed October in Red—and What November Could Bring
2025-11-02
Written by:Avery Grant
⚠ Risk Disclaimer: All information provided on FinNews247, including market analysis, data, opinions and reviews, is for informational and educational purposes only and should not be considered financial, investment, legal or tax advice. The crypto and financial markets are highly volatile and you can lose some or all of your capital. Nothing on this site constitutes a recommendation to buy, sell or hold any asset, or to follow any particular strategy. Always conduct your own research and, where appropriate, consult a qualified professional before making investment decisions. FinNews247 and its contributors are not responsible for any losses or actions taken based on the information provided on this website.
## TL;DR
October 2025 did not deliver the typical seasonal tailwind for crypto. Bitcoin ended the month lower, breaking the folk wisdom of “Uptober.” While the Federal Reserve delivered a widely anticipated 25 bps rate cut, markets were unimpressed, and risk assets digested a month of headline-driven chop. We explain what *actually* mattered—policy, liquidity, on-chain flows, and derivatives positioning—and propose a clean, risk-managed playbook for November.
> **Fact check:** Bitcoin closed October down on the month, snapping a multi-year streak of green Octobers. That close came just as the Fed cut rates by 25 bps, an outcome traders had largely priced.
---
## 1) The October surprise: seasonality lost to positioning
For a decade, crypto traders have leaned on a simple aphorism: *October is good for Bitcoin.* Seasonality, however, is a tendency—not a law. October 2025 offered a reminder that flows and positioning dominate folklore. Across the month we saw:
- **Heavy chop around macro headlines.** With a rate cut widely discounted, the marginal buyer of duration and the marginal buyer of crypto both looked to November/December catalysts rather than chasing beta into month-end. When price action became headline-sensitive, liquidity pockets thinned and intraday volatility did the rest.
- **Crowded longs and shallow liquidity.** The prior quarter’s run-up left funding prints frequently positive and spot-perp basis elevated. By mid-October, even modest negative headlines tripped cascading de-risking. The result: sharp but short-lived down-swings that reset funding and wiped a chunk of speculative leverage.
- **Asymmetric narrative risk.** Traders increasingly priced a “good news already in the tape” regime: a cut delivered, easing hints telegraphed, and a more constructive trade backdrop implied by diplomatic headlines. When those didn’t translate into immediate upside, fast money stepped aside.
The outcome was simple: seasonality met positioning and lost.
---
## 2) Policy still sets the weather—liquidity sets the climate
October’s macro anchor was the Federal Reserve. A 25 bps cut landed as expected, but markets care less about the move and more about the path. The nuance inside the policy mix matters:
- **Rate path:** A single 25 bps cut is a nudge, not a pivot. Markets need confidence about the pace and end-state of cuts to re-rate risk durably. With inflation still above target and growth cooling, the Fed’s message remained “conditional easing,” not a green light to lever every risk asset.
- **Balance-sheet signaling:** Traders also focused on the balance-sheet runoff glidepath. Even hints of slowing runoff (or ceasing it soon) are read as *effective* liquidity support by markets that have learned to front-run balance-sheet inflection points. While the cut was widely anticipated, the forward liquidity mix remains the real story to watch into year-end. (For context on the October decision and market reaction, see CoinDesk’s wrap. )
**Why this matters for crypto:** Crypto responds less to policy optics and more to *liquidity reality*. Three transmission channels matter most:
1) **Dollar liquidity:** Slower runoff and easier rates soften dollar scarcity. A weaker or range-bound DXY historically correlates with better crypto risk appetite.
2) **Collateral conditions:** Easier policy reduces VaR shocks across macro funds, freeing risk budgets for high-beta expressions, including crypto.
3) **Stablecoin supply:** When dollar liquidity conditions improve, fiat on-ramps and market makers expand balance sheets. A rising aggregate stablecoin float has repeatedly front-run crypto bull impulses.
---
## 3) On-chain tells: inventories, self-custody, and calmer hands
On-chain data are noisy day to day, but trends still guide:
- **Exchange inventories drifted lower through the month.** That’s usually interpreted as a *marginally* constructive signal—coins move to self-custody for longer holds, reducing immediate sell pressure. Remember, though: exchange wallet reshuffles can mimic outflows. The higher-confidence takeaway is simply that *no fresh wall of supply* appeared in October.
- **Dormant supply sits near cycle highs.** Coins untouched for 1–2+ years are historically associated with later-cycle consolidation and less reactive supply. Those holders aren’t the ones puking into every dip.
- **Realized profits vs. losses normalized.** After several violent sessions, net realized losses spiked briefly, then faded. Wash-outs that don’t escalate are precisely the kind of resets that set up better asymmetry for patient bids.
In English: the hands that wanted out mostly got out; the hands with time horizons stayed put.
---
## 4) Derivatives: the reset you needed, not the one you wanted
In September and early October, perpetual funding frequently leaned long and basis skews flagged crowded leverage. By the last week of October:
- **Funding cooled toward flat.** That blunts the reflexive feedback loop where longs pay to hold into drawdowns and get forced to reduce at the worst time.
- **OI distribution skewed shorter-dated.** After liquidations, open interest concentrated in near-term maturities; gamma becomes more impactful, making spot squeezes (both ways) easier to trigger around headlines and options expiries.
- **Volatility smile steepened.** Downside protection remained bid, but the vol premium over realized tightened. Translation: hedging got a bit pricier, but not panic-level expensive.
The net: positioning is cleaner into November than it was into October.
---
## 5) Microstructure: the order-book is thinner but fairer
Market depth at 1% from mid improved from the worst prints of the month, but not by much. Liquidity providers showed caution around macro tape bombs. The good news: spreads on Tier-1 venues held tight in liquid pairs, and cross-venue slippage remained manageable for non-impulsive rebalancing. The bad news: **chasey flows** (market orders following headlines) still had an outsized price impact. Smart execution—TWAPs, conditional orders, and patience—beat YOLO buttons in October.
---
## 6) A disciplined map for November
We structure November around three scenarios. These are **not** predictions; they are **prepared responses** with triggers and risk controls.
### A) Bullish continuation (35%)
**What happens:**
- Markets embrace a softer-landing narrative: inflation glides lower, growth cools but not collapses.
- Fed messaging plus balance-sheet signals are read as accommodative enough; dollar drifts, yields stabilize.
- Stablecoin float expands and spot demand leads. BTC dominance holds or rises as large caps catch first bid.
**Price behavior:**
- Bitcoin reclaims the monthly VWAP, converts it to support, and prints a series of higher lows on the daily.
- Pullbacks get bought at 20–30 day moving averages; realized volatility expands upward rather than downward.
**How to trade it:**
- Scale-in spot adds on reclaim-and-hold of key levels; avoid chasing vertical candles.
- Express upside via call spreads in maturities beyond the mid-month macro calendar to dodge gamma whips.
- Pair longs with quality relative-strength alts (names with catalysts and positive net inflows), but keep sizing modest—beta amplifies both ways.
### B) Range-with-up-bias (45%)
**What happens:**
- Mixed macro: cuts priced, growth mixed, headlines noisy. Liquidity improves at the margin but not enough to spark a melt-up.
- Derivatives stay orderly; funding oscillates around flat.
**Price behavior:**
- Bitcoin oscillates in a visibly mean-reverting band. Alts exhibit brief, rotational bursts.
**How to trade it:**
- Sell premium tactically when implied > realized, using defined-risk structures (short put spreads or iron condors). Roll frequently; avoid naked short vol.
- Run a mean-reversion core: buy near lower third of the band, reduce near upper third; keep stops outside noise.
- Maintain a small, persistent core long funded by option income.
### C) Down-shift/drawdown (20%)
**What happens:**
- A growth scare re-prices risk broadly; yields buck higher on supply indigestion or inflation surprise.
- A market-specific shock (large venue incident or adverse policy headline) hits weekend liquidity.
**Price behavior:**
- Fresh lower lows on expanding downside volume, with failed bounces at prior supports.
**How to trade it:**
- Respect stops. Replace discretionary hope with mechanical de-risking.
- Over-hedge directionally via put spreads; avoid selling vol into stress.
- Rotate to highest-quality balance sheets and liquid pairs; sit in cash/stablecoins until signals reset.
**Probability math note:** These weights are a starting point. Update them as new data land—particularly around mid-month policy communications and macro prints.
---
## 7) Key levels and signals to watch
- **Spot levels (illustrative):** Prior month close and monthly VWAP are your first guardrails. Weekly close above both = constructive. Lose both on rising volume = defensive.
- **Funding & basis:** Sustained positive funding after a red month is a yellow flag; a gentle premium with rising spot is healthy.
- **Stablecoin net issuance:** A rising aggregate float across top issues is historically bullish. Flat-to-down = expect range trade.
- **Exchange netflows:** A quiet backdrop with modest net outflows is fine; sharp net inflows on down days often precede additional pressure.
- **Volatility term structure:** Inverted term structure with surging front-end vol usually means patience pays; steep contango with low realized invites selling premium—carefully.
---
## 8) The macro calendar that matters (and why)
- **Policy communication windows:** Post-cut speeches and minutes will steer the liquidity narrative more than the cut itself. Markets will parse every line for balance-sheet hints.
- **Labor and inflation prints:** Soft-ish prints that validate easing without screaming recession are the sweet spot for risk.
- **Global trade headlines:** Rhetoric that points to tariff relief or de-escalation can relax growth scares, indirectly supporting crypto beta. Conversely, a tariff surprise can juice dollar strength and pressure crypto temporarily.
---
## 9) What changed structurally in October?
Three under-the-hood shifts are worth highlighting:
1) **The myth of guaranteed seasonality cracked.** That’s healthy. Markets work best when participants respect risk rather than recite memes. A de-meme-ified tape is less fragile.
2) **Derivatives became a tool, not a trap.** The month reset excess leverage without killing liquidity. That gives traders room to express directional views in November without being instantly steam-rolled by funding pain.
3) **Data dependency crowned king.** With one cut delivered and more under discussion, every new macro datapoint can shift the curve. Expect more efficient digestion of news: the tape may move *less* on the headline and *more* on the dots underneath (yields, dollar, basis, issuance).
---
## 10) For professionals: a concise playbook
**Portfolio construction:**
- Keep a core spot allocation sized to your drawdown tolerance. Avoid all-in/all-out toggles—they invite regret.
- Use options to shape payoff: call spreads for convex upside in the base/bull cases, put spreads as cost-capped crash insurance.
- Express relative value: long strength vs. short weakness inside crypto if your mandate allows. Correlation clusters will change; be ready to rebalance.
**Execution:**
- Favor passive execution unless a clear catalyst is imminent. TWAP your size; don’t be the liquidity.
- Respect the weekend: thinner books, faster moves. Size positions smaller into low-liquidity windows.
**Risk controls:**
- Pre-define pain points (price or volatility). The only unforgivable sin is letting a trade become a thesis.
- Track *implied minus realized* vol. When you’re paid to hedge, hedge. When you’re overpaying, look for structures that finance themselves.
---
## 11) A note on evidence vs. narratives
Crypto is a story-rich asset class. But **prices** respond to evidence: balance-sheet signals, positioning resets, issuance and flows, and realized volatility dynamics. October’s red close is not a repudiation of the cycle; it’s a reminder that the market is a negotiation between liquidity and belief. November will reward those who adjust probabilities as the data change.
For readers who track facts as well as frameworks:
- The *fact* of the 25 bps cut and Bitcoin’s red October close is well-documented in mainstream and crypto media reporting.
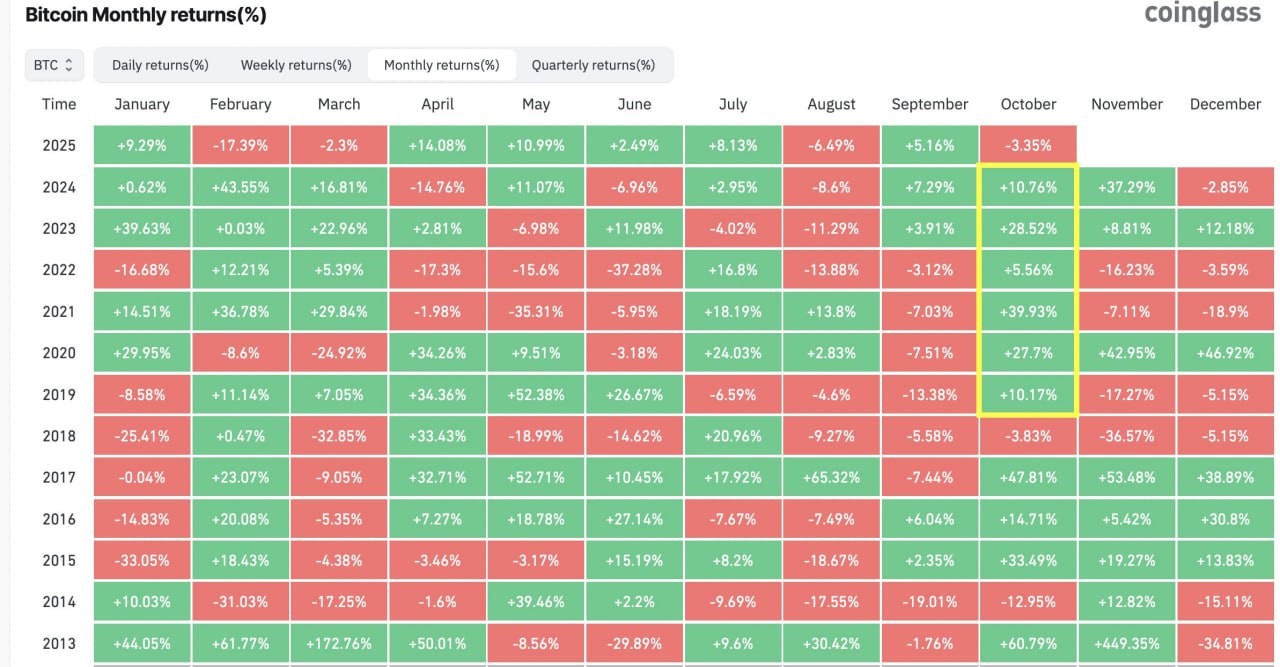
- Historical seasonality is a tendency, not a guarantee; heatmaps of monthly returns show that even strong months print red when positioning and liquidity argue otherwise (see aggregated return heatmaps across 2010–2025 for context).
---
## 12) Bottom line
“Uptober” broke, but the cycle didn’t. The Fed’s policy mix and forward balance-sheet signaling will continue to steer cross-asset liquidity, while on-chain and derivatives data suggest October’s wash-out left the market cleaner—not broken. November’s asymmetry looks better than October’s: not because seasonality demands it, but because positioning and liquidity now allow it.
Approach the month with humility, a checklist, and a bias for process over prediction. The edge is not having the perfect call—it’s having a framework sturdy enough to keep you solvent *while* the next big move forms.
---
### Disclaimers & Sources
This article is for educational purposes only and does not constitute investment advice. Markets involve risk, including the possible loss of principal. Key factual anchors referenced include CoinDesk’s post-FOMC wrap noting the 25 bps cut and Bitcoin’s negative October close (snapping the multi-year “Uptober” run) and public monthly return heatmaps for historical seasonality context.