
Top Deflationary Altcoins to Watch (Mechanics, Metrics, and 2025 Checkpoints)
Bottom line up front: A ‘deflationary’ altcoin is only as strong as the repeatable mechanics that remove supply and the durable demand that keeps tokens out of exchanges. In this deep-dive, we compare leading deflationary or quasi-deflationary assets—how they burn, how fast supply can realistically shrink, and the catalysts that could make those burns matter to price.
What ‘deflationary’ really means in crypto
In macroeconomics, deflation refers to a broad drop in prices. In crypto, the term is used more narrowly: the tradable token supply shrinks over time via fee burns, buyback-and-burn programs, or protocol-level caps. Whether that translates into higher price depends on demand, liquidity, and market regime. A chain can burn tokens every block and still underperform if there’s no utility, no users, or constant sell pressure elsewhere.
Common deflationary design patterns
| Pattern | How it burns | Strengths | Risks |
|---|---|---|---|
| EIP-1559 style base-fee burn | Protocol destroys a portion of every transaction fee (base fee) | Scales with on-chain activity; transparent on-chain accounting | Low activity = low burn; still needs organic demand |
| Real-time gas burn + scheduled burns | Ongoing burn from block gas + periodic buyback/burn events | Two sinks: continuous and discrete; visible milestones | Discretionary schedules; depends on revenue/treasury health |
| Revenue buyback-and-burn | Protocol uses a share of fees to repurchase and burn tokens | Links token sinks to real cash flow | Cyclical revenue = lumpy burns; governance can change rates |
| Community/validator burn | Ad-hoc burns funded by community tax or exchange support | Grassroots momentum; optics can be strong | Inconsistent, hard to forecast; may not offset issuance |
Tip: Always ask two questions: (1) Is the burn programmatic and recurring? (2) Does demand plausibly outpace emissions over a full market cycle?
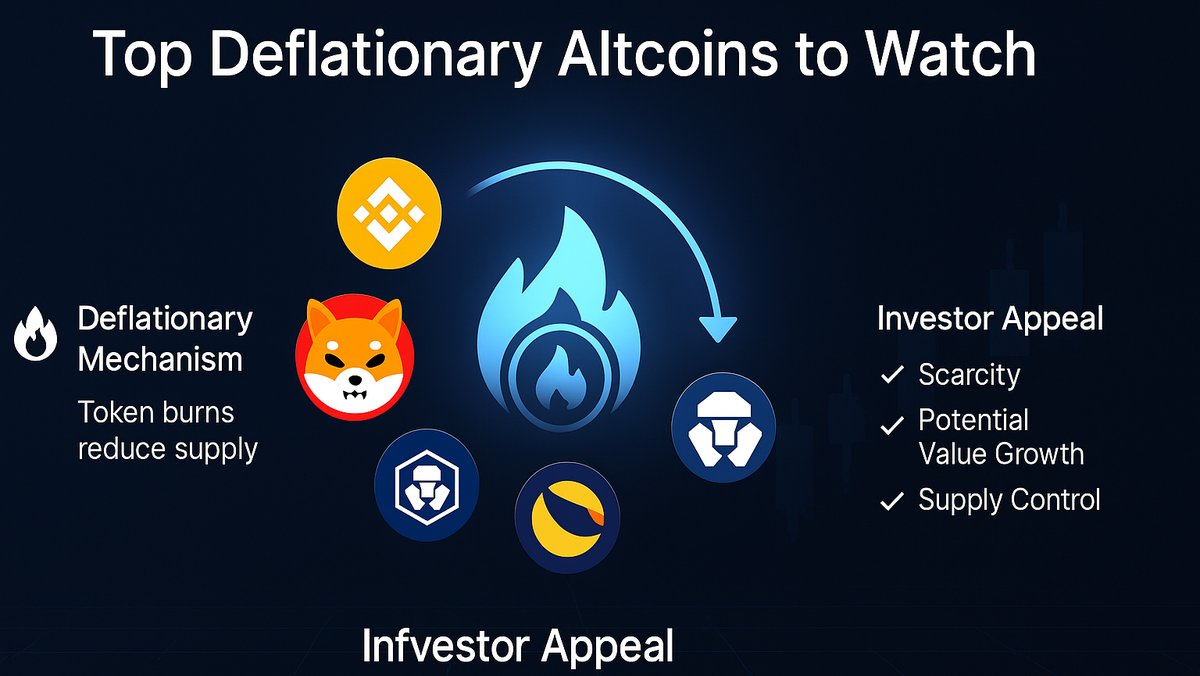
Top deflationary (or credibly deflationary) altcoins to watch
Metrics below are indicative ranges drawn from observed mechanics since EIP-1559-era design took hold industry-wide. Actual net supply change varies with usage and governance. Use them as a checklist, not as immutable facts.
1) Ethereum (ETH) — EIP-1559 burn + post-Merge low issuance
• Mechanism: Since EIP-1559, the base fee from each transaction is burned. After the Merge, ETH issuance fell substantially (validators instead of energy-heavy mining). When network activity is elevated, burn can exceed issuance — turning ETH net deflationary; at quieter times, ETH can be mildly inflationary.
• Observed trend (historical range): Annualized net supply change has oscillated roughly between about −0.6% and +0.5% depending on gas usage and L2 settlement flows.
• Why watch: ETH is the base collateral and settlement asset for a growing L2 stack and tokenized assets. If rollups, DeFi, and RWAs drive sustained gas consumption (including L2 batches settling to L1), the burn rate stays meaningful.
• Key 2025 checkpoints: L2 transaction volume, blob usage (data availability), staking participation/withdrawal cycles, and any fee-market tweaks that impact base-fee burn density.
• Risks: Prolonged low usage (bear phases), fee compression via data-availability upgrades shifting gas mix, or activity migrating to non-EVM domains.
2) BNB (BNB) — Auto-burn + BEP-95 real-time gas burn
• Mechanism: BNB has two sinks: (a) Auto-burn removes tokens periodically with a formula tied to price and chain activity; (b) BEP-95 burns a portion of gas fees in real time. Long-term target supply is 100M (down from initial 200M).
• Observed trend: Multi-year supply reduction has been material. Depending on activity and price, annualized deflation has often landed in the ~1.5%–3% zone over longer windows, but it’s variable.
• Why watch: Clear, mechanical path toward a capped supply plus heavy exchange and BNB Chain ecosystem usage (DEXs, launchpools, staking, gas).
• Risks: Burns slow in low-activity regimes; regulatory headwinds or ecosystem rotation could reduce gas throughput.
3) Polygon (MATIC → POL) — EIP-1559-style burn on PoS + 2.0 tokenomics
• Mechanism: Polygon PoS implemented EIP-1559-style base-fee burn (for MATIC). The broader Polygon 2.0 plan migrates to POL with a multi-chain staking role. Burn magnitude depends on chain usage and tokenomics rollout.
• Observed trend: Historically, base-fee burn existed but was modest versus MATIC emissions due to low per-tx gas costs. Under higher throughput and broader POL utility, net supply could tilt closer to neutral or mildly negative at times.
• Why watch: If Polygon’s L2 ecosystem (zkEVM, AggLayer routing) and enterprise use ramp, fee volumes—and thus burns—compound across multiple chains.
• Risks: If migration stalls, or if activity consolidates on rival L2s, burn remains too small to offset emissions.
4) Fantom (FTM) — Protocol fee burn
- Mechanism: A portion of Fantom’s transaction fees is burned at the protocol level (parameterized by governance). As network usage increases, so does the effective burn rate.
- Observed trend: Burns scale with DeFi and payments activity; historically insufficient to be persistently net-deflationary without strong demand, but can meaningfully reduce effective inflation in active periods.
- Why watch: If throughput from high-frequency apps (perps, payments) expands, on-chain burns help tighten supply.
- Risks: Ecosystem competition and incentive shifts can drain activity, starving the burn.
5) Shiba Inu (SHIB) — Programmatic + community burns, Shibarium linkage
- Mechanism: SHIB implements community-driven burn portals and mechanisms linked to Shibarium activity (gas in BONE → SHIB burns). Supply is huge, so burns need to be large and sustained to move the needle.
- Observed trend: Burn events spike around campaigns and chain milestones; annualized rates are volatile.
- Why watch: If Shibarium achieves durable usage (DEX, gaming, payments), recurring burns could become more predictable.
- Risks: Burns may be more promotional than fundamental; demand must be organic, not only community-coordinated.
6) OKB (OKB) — Exchange revenue buyback-and-burn
- Mechanism: OKX has long run a buyback-and-burn program using a share of exchange revenue. This links token sinks to real business performance.
- Observed trend: Burns are lumpy but can be sizeable in high-volume quarters.
- Why watch: If spot/derivatives cycles heat up, revenue expands and so do burn tranches.
- Risks: Program is discretionary; regulatory or volume shocks can shrink buybacks.
7) PancakeSwap (CAKE) — DEX revenue burns + tokenomics revamps
- Mechanism: CAKE’s model includes using protocol revenue to buy back and burn tokens. Governance has iterated tokenomics to target long-run supply reduction and better emissions control.
- Observed trend: Burn intensity correlates with trading fees, farm activity, and new product lines (perps, position managers, restaking integrations).
- Why watch: If DEX volume and fee products broaden (cross-chain, perps), buyback-and-burn can materially tighten float.
- Risks: Lower volumes or aggressive liquidity incentives can dilute the burn impact.
Honorable mentions (technically deflationary, practically slow)
- XRP: Transaction fees are destroyed (burned), making XRP technically deflationary—but fee levels are tiny relative to total supply; practical impact on supply is minimal in normal conditions.
- XLM: The network can destroy fees, but magnitudes are small; not a strong investment case on deflation alone.
- LUNC: Community/exchange-supported burns can be large episodically, but are unpredictable; fundamental demand is the gating factor.
Quick comparison table (mechanics & indicative ranges)
| Token | Mechanism | Target/Cap | Indicative net supply trend* | Why it matters |
|---|---|---|---|---|
| ETH | EIP-1559 base-fee burn + low issuance (PoS) | No fixed cap; supply reacts to usage | ~ −0.6% to +0.5% depending on activity | Deflation potential tied to L2/RWA/DeFi settlement demand |
| BNB | Auto-burn + BEP-95 real-time gas burn | Long-term 100M target | Often −1.5% to −3% multi-year; variable | Clear, mechanical path plus BNB Chain utility |
| POL (ex-MATIC) | EIP-1559-style burn on PoS + evolving 2.0 tokenomics | Programmatic emissions; multi-chain staking role | Neutral to mildly deflationary in high-usage regimes | Burn can scale if Polygon’s multi-chain throughput grows |
| FTM | Protocol fee burn (parameterized) | Emission schedule + fee burn | Reduces effective inflation; usage-dependent | High-frequency DeFi usage=meaningful offset |
| SHIB | Community & Shibarium-linked burns | Huge initial supply; burns need scale | Highly volatile; event-driven | Upside if Shibarium utility turns recurring |
| OKB | Revenue buyback-and-burn | Program is ongoing; supply shrinks over cycles | Lumpy, tied to exchange performance | Direct link to real revenue |
| CAKE | DEX fee buyback-and-burn + tokenomics control | Governance-controlled emissions | Variable; stronger in high-fee periods | Tracks DEX product breadth and volumes |
*Ranges are illustrative and depend on chain usage, governance parameters, emissions schedules, and market regimes. Always verify on-chain/current figures.
How deflation translates (or doesn’t) into price
- Supply sink must be recurring and usage-tied: Burns powered by real activity (gas, fees, volume) are more durable than one-off events.
- Float matters more than headline supply: If staking or long-term holders remove tokens from exchanges, fewer coins are available to sell into rallies; deflation amplifies this effect.
- Macro & liquidity set the multiple: In risk-on phases, markets pay a premium for shrinking supply; in risk-off, even solid burns can be ignored.
What to track in 2025 (practical dashboard)
• ETH: Base-fee burn per day, L2 batch settlements, blob gas utilization, percent of supply staked vs. exchange balances.
• BNB: BEP-95 burn per block, quarterly auto-burn figures, BNB Chain daily active addresses/tx count.
• POL/MATIC: Aggregate Polygon (PoS + zkEVM + AggLayer) txs/day and burned base fees; emissions vs. validator rewards.
• FTM: Total fees, burn share, unique signers, and TVL for major Fantom dApps.
• SHIB: Shibarium throughput, SHIB burn from gas conversions, and exchange netflows for SHIB.
• OKB/CAKE: Quarterly fee revenue and buyback reports; DEX volumes, perps fees, and net LP incentives.
Investment playbook (without the fluff)
• Don’t buy the word ‘deflation’. Buy the mechanism + the usage. If daily on-chain usage and fee revenue aren’t growing, the burn won’t save you.
• Size positions with emissions reality: If issuance > burn in quiet months, expect cyclic inflation and fade pumps accordingly.
• Prefer tokens with multiple sinks: (e.g., ETH’s burn + staking usage; BNB’s gas burn + auto-burn) over one-trick burns.
• Verify on-chain: Use explorers/dashboards to confirm burn txs, total supply, and exchange balance trends.
• Mind governance risk: Boards/DAOs can alter burn shares, emissions, or buyback cadence. Read proposals.
Mini case studies
Case 1 — ETH during high-demand windows
When L2 settlements, DeFi liquidations, and NFT/RWA activity surge together, burned base fees can outpace validator issuance for weeks. In those windows, net ETH supply declines. If exchange balances also trend down, price often responds with higher beta than the broad market—especially if BTC dominance stalls.
Case 2 — BNB in exchange-led cycles
In derivatives-heavy periods, exchange revenue climbs. Auto-burn formulas and BEP-95 combine to retire more BNB, and the market tends to reward the predictability of scheduled burn events. Visibility (‘next burn in X days’) can catalyze anticipatory flows—though the real driver is sustained BNB Chain activity.
Case 3 — Community burn optics (SHIB)
Large, one-off community burns can spark headlines, but if on-chain activity doesn’t stick, price impact fades. The more compelling story is recurring Shibarium-driven burns that show up each week regardless of Twitter hype.
FAQs
Is a token with any burn automatically deflationary? No. If emissions exceed burns over time, net supply still rises. You need net negative issuance for true deflation over a period.
What’s better: protocol burns (EIP-1559) or buyback-and-burn? Protocol burns are transparent, algorithmic, and tied to usage. Buybacks tie to revenue but can be discretionary. Both can work—look for consistency and scale.
Can deflation compensate for weak fundamentals? Rarely. Without user demand, burns are too small to matter. Price is a function of both shrinking float and rising willingness to pay.
Editor’s view: the 2025 watchlist in one sentence each
• ETH: The only large-cap where usage-led burns can plausibly keep net supply near or below zero for extended stretches.
• BNB: Among the most structurally deflationary top tokens thanks to dual sinks and a hard target supply.
• POL (ex-MATIC): Quietly compelling if Polygon 2.0 turns multi-chain throughput into a unified burn footprint.
• FTM: A call option on high-frequency DeFi returning to Fantom—burns matter most when volumes do.
• OKB/CAKE: Revenue-linked burns; treat them like equity buybacks in a cyclical business—great in booms, thin in busts.
• SHIB: Speculative unless Shibarium usage becomes routine; if it does, recurring burns become investable, not theatrical.
Disclosure: This article is for education, not investment advice. Crypto assets are volatile and you can lose all capital. Always verify burn and supply data on-chain and review current governance parameters before acting.


