

Two charts, one message: TAO has reclaimed its mid-range and is pressing an 18-month downtrend line. A decisive daily close above the box top (~$590–600) projects a measured move toward ~$940–1,050, with extensions to $1.15–1.30k if momentum persists. Here’s the map — and how to ‘#TAO ADD more’ without chasing
TAO just printed the kind of recovery that turns fear into opportunity. The two charts you shared — Bybit perp with a clean descending supply line and Binance spot with a year-long accumulation box — are telling a consistent story: structure has reset in bulls’ favor, and the market is knocking on the door of a range expansion that can plausibly carry into four digits.
What Each Chart Says
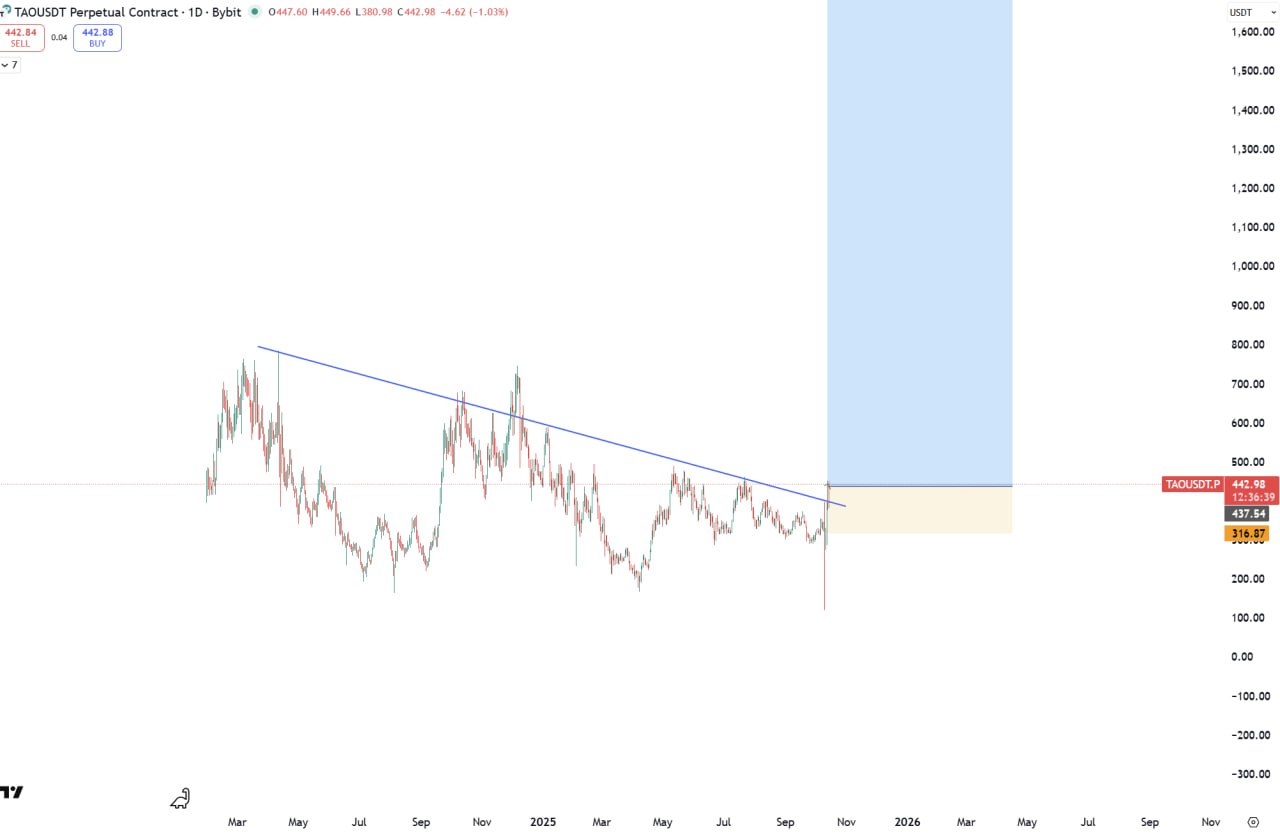
The Downtrend Kiss (Bybit perp)
- An 18-month descending trendline connects lower highs from early 2024. Price has reclaimed the beige demand band (~$320–440) and is now pressing that diagonal around $440–450.
- Bullish sequence to watch: break → shallow retest → expansion. A daily close above the line, followed by a higher low that holds ~$430–445, flips that supply into support.

The Box Math (Binance spot)
- TAO has lived inside a wide range roughly $230–$600. We just reclaimed the midline ($410–450) with impulse and minimal give-back — a sign that spot demand absorbed the liquidation wick.
- Measured-move mechanics: range height ≈ $350–370. A sustained break and acceptance above $590–600 projects $930–$970 (add height to breakout line), with typical momentum extensions to $1.02–$1.06k (1.272×), $1.15–$1.20k (1.618×), and a stretch toward $1.30k (2.00×) if trend broadens.
Level-by-Level Roadmap
- Immediate supports (buy-the-dip zones): $430–445 (trendline break-retest pocket), $395–405 (box midline reclaim), and in an edge case $360–370 (last higher-low preservation).
- Breakout trigger: Daily close > $590–600 and 4–12h acceptance above the level. That opens the measured move toward four digits.
- Upside checkpoints / scale-out zones: $720–750 → $820–860 → $940–1,050 → $1,150–1,300.
- Invalidation: Daily close < $395 (midline lost) weakens the immediate thesis; a daily close < $360–365 invalidates trend continuation and risks a revisit of $300–320.
#TAO ADD More — A Disciplined Build Plan
Example for spot exposure; tailor to your risk.
- Starter (30%) on confirmation: 4h close above the diagonal, entries $440–455, stop on a daily close back below $398.
- Continuation add (30%) only after a daily close & hold > $590–600 (don’t chase the first wick).
- Pullback add (20%) if a higher-low forms on a retest of $430–445 (hold above reclaimed supply).
- Breakout flag add (20%) on a tight consolidation that resolves upward above $600 (e.g., 4–8h bull flag).
Stops & risk: For the diagonal-based entries, manage risk beneath $392–398 on a closing basis. For adds above $600, trail under the flag low (often $560–575) to avoid a failed breakout.
Derivatives note: TAO wicks are ruthless. If using perps, keep leverage modest and size the stop to survive a 3–5% intraday spike. Better yet, anchor with a spot core and hedge tactically.
What Would Confirm the March to Four Digits
- Market-structure shift: Higher-high through $600, then a higher-low that holds $560s.
- Spot-led participation: Rising spot volume while perps funding stays near flat to mildly positive (not overheated).
- No fast give-back after tagging $720–760 — acceptance above that shelf typically fuels the next leg.
What Would Negate It (Near Term)
- Hard rejection at the diagonal with a swift drop back under $420 on expanding volume.
- Upthrust & fail: Wick above $600 that closes the day back below $560, followed by loss of the midline — that sends price back into range rotation.
Trading Tactics After the Purge
- Scale out into strength: 25% at $720–760, 25% at $820–860, 25% into $940–1,050, trail the rest for $1.15–1.30k.
- Don’t chase gaps: If we gap over $600, let price retest $600–615 (4–8h) before adding size.
- Respect the midline: As long as TAO holds above $395–405, the bull thesis remains intact even if breakout timing wobbles.
Context & Caveats
TAO carries AI-beta; broader AI/semiconductor risk sentiment can amplify or mute moves. The capitulation wick visible on both charts likely reflected liquidity/venue dynamics more than fundamentals — useful for resetting positioning, but it argues for wider stops than usual. This analysis is technical in nature and not investment advice; adapt entries, sizing, and invalidations to your timeframe.
Bottom Line
The evidence from both charts aligns with your hashtag thesis: “#TAO break the box → four digits.” The cleanest path is reclaim the diagonal, clear $600, then let the range-expansion math pull price toward $940–1,050 and potentially $1.15–1.30k. Build with a tiered add plan, defend the midline, and let spot demand do the heavy lifting.


