
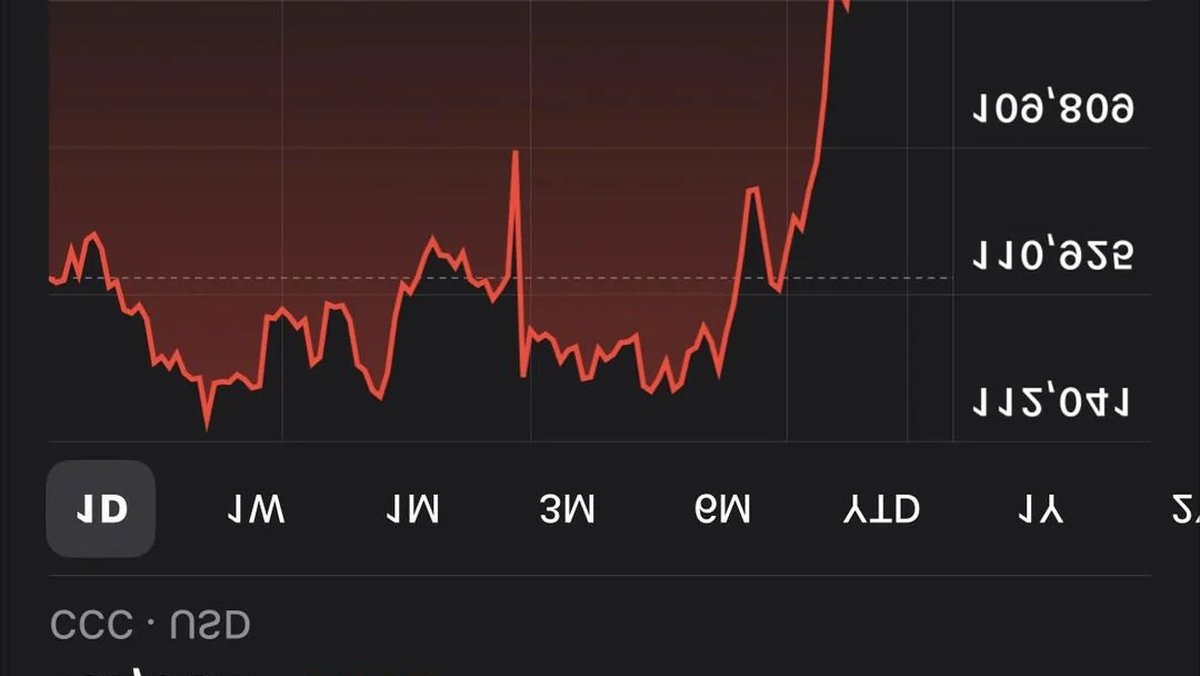
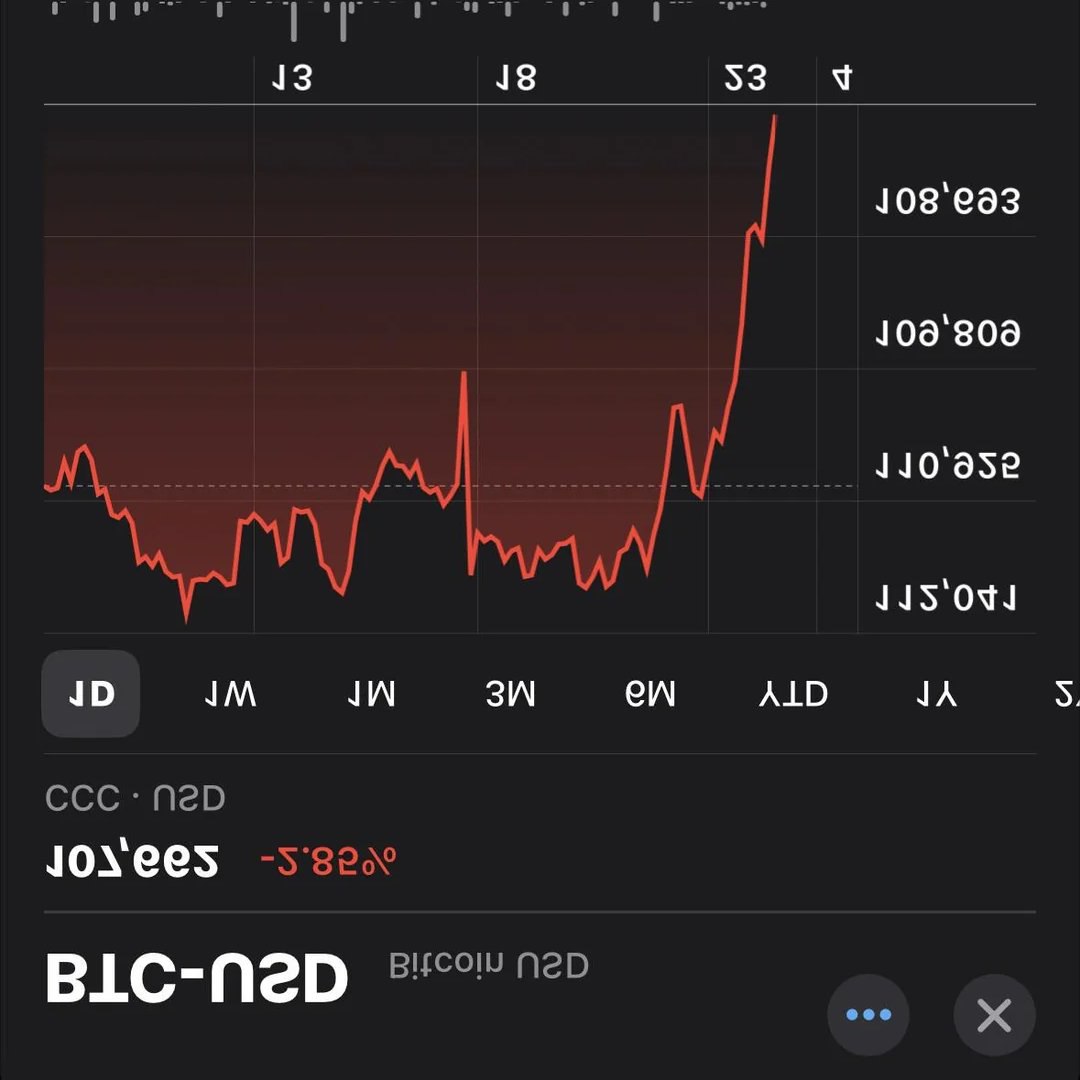
Doesn’t Look That Bad… If You Flip the Chart
The screenshot above is literally upside down, and that’s the point. When you rotate a chart, the same sequence of candles suddenly feels less threatening and more like an opportunity. Nothing in the underlying order book changed — only your frame did. This little trick exposes how fragile our reading of price can be when it is based on emotion and a single time slice.
Uptober Didn’t Go as Planned — Now What?
Every cycle gives us a month with a catchy slogan, and sometimes the market refuses to cooperate. The absence of a euphoric “Uptober” doesn’t invalidate the longer story; it simply compresses time and forces weak assumptions to surface. Trends rarely die because of one nasty candle. More often, they stall, rebalance positioning, and then decide whether to extend or to mean-revert.
When price chops after an expected run, the temptation is to zoom into five-minute candles and fight every wick. That is usually where drawdowns accumulate. The antidote is perspective: step back to daily/weekly structure, evaluate where price sits vs. prior bases, and ask, “Is this distribution, or is this a reset with improving risk-reward?”
Flip-to-Check: A Simple Antidote to Bias
- Recency bias: The last candle screams the loudest. Flipping the chart mutes that voice and makes you test the structure, not your fear.
- Loss aversion: Red candles feel heavier than green ones. Inverted, the same move looks like a constructive pullback. Neither view is truth; the exercise simply slows your snap judgment.
- Anchoring: A single failed breakout often anchors our entire outlook. Rotating the view forces a re-anchor on levels and trend, not on a headline.
What the Structure Usually Asks You to Do
Markets move in three broad regimes: trend, range, and transition. Post-meme months like this are almost always a transition — a pause to digest leverage, harvest overconfidence, and check whether spot demand still shows up without the slogan. In that pause, your job is not to predict the exact next candle. Your job is to survive to the next obvious trade.
A Quick Scenario Map
1. Continuation after retest: Price defends a prior breakout area on the daily/weekly, builds higher lows, and squeezes shorts with steady spot bids. You’ll see flat-to-mild funding, rising open interest with less volatility, and volume that migrates from perps to spot. The signal is acceptance back above the most recent lower high.
2. Range and rotation: Price oscillates between a well-defined support and resistance band. This is where patience pays — sell edges, buy edges, ignore the middle. A range is not a moral failing; it’s a factory for the next trend.
3. Deeper flush, then rebuild: The market undercuts a weekly level to clear liquidity. If the trend is alive, it reclaims the breakdown within a few sessions. If it cannot reclaim, that was not a trap — it was the start of a larger mean reversion. Your invalidation is the edge.
A Practical Perspective Checklist
• Zoom hierarchy: Start at the weekly, then the daily, only then the intraday. Many “crashes” are just weekly wicks.
• Log, not only linear: On large assets, log scale reveals rhythm across cycles. Linear exaggerates the most recent move.
• Levels & structure: Mark prior weekly closes, swing highs/lows, and the last area of true acceptance. Trade from those, not from feelings.
• Spot vs perps: When rallies are perp-led with hot funding, they die faster. Spot-led advances persist. You don’t need perfect data to sense this — just compare where volume shows up.
• Time, not only price: Consolidation through time (going sideways) often repairs a market better than V-shape squeezes. Give bases the time they need.
Risk First: The Discipline to Wait
Patience is a position. You are allowed to do nothing until the market pays you for action. A few simple guardrails will keep you in the game:
- Position sizing: Pick a max portfolio drawdown you can emotionally tolerate (e.g., 10–15%) and size positions backward from that limit.
- Defined invalidations: Every trade needs a level that, when lost on a closing basis, ends the idea. Not a feeling, a level.
- Staggered entries: Use partial entries at levels you would be happy to defend. If you wouldn’t add on a 5–8% dip, your first entry was likely too big.
- No revenge leverage: Drawdowns invite you to “win it back” with size. Don’t. That’s how winning months turn into lost quarters.
Read the Candle, But Judge the Story
A single candle can be a trap, a liquidation, or real trend information. The difference is follow-through. Ask:
- Did the move hold into the close on higher timeframe charts?
- Was there acceptance above/below a key level for several sessions, not minutes?
- Is breadth improving (more majors and quality alts confirming), or is it a narrow squeeze?
If those answers lean positive, the candle mattered. If not, it was noise — especially in headline months.
Practical Habits to Escape the Screen Loop
“Remember: there’s life outside crypto.” That’s not a platitude; it’s an edge. Clear minds trade better. Try this three-step routine:
- Time-box the market: Choose two focus windows per day (e.g., 30–45 minutes each). Outside those windows, silence alerts.
- Move your body: A walk, a workout, or even stretching will reset your nervous system and reduce impulsive clicks.
- Journal once, not constantly: Write your plan before the session, then execute. Don’t rewrite your thesis every hour.
From Fear to Framework
Flip the chart. Ask what you would do if the move were in your favor. Would you be patient for a higher-low? Would you welcome a retest? Then treat the current path with the same rationality. If the higher-timeframe trend is intact, a pause is exactly what you want; it lets new participants in and pushes weak hands out without changing the destination.
Bottom Line
Uptober may have fizzled, but one messy month is not a verdict on the cycle. The market pauses before it trends — and those pauses are where disciplined traders find their edge. Keep your zoom honest, your risk defined, and your life larger than a chart. The candle will pass. Your process should not.
Note: This is analysis and commentary, not investment advice. Be cautious.


