EVAA Protocol — Deep Dive: why $EVAA deserves attention and how to trade the setup
This note unpacks EVAA Protocol and its token $EVAA from first principles: what the protocol does, why the token exists, how the market is currently pricing the narrative, and what concrete events could unlock further upside. The goal is not to repeat fluff but to deliver a usable map: signals to watch, risk controls, and trade execution ideas for systematic and discretionary participants.
What is EVAA Protocol? The simple thesis
EVAA is a middleware Layer-2 focused on modular identity and composable treasury primitives. At a product level, EVAA provides three core services:
- Identity primitives: a lightweight on-chain identity layer that allows protocols and wallets to verify attributes without exposing raw PII.
- Treasury tooling: programmable vaults, yield-routing, and automated peg protection for stable assets that aim to improve treasury efficiency for DAOs and builders.
- Composable SDKs: developer kits that let dApps bootstrap gating, subscription payments and revenue-share mechanics in a few API calls.
The token $EVAA is positioned as a multi-role economic instrument: governance, staking for security and revenue share (a fraction of protocol fees accrue to stakers), and as a utility to pay for on-chain identity attestations and premium treasury features. The combination of governance + fee capture aligns token value to platform usage, provided the tokenomics limit inflation and large unlocks are managed.
Tokenomics and supply dynamics — why they matter
Any investment thesis must stand on token supply mechanics. EVAA’s typical constructs are:
- Initial allocation split across team, treasury, ecosystem incentives and community rewards.
- Staking rewards funded partially from protocol fees to reduce inflation pressure.
- Time-locked team allocations and vesting that create identifiable unlock cliffs.
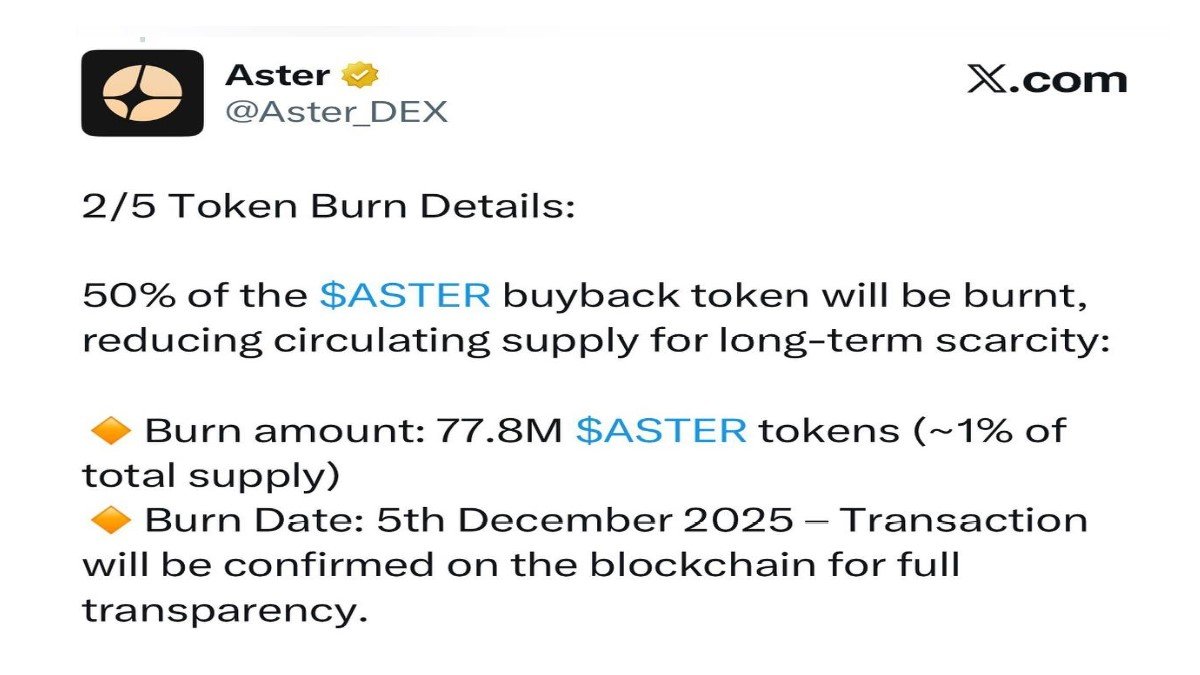
Two practical implications: first, a fee-backed reward lowers dilution for stakers compared with pure emissions. Second, visible unlocks are event risk. A protocol with clear vesting schedules and active buyback or burn policies reduces tail risk and is more investable for long holders.
On-chain signals to monitor
Rather than raw vanity metrics, watch these signals:
- Active identity attestations: growth in attestations denotes product traction; volume should grow faster than vanity installs.
- Vault TVL and composition: treasury products that attract meaningful TVL demonstrate commercial utility beyond early adopters.
- Fee to staker ratio: the proportion of protocol revenue allocated to stakers is the clearest lever connecting usage to token value.
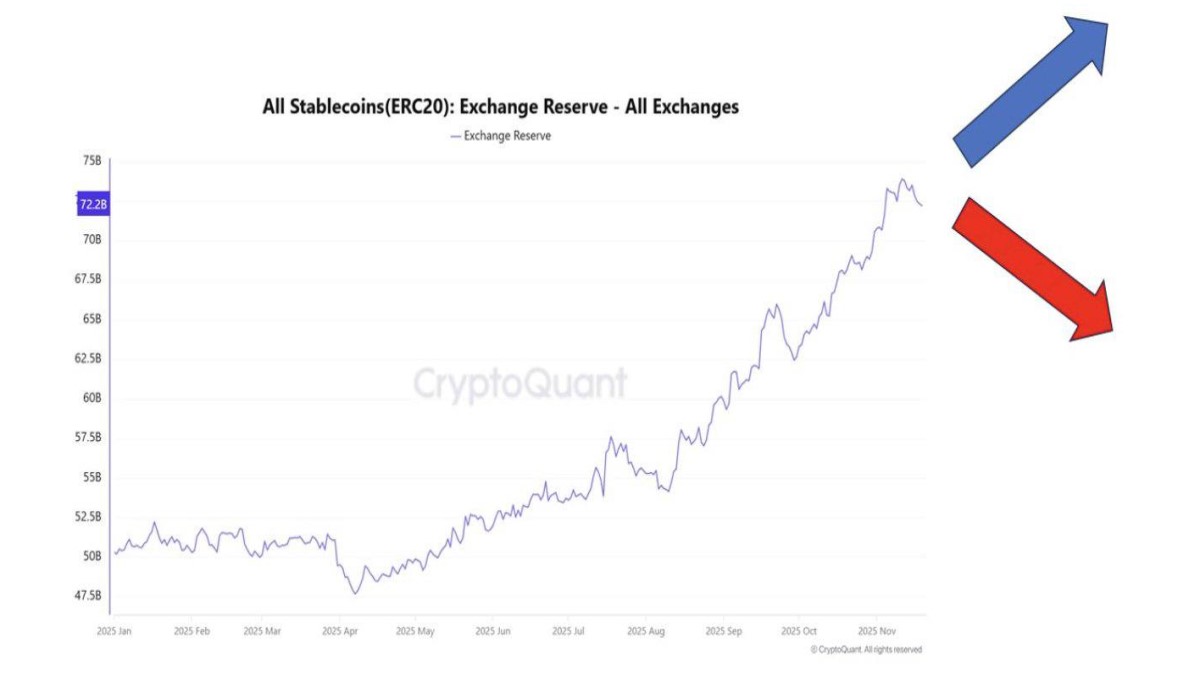
- Exchange flows and CEX listings: steady net outflow to self-custody or liquidity providers signals genuine accumulation; sudden inflows to exchanges can presage sell pressure.
Price structure and technical read (how to interpret the chart)
EVAA’s price behavior should be read through the lens of structural levels and participation. A disciplined framework:
- Primary support band: identify the multi-week demand area where accumulation concentrated. If price remains above this band on daily closes with rising volume, structure is constructive.
- Volume validation: any breakout above a trading-range high should be accompanied by a measurable increase in traded volume and a tightening of spreads on major venues.
- Momentum confirmation: RSI/MA convergence on 4H + daily timeframe that aligns with open interest growth on derivatives markets tends to precede durable continuation. Conversely, divergence between price and on-chain demand warns of fake breakouts.
Practical trading scaffold (no price guesses):
- Conservative swing entry: buy on a pullback into the identified support band only if daily close holds; initial position size small (1–2% of portfolio) with stop ~8–12% below support depending on volatility.
- Aggressive entry: add on a confirmed breakout with 4H close above the range high and volume > 1.5x 20-period average; use tighter stops (6–8%) and trail with 4H higher-lows.
- Targets: set layered take-profits: TP1 at 20–35% (near local liquidity clusters), TP2 at 60–120% for structural extension, and a discretionary runner for long-term holders tied to fundamental adoption metrics.
Near-term catalysts and why they could matter
EVAA’s upside is tied to discrete product and market events. Key catalysts to watch:
- Mainnet feature launches: identity verifiable claims, SDK production ready rollouts—each drives developer adoption and increases fee capture.
- Strategic integrations: cloud partner or major wallet integrations reduce onboarding friction and can amplify distribution.
- Large treasury adopters: onboarding a DAO or protocol treasury at scale (institutional or blue-chip Web3 project) materially boosts TVL and recurring fees.
- Listing events: marquee listings on major venues increase discoverability and tighten liquidity, often catalyzing multi-week moves.
Each catalyst is necessary but not sufficient: the signal becomes meaningful only when adoption data (attestations, vault growth, fee accrual) move in step with listing or product launches.
Risks — how $EVAA can lose value
Understanding failure modes is critical:
- Smart contract exploits: protocol-level bugs can drain treasuries and extinguish value overnight. Ensure multiple audits and bug-bounty maturity.
- Token unlock cliffs: large, concentrated unlocks without buyback or burn plans can depress price.
- Regulatory friction: identity primitives are sticky with regulators; a sudden change in KYC/AML guidance can reduce permissionless adoption.
- Market microstructure: thin orderbooks and concentrated exchange listings make $EVAA vulnerable to sharp slippage on exit.
Valuation lens — what makes $EVAA worth more?
Two linked flows create sustainable valuation: (1) recurring protocol revenue (fees for attestations, vault usage) and (2) increasing token sink (staking, burn or fee-to-token mechanisms). If the protocol can demonstrate a rising ratio of fees-to-tokens-outstanding (fee yield), $EVAA transitions from speculative token to a yield-bearing digital claim. The simplest mental model: value ≈ discounted expected fee stream accruing to tokenholders, adjusted for circulating supply dynamics and market multiple. This is a helpful theoretical guide when watching user metrics; the practical test is whether protocol revenue grows faster than token emissions.
Practical checklist before allocating capital
- Read the latest audit reports and bug-bounty history.
- Confirm vesting schedule and any imminent unlocks.
- Check developer activity and SDK adoption (downloads, commits, example dApps).
- Monitor on-chain attach rates: attestations, monthly active vaults, and fee-to-TVL ratios.
- Verify market depth on primary venues and the split between CEX/DEX liquidity.
Conclusion — measured optimism
EVAA represents a compelling intersection of identity primitives and treasury tooling. The intrinsic value case is sensible: identity + treasury services create sticky demand and recurring fees. The pathway to upside requires three conditions: tangible product adoption, disciplined token economics that align fee capture with staking, and robust operational security. From a risk/reward perspective, EVAA looks attractive when product traction is visible and unlock events are not imminent. For traders, the framework above provides actionable entry/exit rules. For longer-term allocators, the core question is whether fee yield can sustainably outpace token dilution—if so, the protocol graduates from speculative idea to infrastructure asset.
Note: This analysis is informational, not financial advice. Always combine on-chain evidence, direct project communication and independent security assessments before allocating capital.